Water Supply and Use (Cambridge International IGCSE Geography)
Global Water Supplies
Spec point —
3.6.1· Describe methods of water supply & the prooprtions used for agriculture, domestic & industrial purposes in countries at different levels of economic development
Global water supply
-
Only 2.5% of the water on Earth is freshwater
-
Approximately 68.7% of freshwater is stored in glaciers and ice sheets and 30% is groundwater
-
The remaining 1.3% of freshwater is in rivers, soil moisture, lakes and the atmosphere
- This is not evenly distributed across the globe—Canada contains more lakes than the rest of the world combined
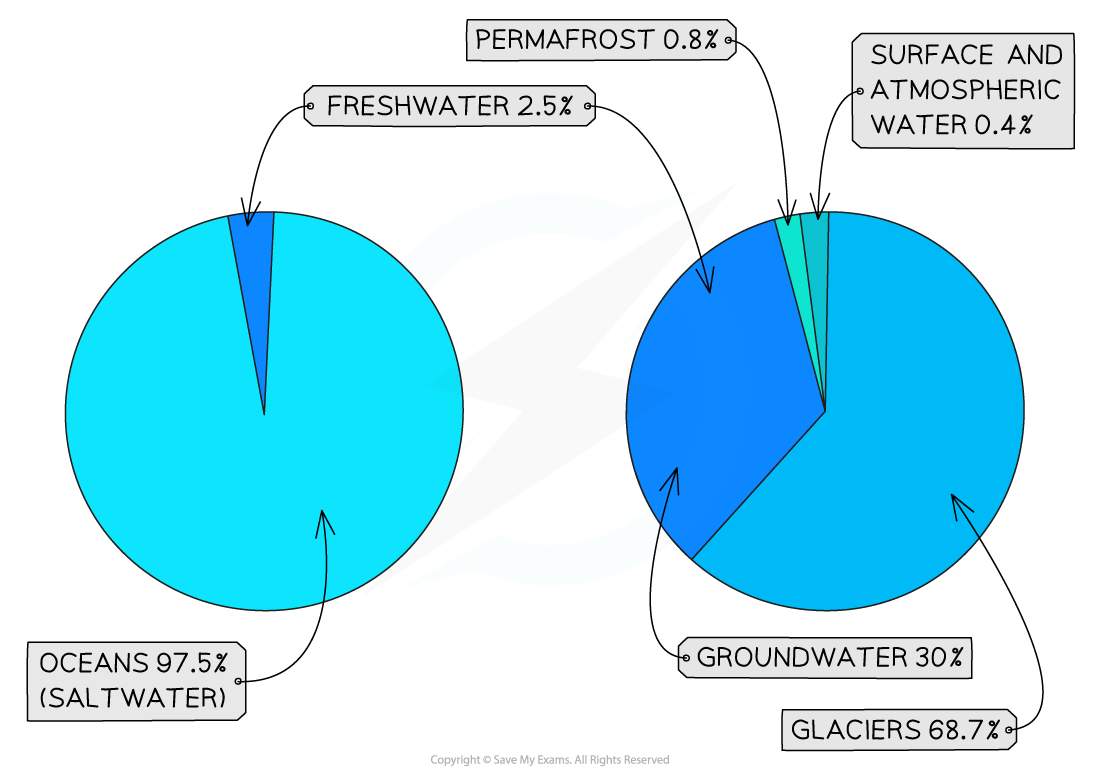
Pie chart showing sources of water.
(note: due to rounding of figures, the % on the pie chart to the right adds up to 99.9%)
Water supply
-
The supply of water humans use comes from three main sources:
- Lakes and rivers
- Aquifers
- Reservoirs
-
Other sources of water supply include:
- Desalination
- Rainwater harvesting—collecting water that falls as precipitation
Groundwater/aquifer
-
Water stored underground
-
The water has filtered through soil and rocks
-
It is obtained by drilling boreholes or digging wells
-
When all the rock is fully saturated with water, it is an aquifer
-
Groundwater may also come to the surface as a spring
-
Issues with groundwater/aquifers include:
- Overuse or over-abstraction of water in some areas means that aquifers do not have time to recharge through precipitation
- Pollution from industry, agriculture and domestic waste can leach into the groundwater
Surface water
-
Water is stored in lakes, reservoirs, and rivers
-
Issues with surface water include:
- Pollution from industry, agriculture and domestic waste can enter the water system through surface runoff
- Dams are used to store water in reservoirs, but the construction of dams has slowed due to a lack of suitable sites and concerns regarding the environmental impact
Desalination
-
The removal of salt from seawater means that it can be used for domestic, agricultural and industrial purposes
-
Issues with desalination include:
- Expensive to set up and run
- Desalination plants use a lot of energy
Global water use
-
Global water use by sector is:
- 70% agriculture—irrigation of crops and water for livestock
- 20% industry—producing goods and generating energy
- 10% domestic—toilets, cooking, cleaning, washing
-
The use by sector varies across countries depending on whether they are MEDCs or LEDCs
Water demand
- The global demand for water is increasing
- Between 1934 and 2014, demand increased from 1 trillion m3 to 4 trillion m3
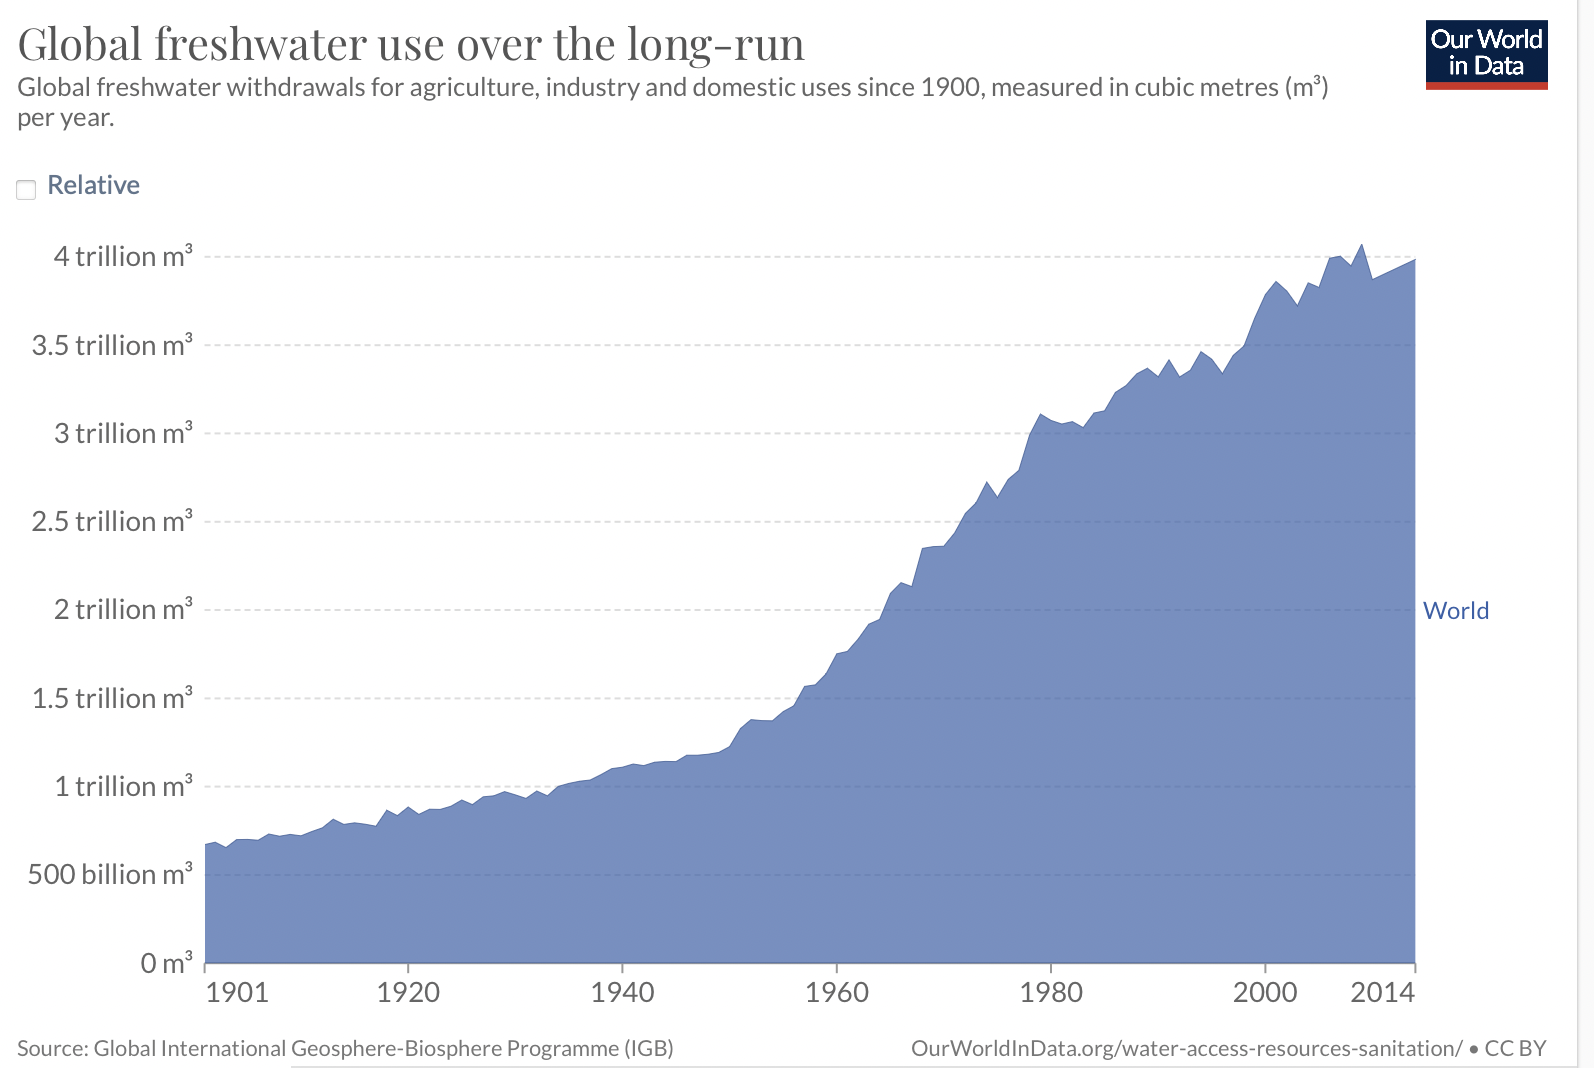
Graph depicting global freshwater use from 1900 to 2014
Water use in MEDCs
- 11% Domestic
- 30% Agriculture
- 59% Industry
Water demand in MEDCs
-
The water demand in MEDCs is higher than in LEDCs for the following reasons:
- Improving **living standards—**people have more appliances/sanitation that use water
- Increased use of water in** leisure and tourism—**water parks, golf courses
- Increased** urbanisation**
- Increasing **industry—**water is needed for the production of goods and energy production
- Increasing use in** agriculture—** more water is needed for livestock
-
The largest use of water in MEDCs tends to be industry
Water use in LEDCs
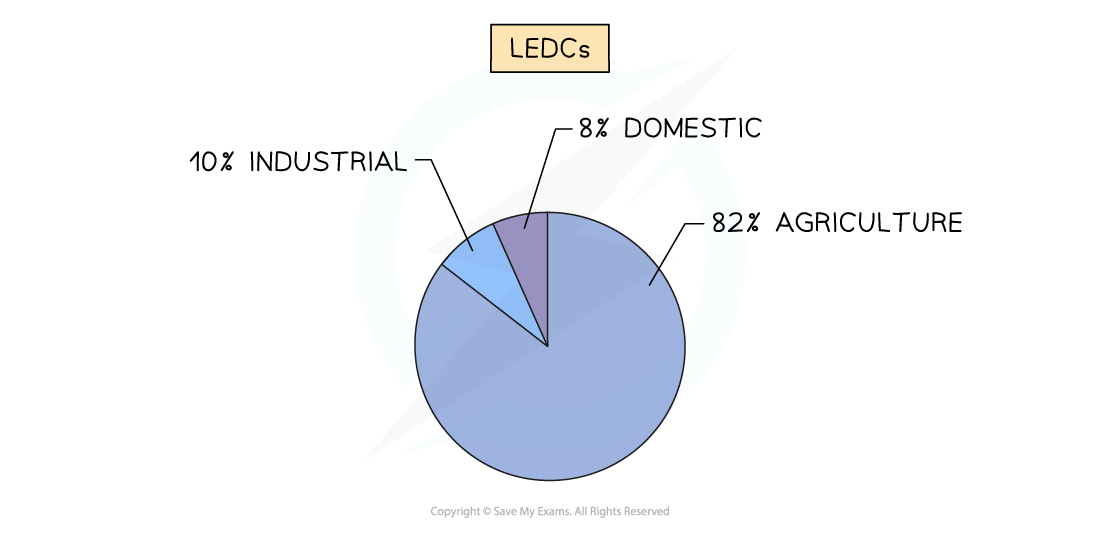
Water use in LEDCs
Water demand in LEDCs
- Unlike MEDCs, water use in LEDCs is mostly used for agriculture
- Many people are still dependent on agriculture
- There is far less industry in many LEDCs so the demand for water for industrial processes is low
- Many people in LEDCs do not have access to piped water and, as a result, are more cautious with water use
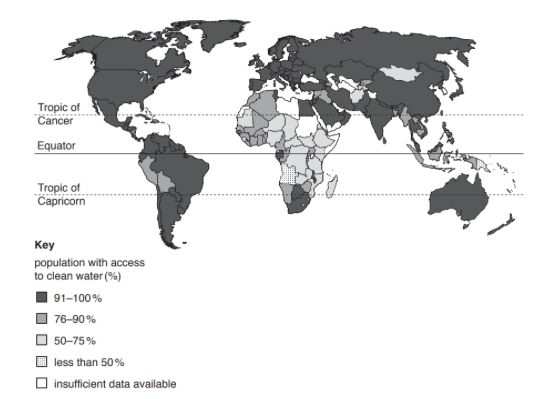
Worked Example Study Fig 1, which is a map showing information about the percentage of the population in each country with access to clean drinking water.
Fig 1
Describe the distribution of countries where 75% or less of the population have access to clean drinking water.
[3 marks]
Final answer: **Answer **
- Mainly/most in Africa** [1]**
- Except Egypt and South Africa/except in North and South [1]
- A few/some in Asia [1]
- Near/on the equator, mainly in the tropics, between the Tropics of Cancer and Capricorn, Central Africa, and sub-Saharan Africa [1]
- Uneven/clustered [1]
Exam Hint When describing the distribution from a map, ask yourself the following questions:
- What is the general pattern?
- Does the pattern relate to anything else for example, the location of LEDCs and MEDCs?
- Are they near the equator or further away?
- Is the pattern uneven or clustered?
Use map features to help with your description: place names (countries and continents), compass rose, latitude and longitude, the equator and the tropics.
Was this revision note helpful?
Build on this topic