Study Fig. 6.1, which shows information about precipitation and evaporation in Los Gatos, an area in California, USA (an MEDC).
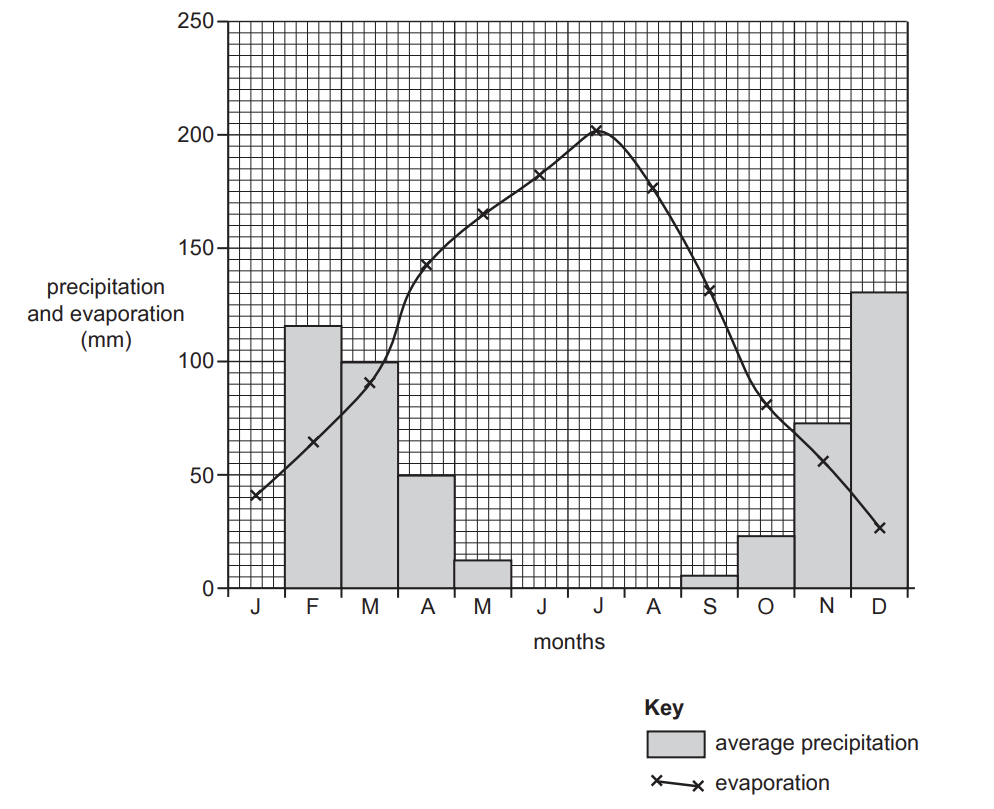
Fig. 6.1
(i)
Complete Fig. 6.1 by plotting the following:
The average precipitation in January is 130mm.
(1 mark)
(ii)
Using Fig. 6.1 only, name:
– a month when irrigation will be needed ....................................
– a month when soils may be waterlogged. ....................................
(2 marks)
(iii)
Using Fig. 6.1 only, describe how the relationship between average precipitation and evaporation varies during the year. Use statistics to support your answer.
(3 marks)