Proton (1H) NMR Spectroscopy (Cambridge International A-Level Chemistry)
Interpreting & Explaining Proton (1H) NMR Spectra
-
Nuclear Magnetic Resonance (NMR) spectroscopy is used for analysing organic compounds
-
Atoms with odd mass numbers usually show signals on NMR
-
In 1H NMR, the magnetic field strengths of protons in organic compounds are measured and recorded on a spectrum
-
Protons on different parts of a molecule (in different molecular environments) emit different frequencies when an external magnetic field is applied
-
All samples are measured against a reference compound – Tetramethylsilane (TMS)
- TMS shows a single sharp peak on NMR spectra, at a value of zero
- Sample peaks are then plotted as a ‘shift’ away from this reference peak
- This gives rise to ‘chemical shift’ values for protons on the sample compound
- Chemical shifts are measured in parts per million (ppm)
Features of an NMR spectrum
-
NMR spectra show the intensity of each peak against its chemical shift
-
The area under each peak gives information about the number of protons in a particular environment
-
The height of each peak shows the intensity/absorption from protons
-
A single sharp peak is seen to the far right of the spectrum
- This is the reference peak from TMS
- Usually at chemical shift 0 ppm
Low resolution 1H NMR for ethanol
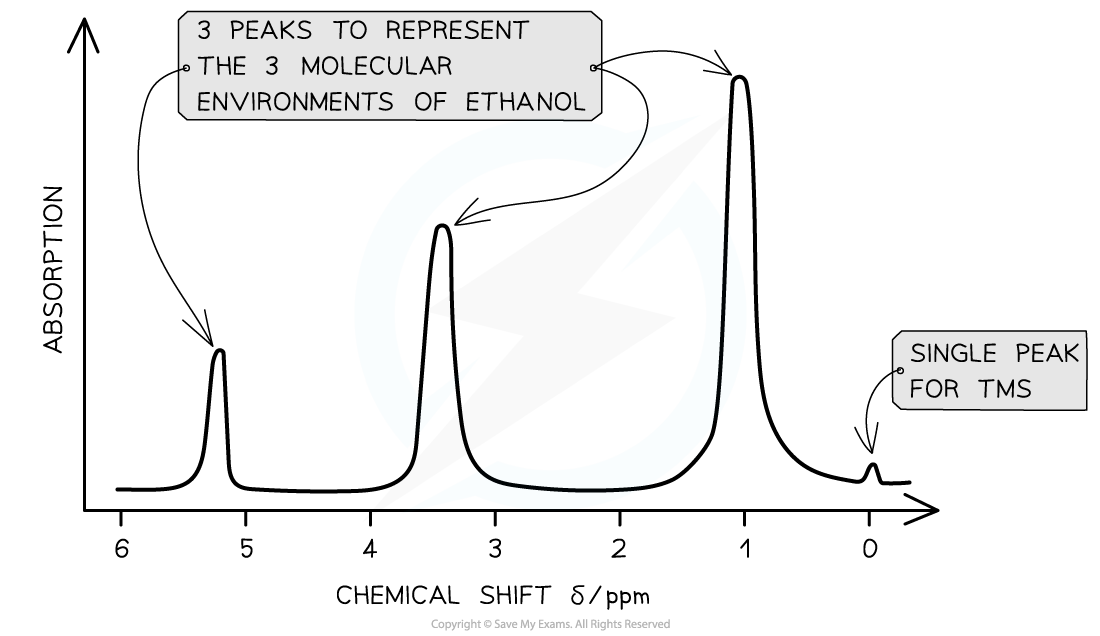
The key features of this spectrum are the number and position of the peaks
Molecular environments
-
Hydrogen atoms of an organic compound are said to reside in different molecular environments
- E.g. Methanol has the molecular formula CH3OH
- There are 2 molecular environments: -CH3 and -OH
-
The hydrogen atoms in these environments will appear at 2 different chemical shifts
-
Different types of protons are given their own range of chemical shifts
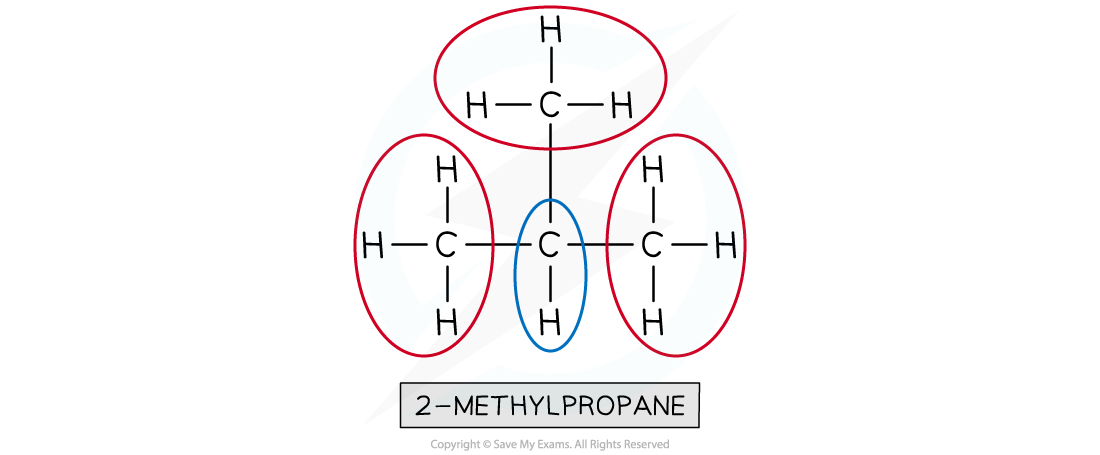
Worked Example How many different 1H chemical environments occur in 2-methylpropane?
Answer:
Two different 1H chemical environments occur in 2-methylpropane
The three methyl groups are in the same 1H environment
- The lone hydrogen is in its own 1H environment
Chemical shift values for 1H molecular environments table
| Environment of proton | Example | Chemical shift range, δ / ppm |
|---|---|---|
| alkane | –CH3, –CH2–, >CH– | 0.9 - 1.7 |
| alkyl next to C=O | CH3–C=O, –CH2–C=O, >CH–C=O | 2.2 - 3.0 |
| alkyl next to aromatic ring | CH3–Ar, –CH2–Ar, >CH2–Ar | 2.3 - 3.0 |
| alkyl next to electronegative atom | CH3–O, CH2–O, CH2–Cl | 3.2 - 4.0 |
| attached to alkene | =CHR | 4.5 - 6.0 |
| attached to aromatic ring | H–Ar | 6.0 - 9.0 |
| aldehyde | HCOR | 9.3 - 10.5 |
| alcohol* | ROH | 0.5 - 6.0 |
| phenol* | Ar–OH | 4.5 - 7.0 |
| carboxylic acid | RCOOH | 9.0 - 13.0 |
| alkyl amine* | R–NH– | 1.0 - 5.0 |
| aryl amine* | Ar–NH2 | 3.0 - 6.0 |
| amide | RCONHR | 5.0 - 12.0 |
- δ values for O–H protons and N–H protons vary depending on the solvent and concentration
-
Protons in the same chemical environment are chemically equivalent
- 1,2-dichloroethane, Cl-CH2-CH2-Cl has one chemical environment as these four hydrogens are all exactly equivalent
-
Each individual peak on a 1H NMR spectrum relates to protons in the same environment
- Therefore, 1,2-dichloroethane would produce one single peak on the NMR spectrum as the protons are in the same environment
Identifying molecular environments in 1,2-dichloroethane

All four protons in the 1,2-dichloroethane molecule are equivalent
Low resolution 1H NMR
-
Peaks on a low resolution NMR spectrum refer to molecular environments of an organic compound
- E.g. Ethanol has the molecular formula CH3CH2OH
- This molecule as 3 separate environments: -CH3, -CH2, -OH
- So 3 peaks would be seen on its spectrum at 1.2 ppm (-CH3), 3.7 ppm (-CH2) and 5.4 ppm (-OH)
Low resolution NMR spectrum of ethanol
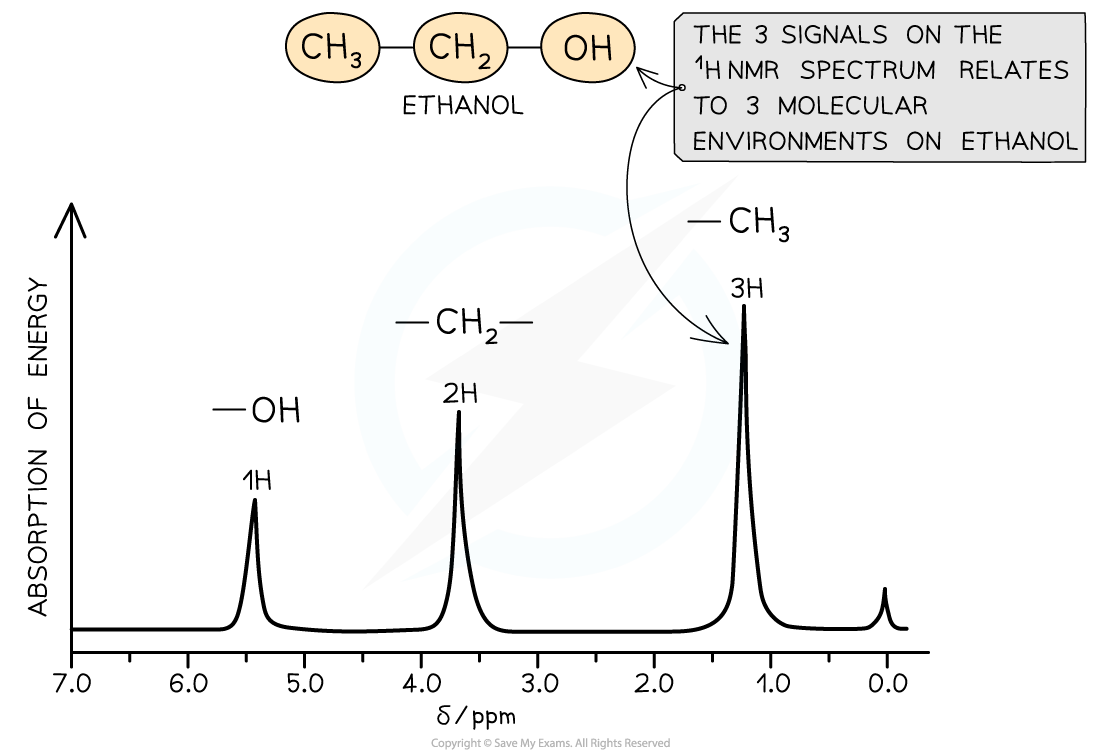
The low resolution NMR spectrum of ethanol shows 3 peaks for the 3 molecular environments
High resolution 1H NMR
- More structural details can be deduced using high resolution NMR
- The peaks observed on a high resolution NMR may sometimes have smaller peaks clustered together
- The splitting pattern of each peak is determined by the number of protons on neighbouring environments
The number of peaks a signal splits into = n + 1
- (Where n = the number of protons on the adjacent carbon atom)
Predicting Shifts & Splitting Patterns
Spin-Spin Splitting
-
A high resolution 1H NMR spectrum can show you the structure of the molecule but also the peaks can be split into sub-peaks or splitting patterns
-
These are caused by a proton's spin interacting with the spin states of nearby protons that are in different environments
- This can provide information about the number of protons bonded to adjacent carbon atoms
- The splitting of a main peak into sub-peaks is called spin-spin splitting or spin-spin coupling
High resolution 1H NMR spectrum of ethanol
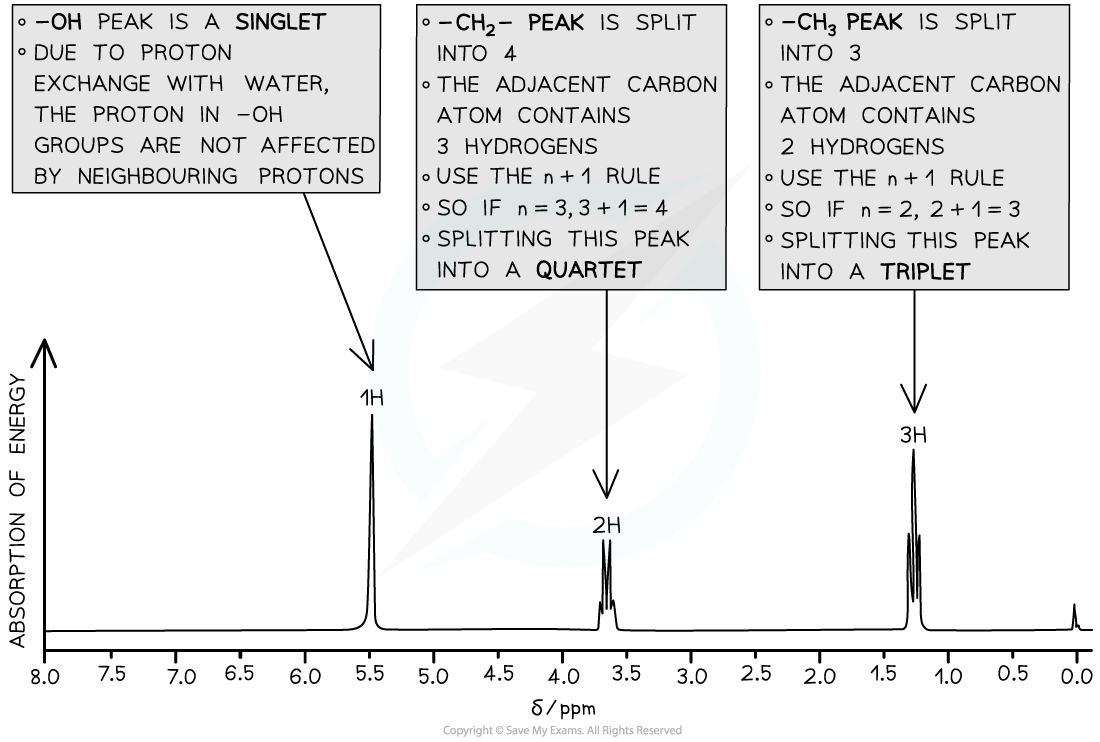
The high resolution1H NMR spectrum of ethanol showing the splitting patterns of each of the 3 peaks. Using the n+1, it is possible to interpret the splitting pattern
Exam Hint
It is very rare that the spin-spin splitting of equivalent protons is covered in teaching because it is so rarely asked in exams
Equivalent protons do not cause spin-spin splitting
The simplest example of this is benzene
- In benzene, all of the protons are equivalent
- This means that they are seen as one singlet in the high resolution 1H NMR spectrum of benzene
The n+1 rule
-
The number of sub-peaks is one greater than the number of adjacent protons causing the splitting
- For a proton with n protons attached to an adjacent carbon atom, the number of sub-peaks in a splitting pattern = n+1
-
When analysing spin-spin splitting, it shows you the number of hydrogen atoms on the adjacent carbon atom
-
These are the splitting patterns that you need to be able to recognise from a 1H spectra:
1H NMR peak splitting patterns table
| Number of adjacent protons (n) | Splitting pattern using the n+1 rule the peak will split into .... | Relative intensities in splitting pattern | Shape |
|---|---|---|---|
| 0 | 1, singlet | 1 | 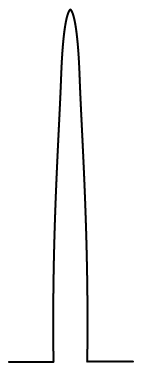 |
| 1 | 2, doublet | 1 : 1 | 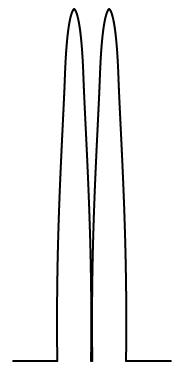 |
| 2 | 3, triplet | 1 : 2 : 1 | 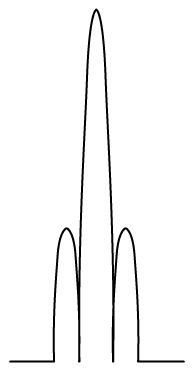 |
| 3 | 4, quartet | 1 : 3 : 3 : 1 | 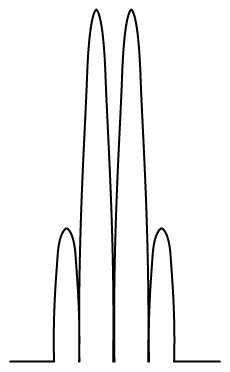 |
-
Splitting patterns must occur in pairs because each proton splits the signal of the other
-
There are some common splitting pairs you will see in a spectrum however you don't need to learn these but can be worked out using the n+1 rule
- You will quickly come to recognise the triplet / quartet combination for a CH3CH2 because it is so common
Common pair of splitting patterns
- A quartet and a triplet in the same spectrum usually indicate an ethyl group, CH3CH2-
- The signal from the CH3 protons is split as a triplet by having two neighbours
- The signal from the CH2 protons is split as a quartet by having three neighbours
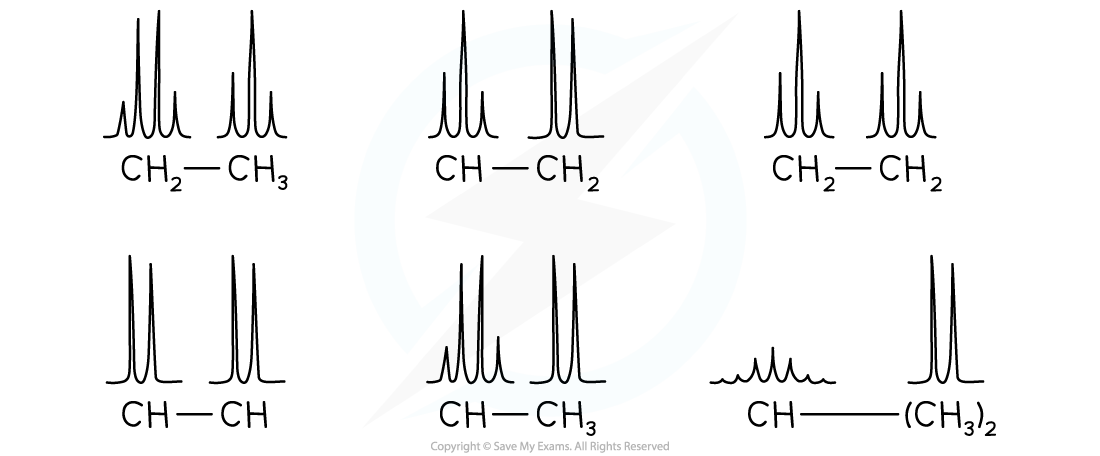
- Here are some more common pairs of splitting patterns
Common pairs of splitting patterns
1H NMR spectrum of propane
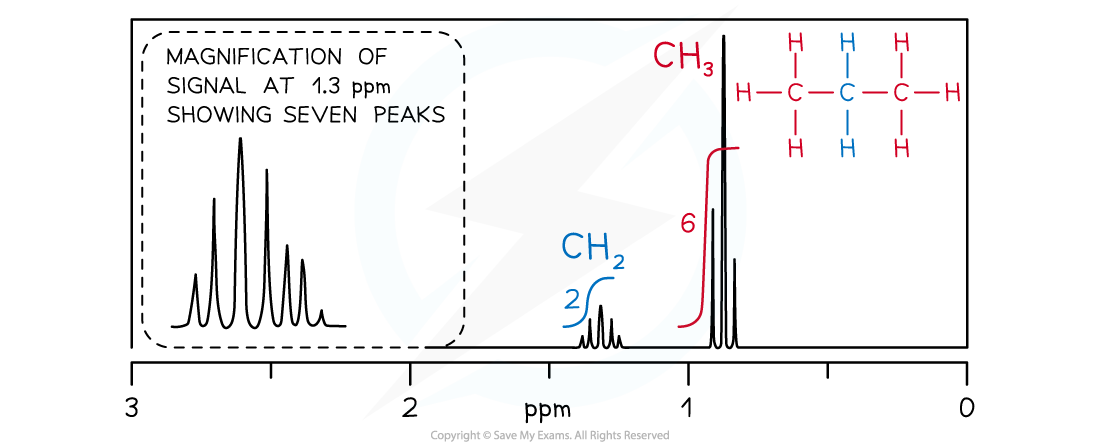
- The CH2 signal in propane (blue) is observed as a heptet because it has six neighbouring equivalent H atoms (n+1 rule), three on either side in two equivalent CH3 groups
- The CH3 groups (red) produce identical triplets by coupling with the CH2 group
Worked Example For the compound (CH3)2CHOH, predict the following:
- The number of peaks
- The type of proton and chemical shift
- The relative peak areas
- The splitting pattern
Answers:
The number of peaks
- 3 peaks
The type of proton and chemical shift
- (CH3)2CHOH at 0.9 - 1.7 ppm
- (CH3)2CHOH at 3.2 - 4.0 ppm
- (CH3)2CHO**H **at 0.5 - 6.0 ppm
The relative peak areas
- Ratio 6 : 1 : 1
The splitting pattern
- (CH3)2CHOH split into a doublet (1+1=2)
- (CH3)2CHOH split into a heptet (6+1=7)
Was this revision note helpful?
Build on this topic