Wage Determination (Edexcel IGCSE Economics)
Diagrammatic Analysis of the Labour Market
Spec point —
1.2.5e
-
Labour market equilibrium occurs when the demand for labour (DL) is equal to the supply of labour (SL)
- The DL is the demand by firms for workers
- The SL is the supply of labour by workers
-
Individual firms are price takers in the labour market as they have to accept the wage rate that workers are being paid in the industry
- If they offer a lower wage, they will likely struggle to recruit workers
- If they offer a higher wage, there will be an excess supply of workers applying to work there
In the labour market for graphic designers, the equilibrium wage rate is W and the equilibrium quantity is Q. At this point the DL = SL
Diagram analysis
- The market for graphic designers is in equilibrium, where DL = SL
- The equilibrium wage is W and the quantity of labour is Q
- There is **no excess supply of labour
- There is no excess demand** for labour
The Effect of a Rise in Demand for Labour
Spec point —
1.2.5e
The Effect of a Rise in the Demand for Labour
- A rise in the demand for labour will shift the demand curve for labour to the right
- This causes an increase in the equilibrium wage rate and the quantity of labour employed
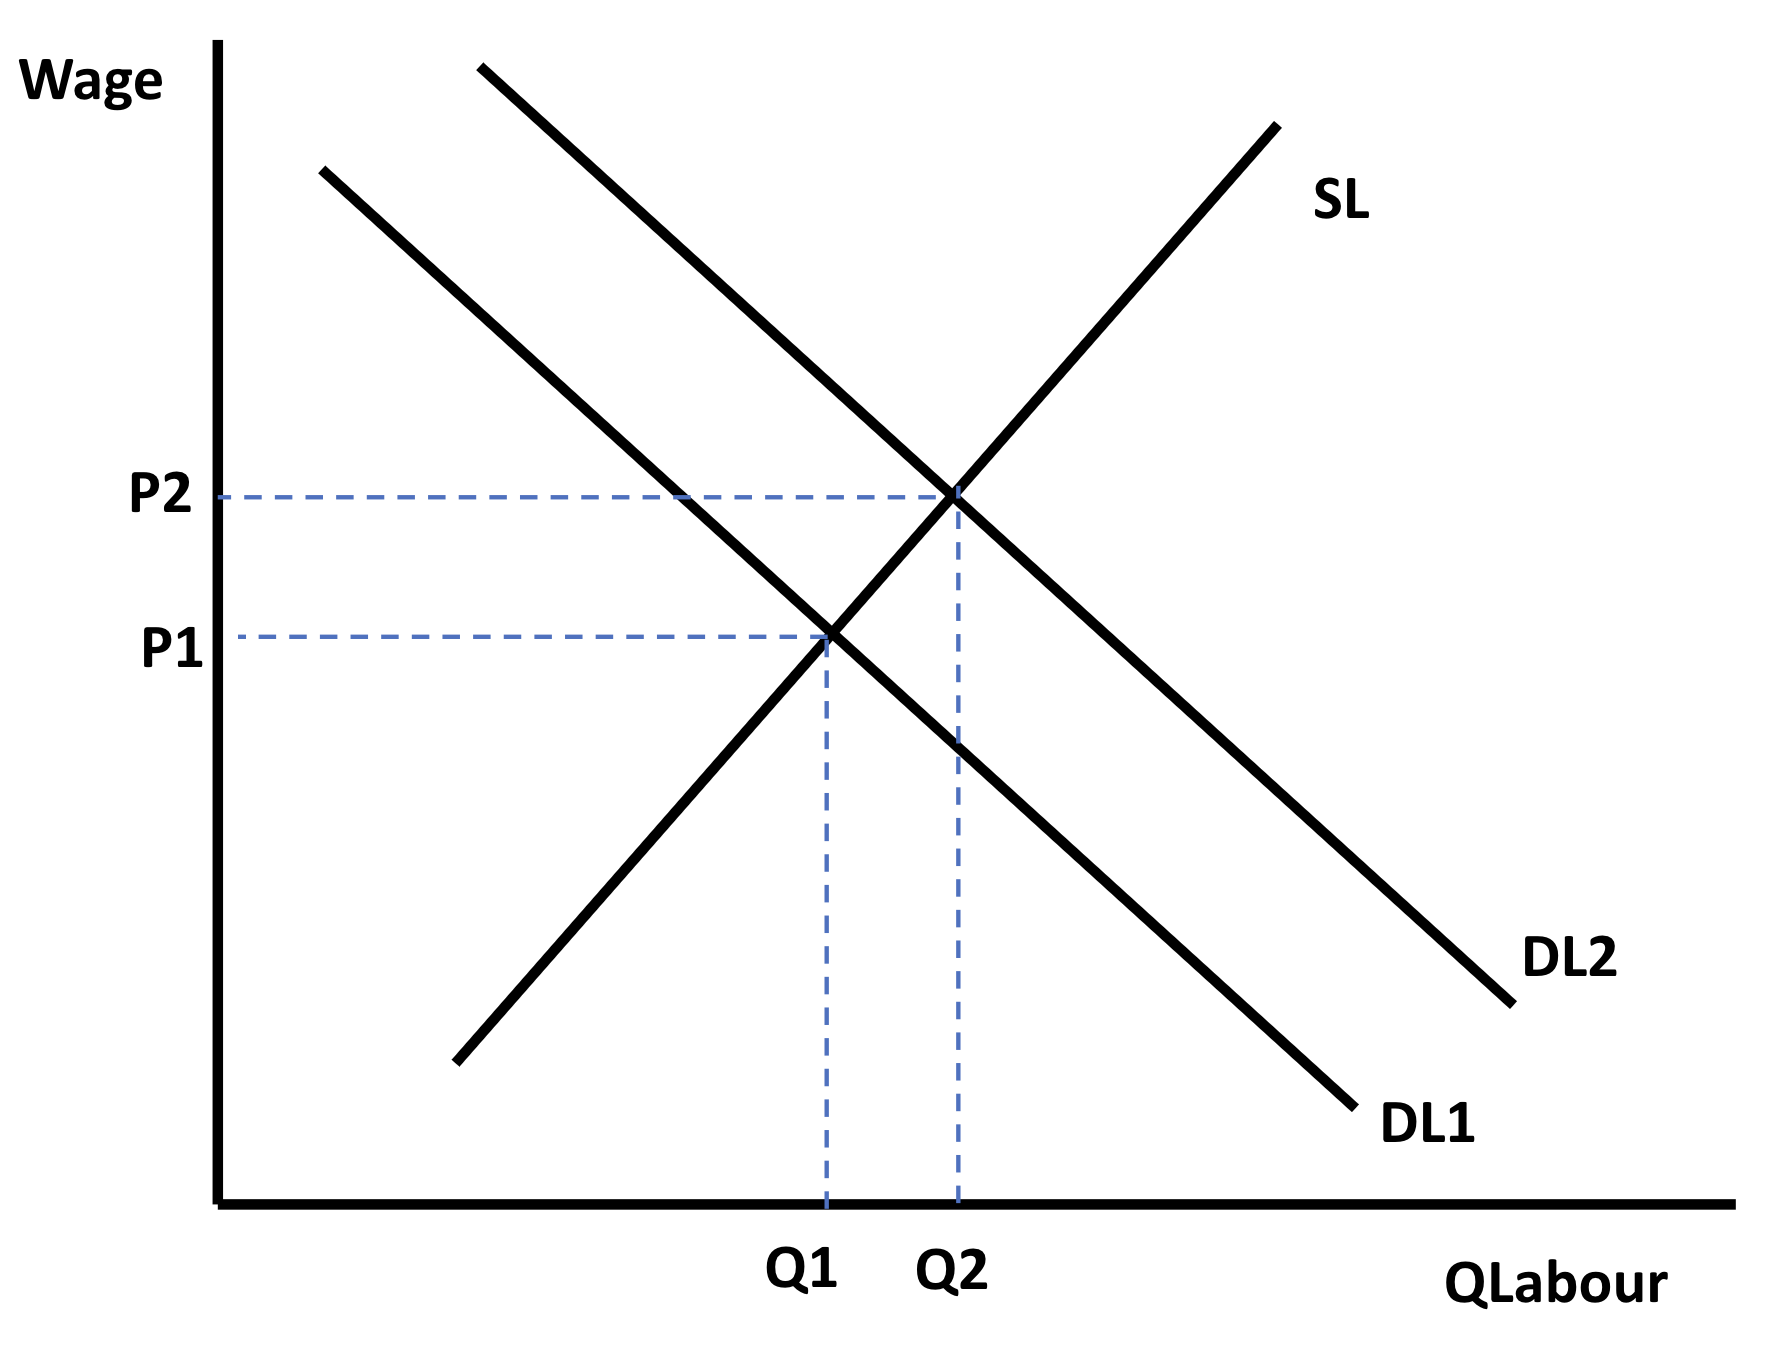
A rise in the demand for labour increases the price of labour
Diagram analysis
-
A rise in the demand for websites will cause a rise in the demand for graphic designers (derived demand)
-
The demand curve for labour will shift right from DL1to DL2
- There is a rise in the equilibrium wage rate to P2
- There is a rise in the equilibrium quantity of labour employed to Q2
The Effect of a Fall in Supply of Labour
Spec point —
1.2.5e
The Effect of a Fall in the Supply of Labour
- A fall in the supply of labour will shift the supply curve of labour to the left
- This causes an increase in the equilibrium wage rate and a fall in quantity of labour employed
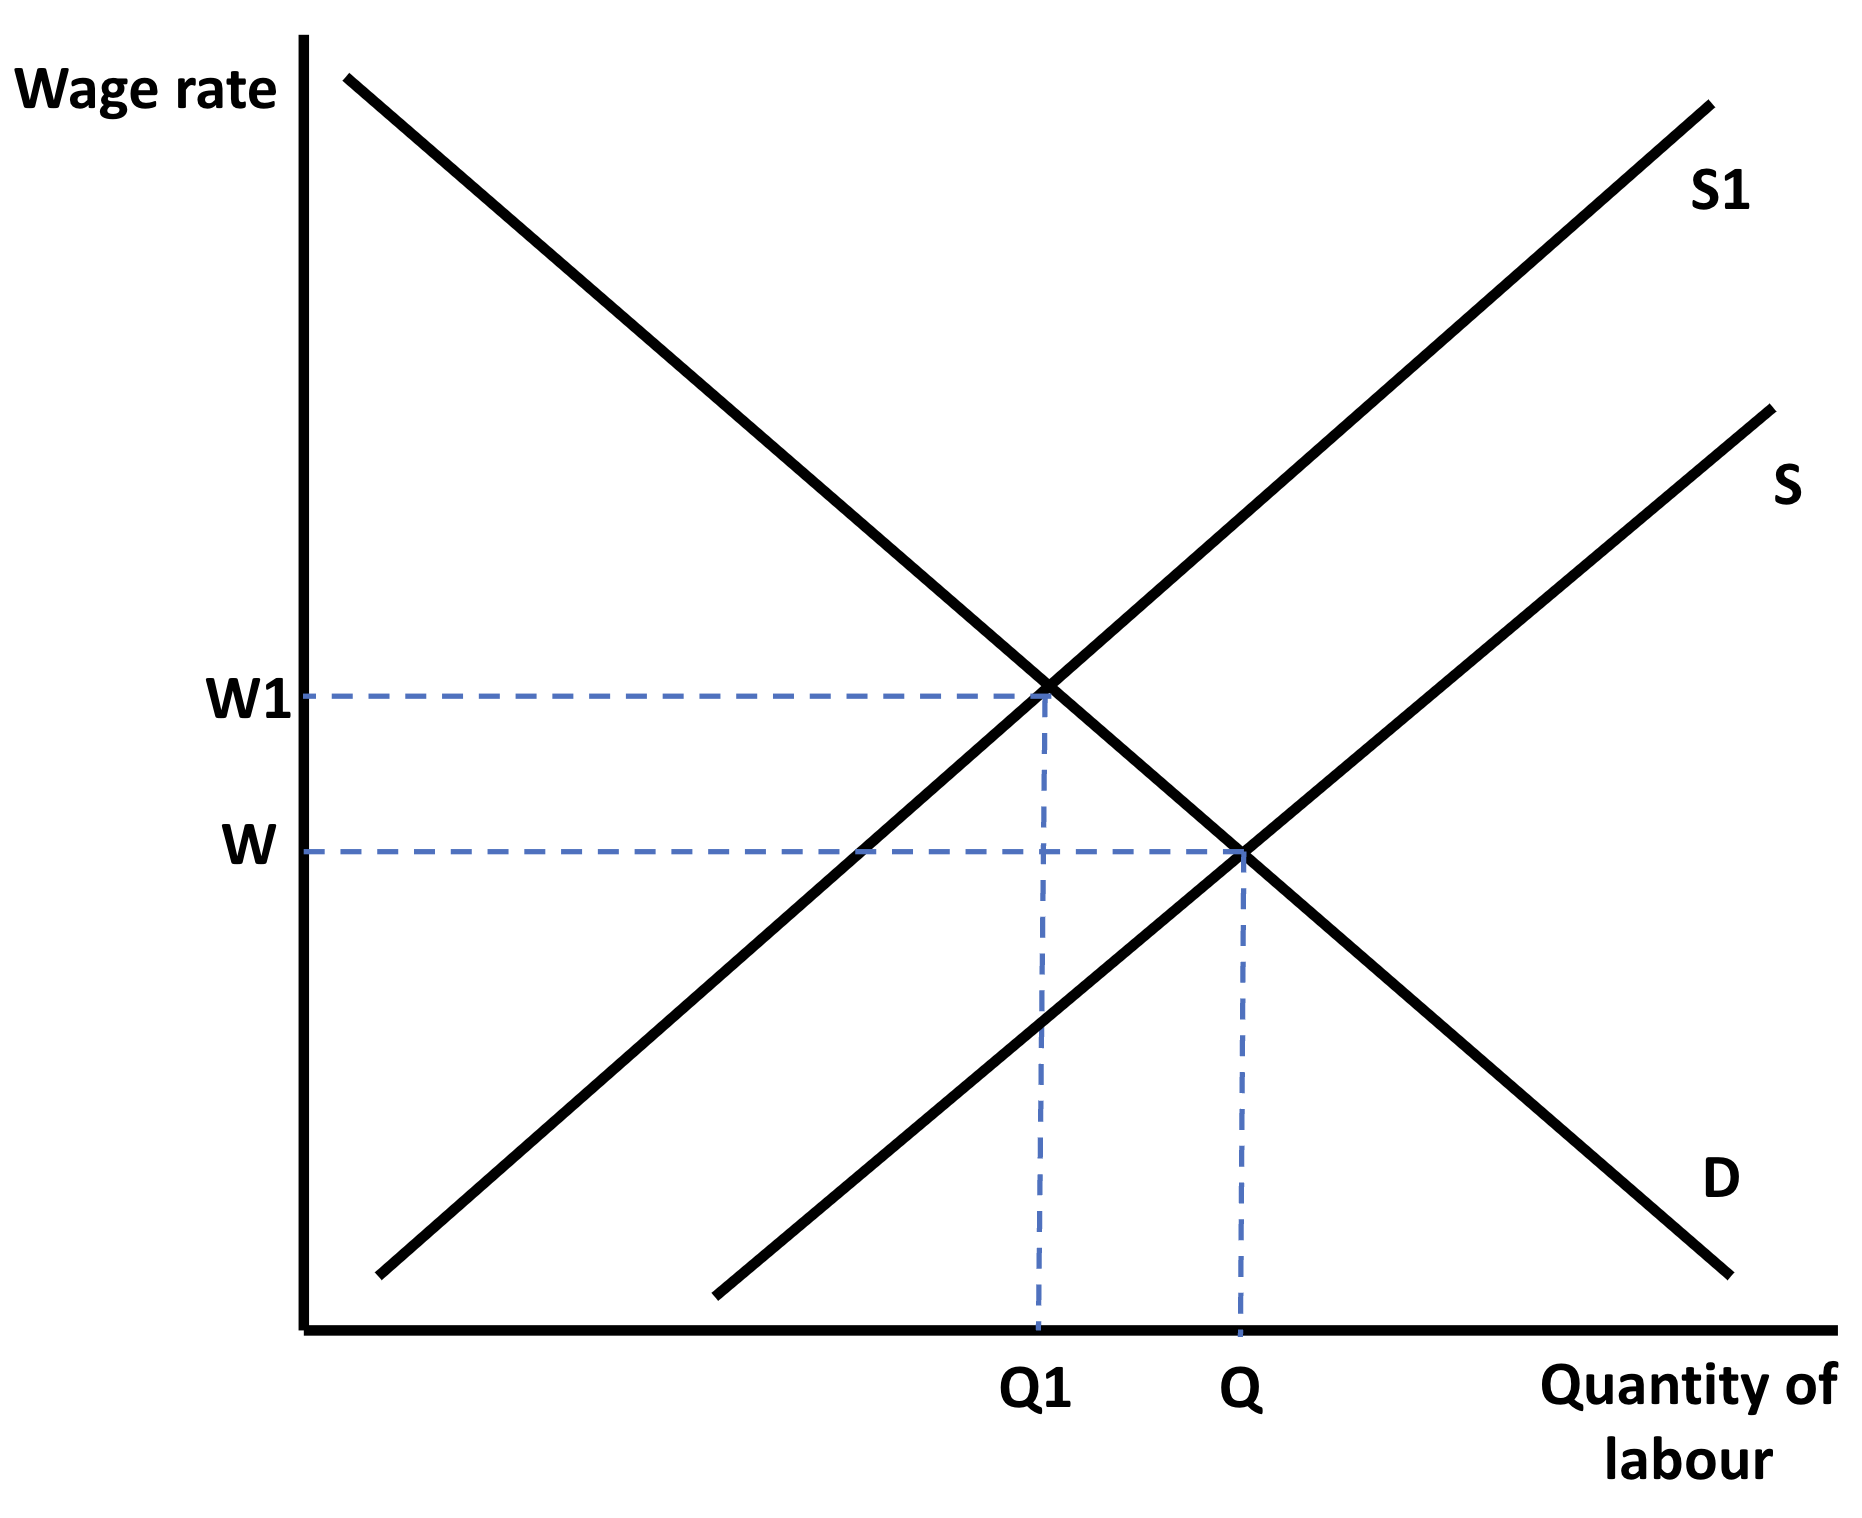
A fall in the supply of graphic designers will cause the wage to rise to W2 and the quantity of graphic designers employed to fall to Q2
Diagram analysis
-
A fall in the supply of graphic designers as they switch to different jobs will impact the labour in the graphic design industry
-
The supply curve of labour will shift left
- There is a rise in the equilibrium wage rate to W1
- There is a fall in the equilibrium quantity of graphic designers employed from Q to Q1
Was this revision note helpful?
Build on this topic