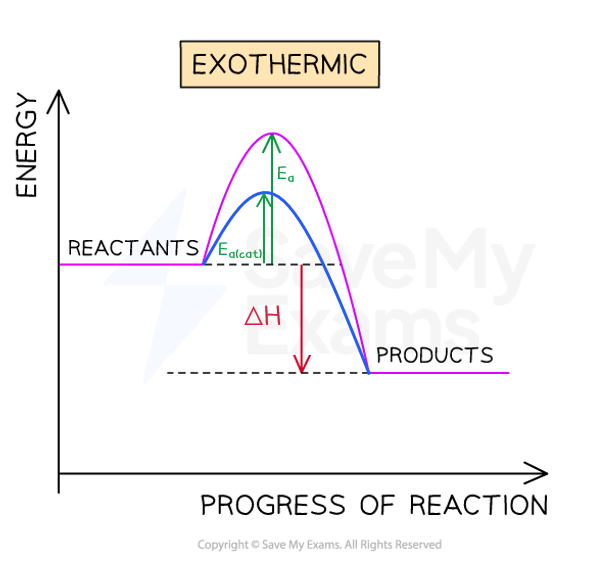
Activation Energy
2 guided lessons · 18 checks · 3. Physical Chemistry → Rates of Reaction
Guided lessons for this note
Which concept don't you understand yet?
We'll explain it simply and check your understanding. Pick any lesson — any order works.
0 of 18 checks correct so far
Lesson 1 of 2
Reading reaction profiles
A reaction profile is the energy level diagram grown a curve: it follows the energy as bonds strain, peak and settle. This lesson names the two features examiners want labelled, the enthalpy arrow and the energy hurdle.
What you know already
From Catalysts you already know that helpers open lower-energy routes through a reaction. This note draws those routes as reaction profiles, adding the peak that particles must clear before any product forms. Reading that peak, and the arrow for the overall change, is the skill this note builds.
Key points of understanding
- Reaction profiles show the relative energies of reactants and products and how energy changes as the reaction progresses.
- The height difference between reactants and products represents the overall enthalpy change.
- For an exothermic reaction the enthalpy value is negative and the arrow points downwards.
- For an endothermic reaction the enthalpy value is positive and the arrow points upwards.
- The climb from reactants up to the peak of the curve marks the energy needed to start reacting.
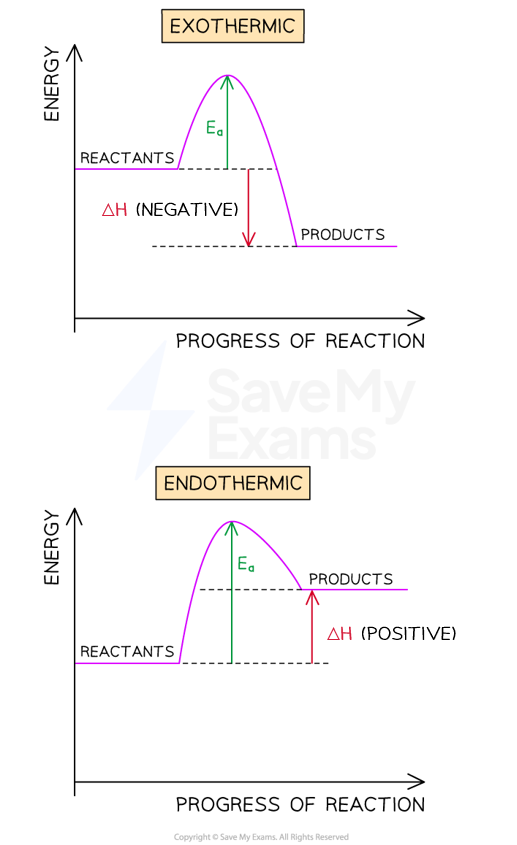
Reaction profiles show enthalpy change and activation energy for the reaction
Choose a confidence level to continue.
Prefer to read it all at once? Show the full lesson as a page
1.Reading reaction profiles
A reaction profile is the energy level diagram grown a curve: it follows the energy as bonds strain, peak and settle. This lesson names the two features examiners want labelled, the enthalpy arrow and the energy hurdle.
Reaction profiles show enthalpy change and activation energy for the reaction
Key points
- Reaction profiles show the relative energies of reactants and products and how energy changes as the reaction progresses.
- The height difference between reactants and products represents the overall enthalpy change.
- For an exothermic reaction the enthalpy value is negative and the arrow points downwards.
Guided content from the SME authoring corpus — note rn_y85XYRv5QfgZFQxv, pinned at 51a6ed34e715 · promoted SyllabAI/syllabai-resources e967e75f1339