Measuring Rates
3 guided lessons · 27 checks · 3. Physical Chemistry → Rates of Reaction
Guided lessons for this note
Which concept don't you understand yet?
We'll explain it simply and check your understanding. Pick any lesson — any order works.
0 of 27 checks correct so far
Lesson 1 of 3
Experiments on surface area and concentration
Two experiments anchor the surface area and concentration stories: marble chips fizzing in acid, and a cloudy cross disappearing under thiosulfate. This lesson walks both methods and the measurements each one collects.
What you know already
From Energetics you already know how to follow a reaction with a thermometer. This note follows it with a stopwatch instead, describing the experiments that test how surface area, concentration, temperature and catalysts change the pace of a reaction. It closes by reading the same story off rate graphs.
Key points of understanding
- The surface area experiment adds marble chips to dilute hydrochloric acid and collects the gas produced.
- A delivery tube feeds the gas into an inverted measuring cylinder in a water trough.
- Gas volume over a fixed time is measured, then the run repeats with different chip sizes.
- The concentration experiment watches a cross under the flask disappear as the mixture clouds.
- Sodium thiosulfate is diluted with water to give different concentrations for each repeat.
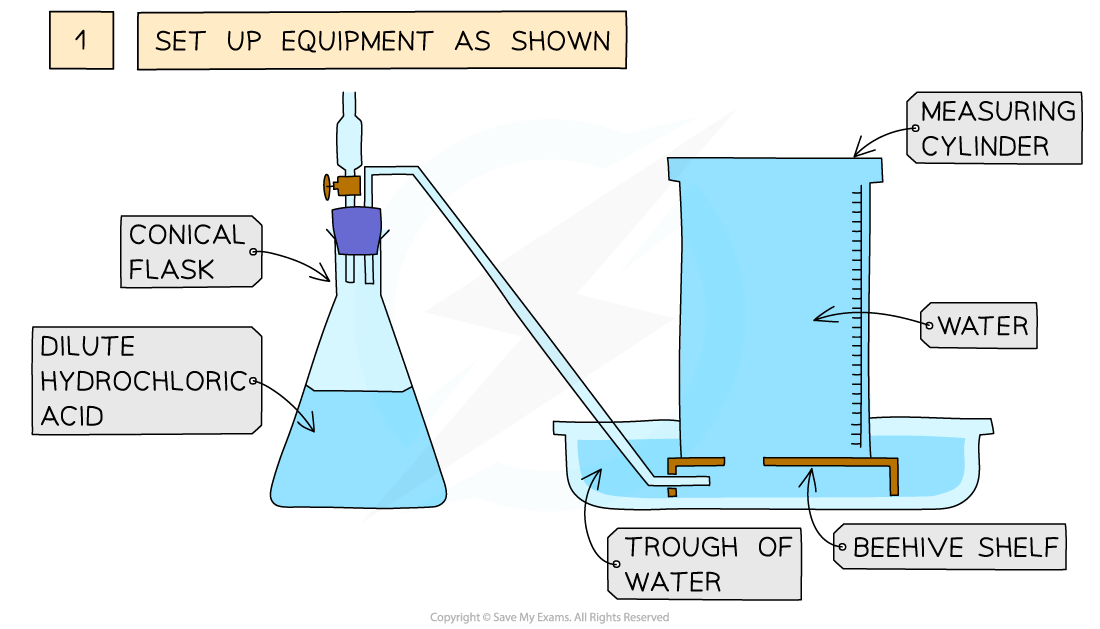
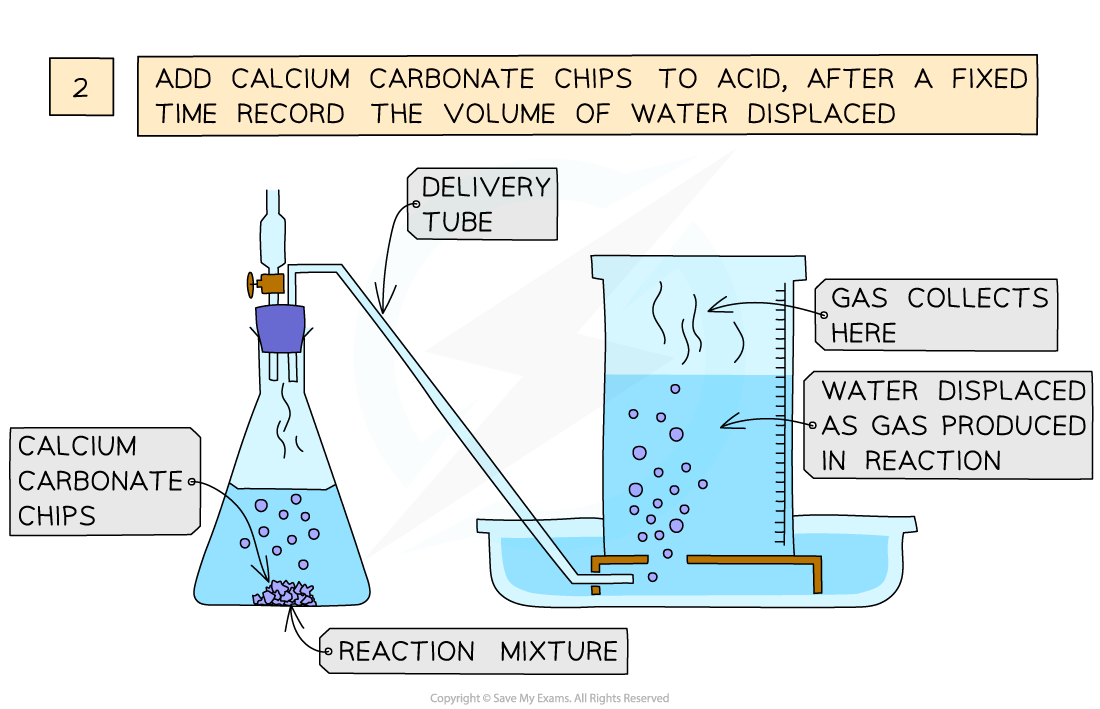
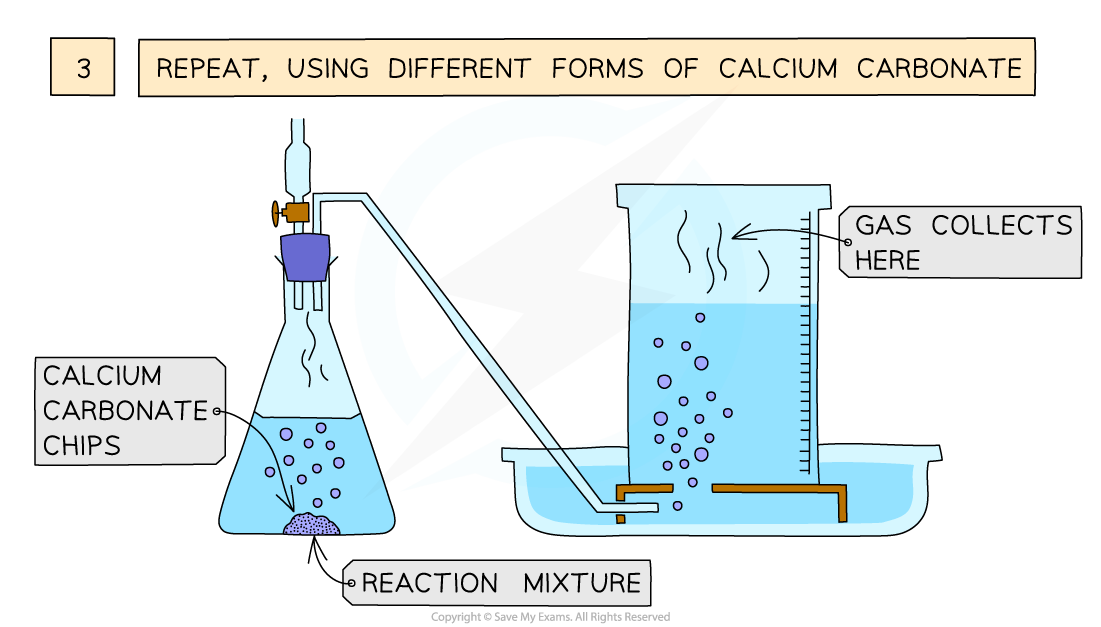
The process of downwards displacement to investigate the effect of the surface area of a solid on the rate of reaction
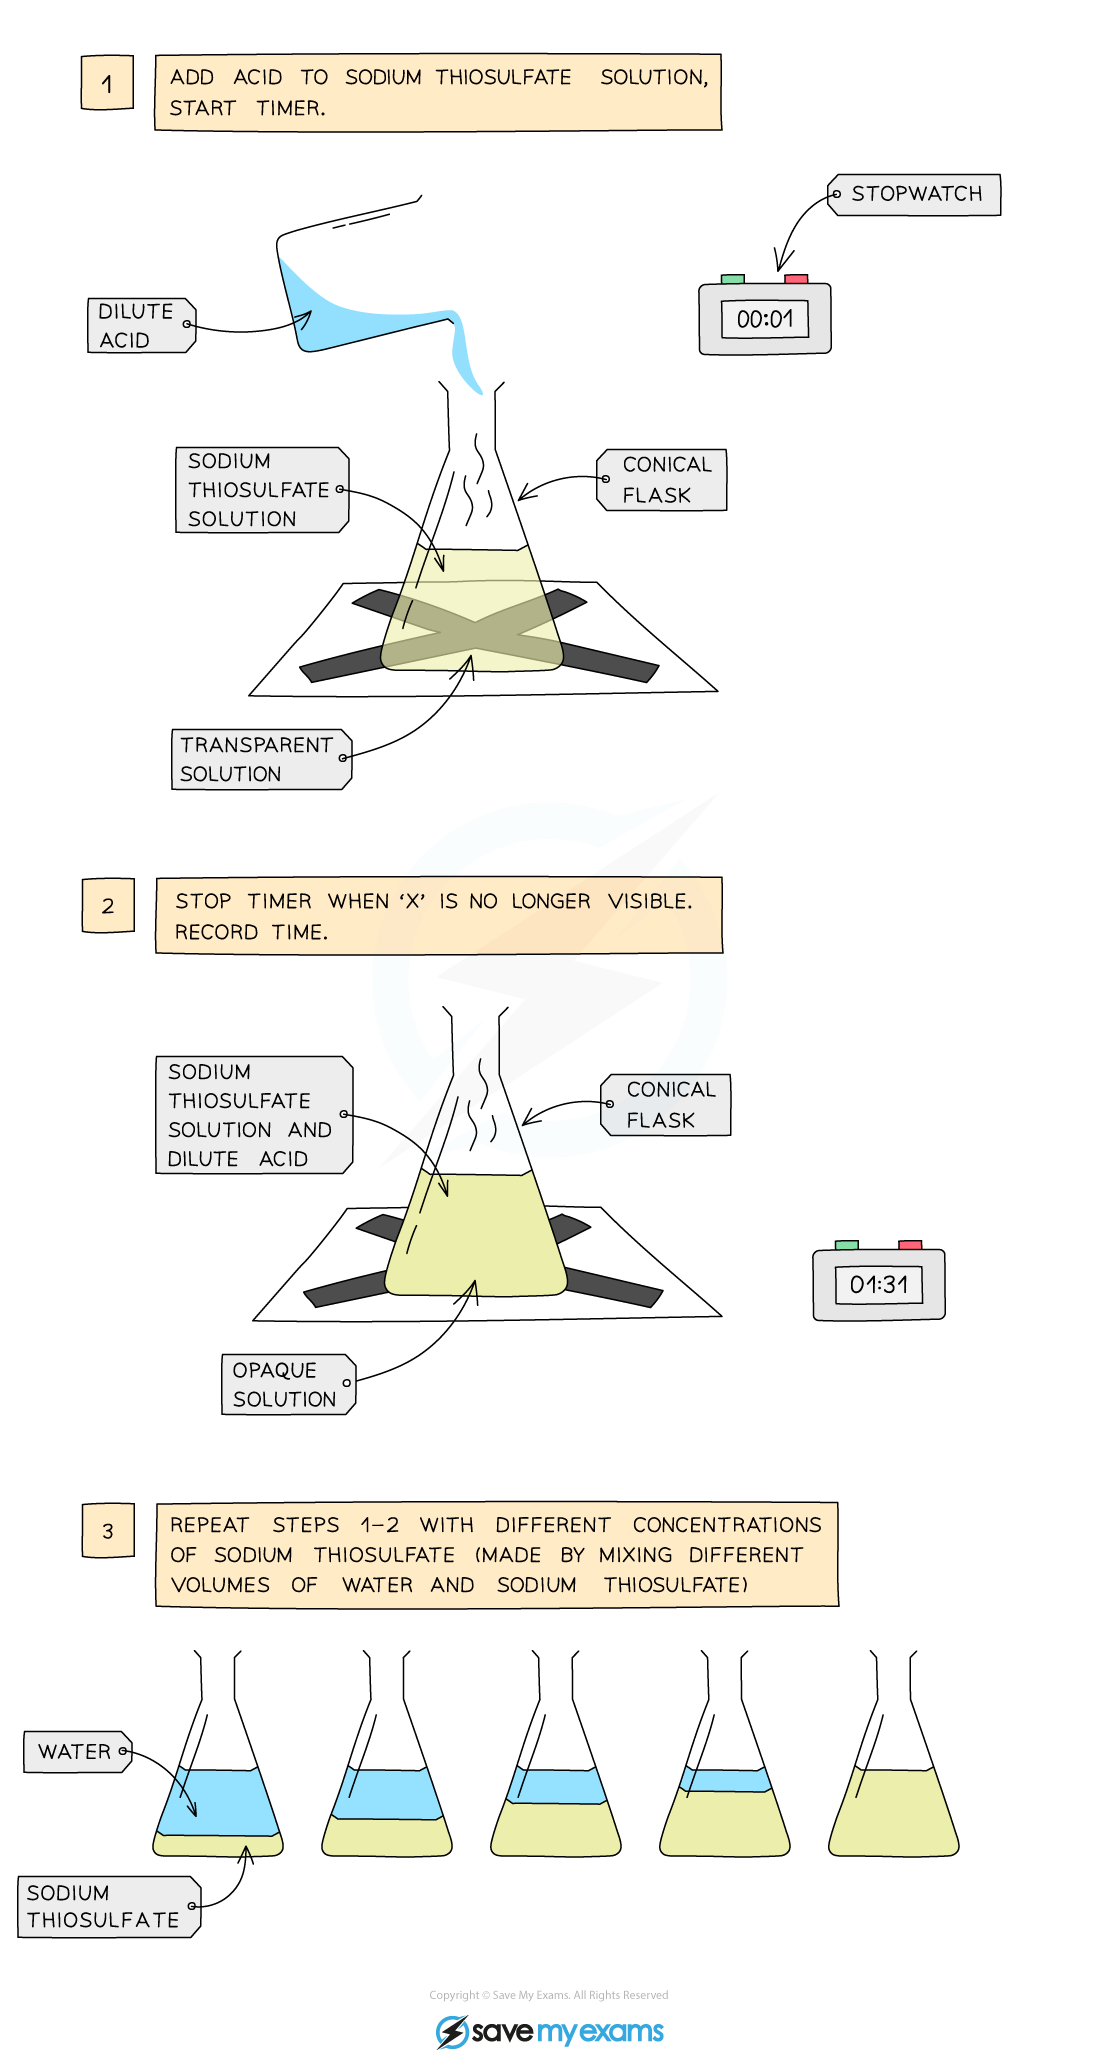
The apparatus needed to investigate the effect of concentration on the rate of reaction
Choose a confidence level to continue.
Prefer to read it all at once? Show the full lesson as a page
1.Experiments on surface area and concentration
Two experiments anchor the surface area and concentration stories: marble chips fizzing in acid, and a cloudy cross disappearing under thiosulfate. This lesson walks both methods and the measurements each one collects.
The process of downwards displacement to investigate the effect of the surface area of a solid on the rate of reaction
The apparatus needed to investigate the effect of concentration on the rate of reaction
Key points
- The surface area experiment adds marble chips to dilute hydrochloric acid and collects the gas produced.
- A delivery tube feeds the gas into an inverted measuring cylinder in a water trough.
- Gas volume over a fixed time is measured, then the run repeats with different chip sizes.
- The concentration experiment watches a cross under the flask disappear as the mixture clouds.
- Sodium thiosulfate is diluted with water to give different concentrations for each repeat.
First pass
Bigger chips or stronger acid should change how fast gas bubbles appear or how quickly a cross vanishes under cloudy liquid. Each experiment changes one factor, times the result and repeats with a new size or strength.
Analogy — It is like timing how fast sugar vanishes in stirred tea: one lump versus crushed sugar, or weak tea versus strong.
Exam pointer — Name the measured quantity, gas volume or disappearance time, and the factor varied in each method.
Going deeper
For surface area, marble chips react with dilute hydrochloric acid and the gas collected in a fixed time is compared across chip sizes. For concentration, sodium thiosulfate of different strengths reacts with acid while a stopwatch times how long a marked cross stays visible through the clouding mixture.
Analogy — The first is a race of bubbling, the second a race of fading; both stop the clock the moment a fixed landmark is reached.
Exam pointer — Describe apparatus and timing for both methods, and state how the factor is varied between repeats.
Checks
0 of 9 attempted · 0 correct
2.Experiments on temperature and catalysts
Two more experiments complete the set: magnesium in warmed acid, and hydrogen peroxide breaking down with and without a black powder. This lesson times both and explains what each comparison proves.
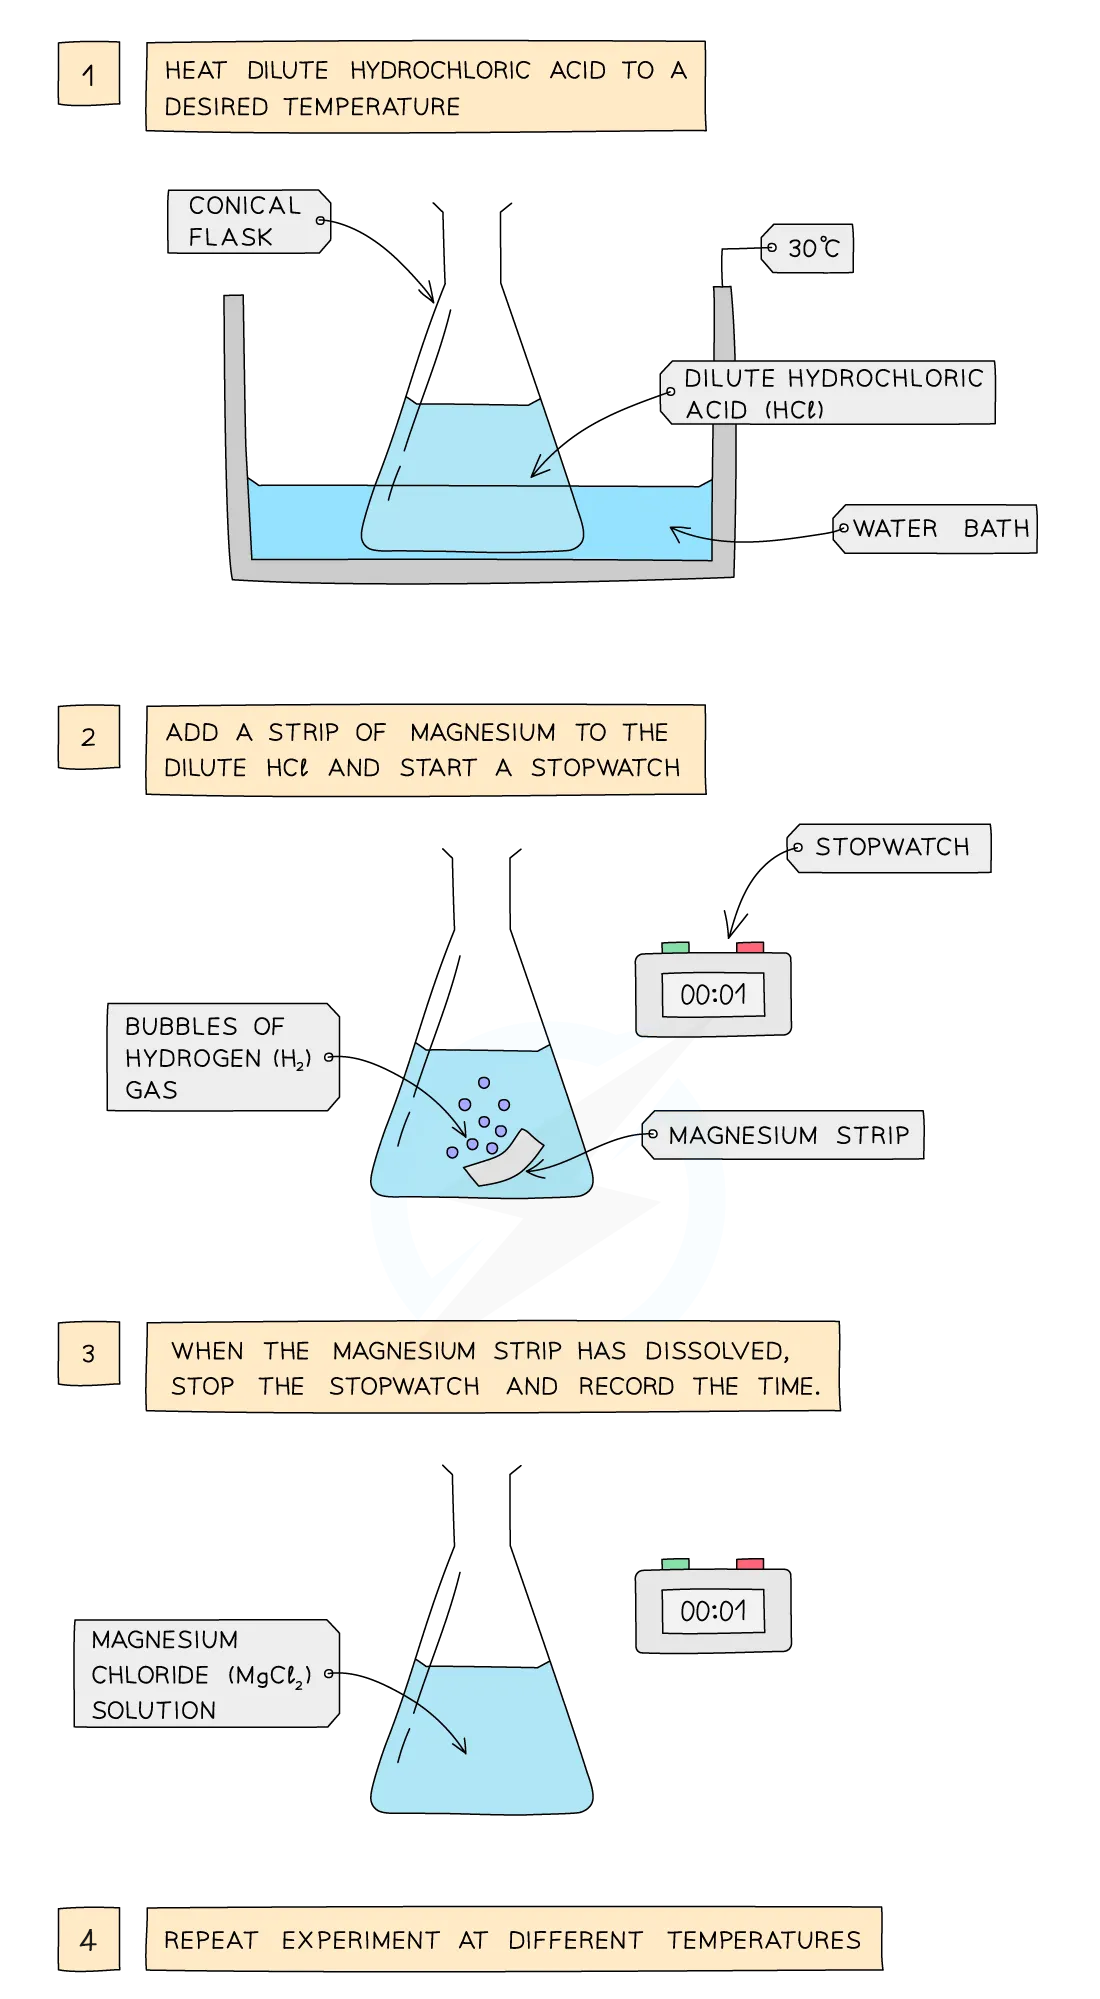
Diagram showing the apparatus needed to investigate the effect of temperature on the rate of reaction
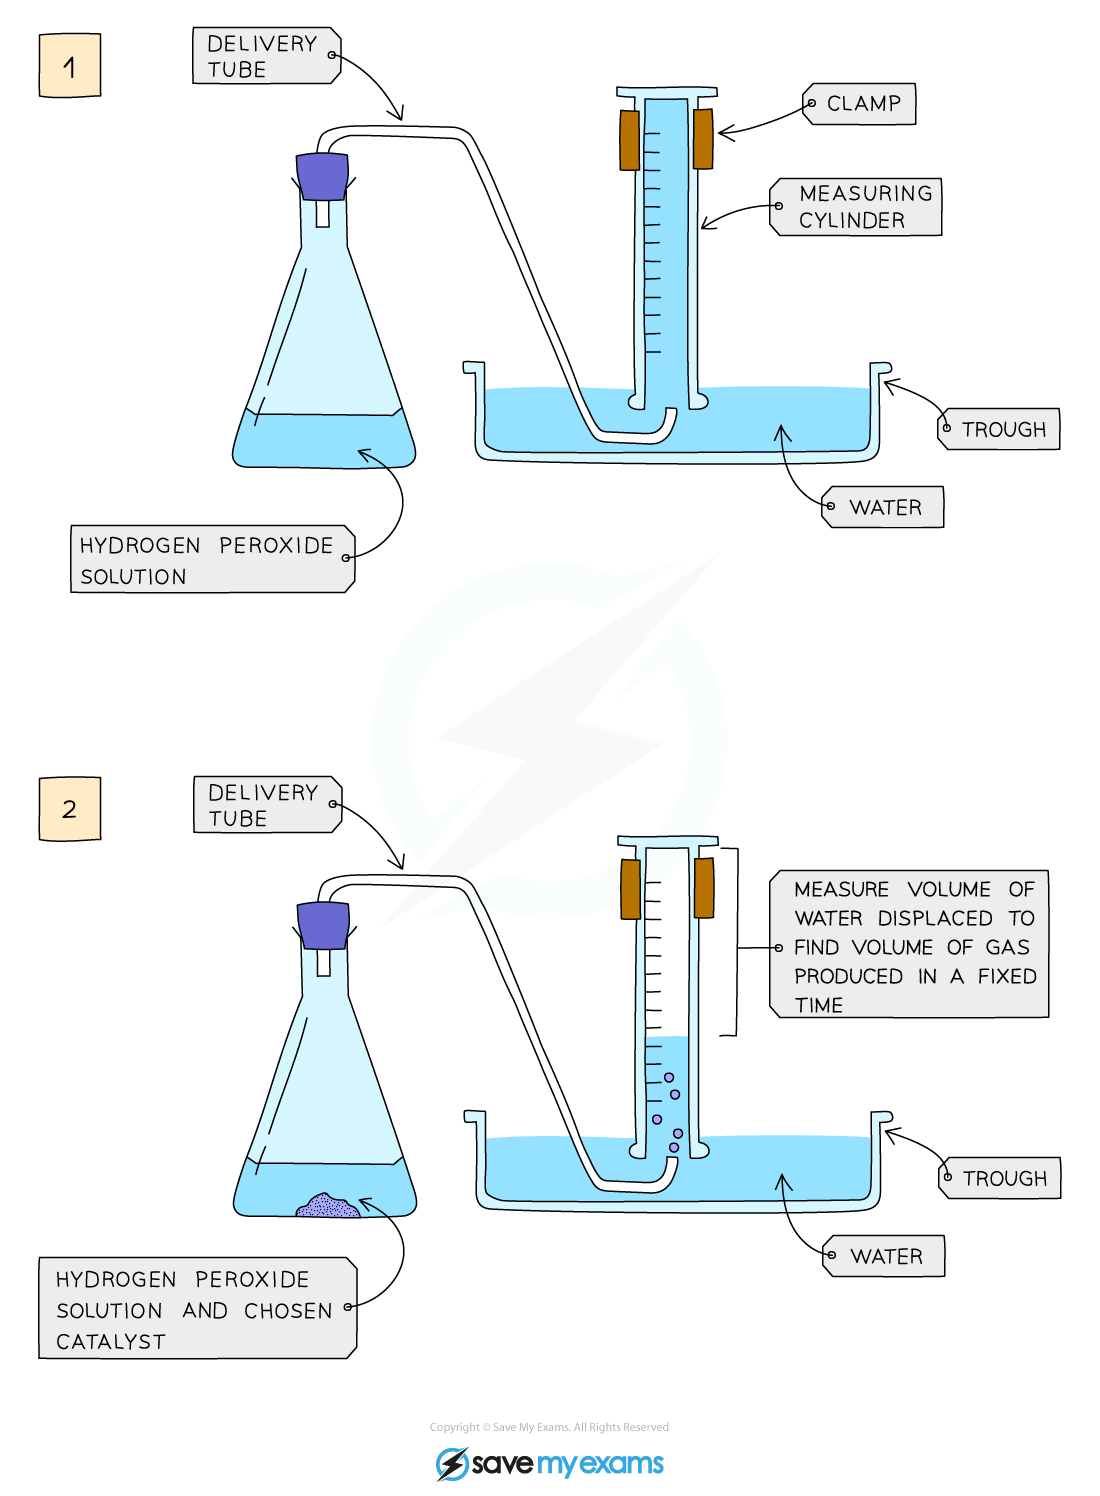
Diagram showing the apparatus needed to investigate the effect of a catalyst on the rate of reaction
Key points
- The temperature experiment heats dilute hydrochloric acid to a set temperature in a water bath.
- A strip of magnesium is added, the stopwatch started, and the time taken for the metal to dissolve is recorded.
- The experiment is repeated at different temperatures and the results compared.
- The catalyst experiment adds manganese(IV) oxide to hydrogen peroxide and collects the oxygen produced.
- The run is repeated without the catalyst so the two gas volumes can be compared.
First pass
Warm the acid to a chosen temperature, drop in magnesium and time how long it takes to vanish; then try a hotter bath. For catalysts, run the peroxide reaction with the powder and again without, and compare the gas collected.
Analogy — One test is timing how fast sugar dissolves in warm versus cool tea; the other is checking whether a pinch of powder makes a bottle fizz faster.
Exam pointer — State the timed quantity and the comparison run for each experiment, with the factor varied named.
Going deeper
Dilute hydrochloric acid is warmed to a set temperature in a water bath, magnesium is added, and the time for the metal to fully dissolve is recorded before repeating at other temperatures. In the catalyst experiment the oxygen collected from hydrogen peroxide in a fixed time is compared with and without manganese(IV) oxide.
Analogy — The magnesium race gets faster as the water bath climbs, while the peroxide test is a race run twice, once with a helper and once without.
Exam pointer — Quote the water bath, the dissolve time and the with-and-without comparison when describing these methods.
Checks
0 of 9 attempted · 0 correct
3.Factors, graphs and the economic angle
Four factors govern how fast reactions run, and each leaves a fingerprint on the rate graph. This lesson collects the fingerprints and adds the industrial reason anyone cares.
Key points
- The factors affecting rate are concentration or pressure, temperature, surface area of solids and catalysts.
- A faster reaction shows a steeper starting gradient that becomes horizontal sooner.
- Graphs for changed conditions still finish at the same amount of product.
- Increasing the concentration, pressure, temperature or surface area each increases the rate of reaction.
- Industry favours higher rates because faster production is more efficient and sustainable.
First pass
Every factor that packs particles closer or makes them livelier steepens the start of the graph. The curve flattens at the same final product amount, and industry chases that steep start for cheaper production.
Analogy — It is like three routes up the same hill: steeper starts reach the top sooner, but the summit height never changes.
Exam pointer — Sketch or describe the steeper-start-same-plateau shape and name the four rate factors.
Going deeper
Compared with the slower condition, a faster reaction line starts with a steeper gradient and flattens sooner while forming the same amount of product. Concentration, pressure, temperature, surface area and catalysts are the levers, and raising the first four raises the rate that industry prizes.
Analogy — Two commuters reach the same office, but the express train gets there earlier and waits; the destination is fixed, only the pace differs.
Exam pointer — Compare two lines by gradient, plateau timing and final product, and tie faster rates to production efficiency.
Checks
0 of 9 attempted · 0 correct
From the revision note
Diagrams on this note's page that are not tied to a specific lesson.
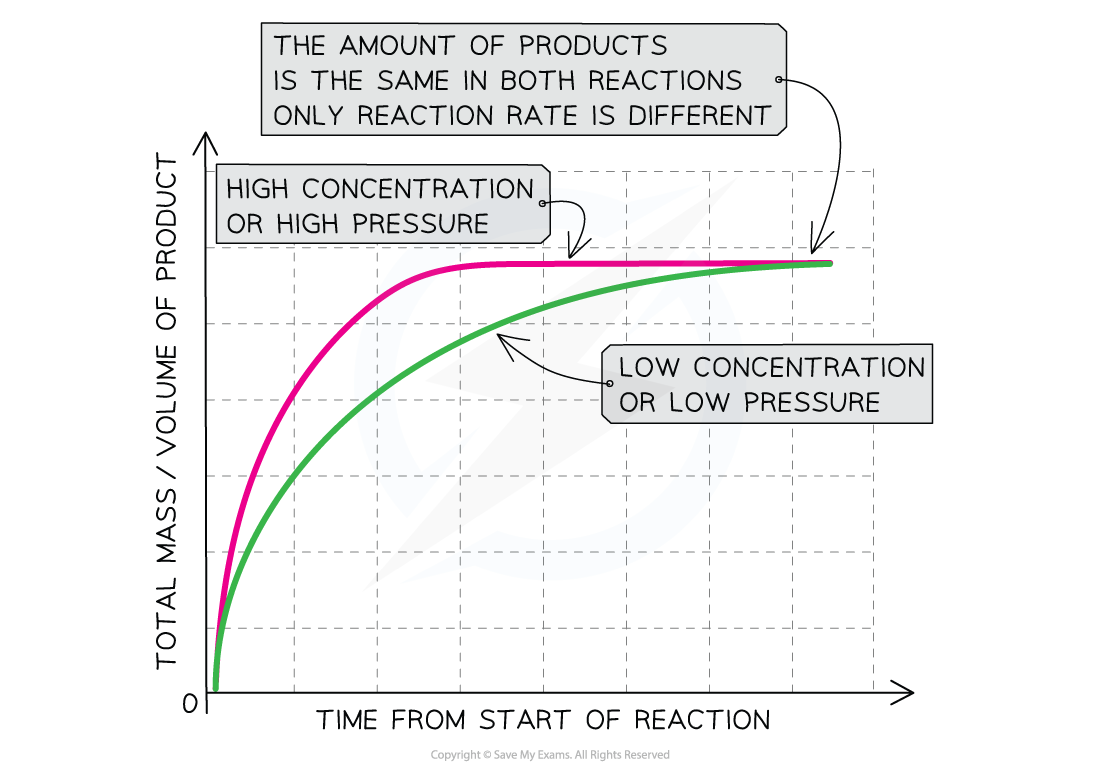
Increasing the concentration of a solution or gas pressure increases the rate of reaction
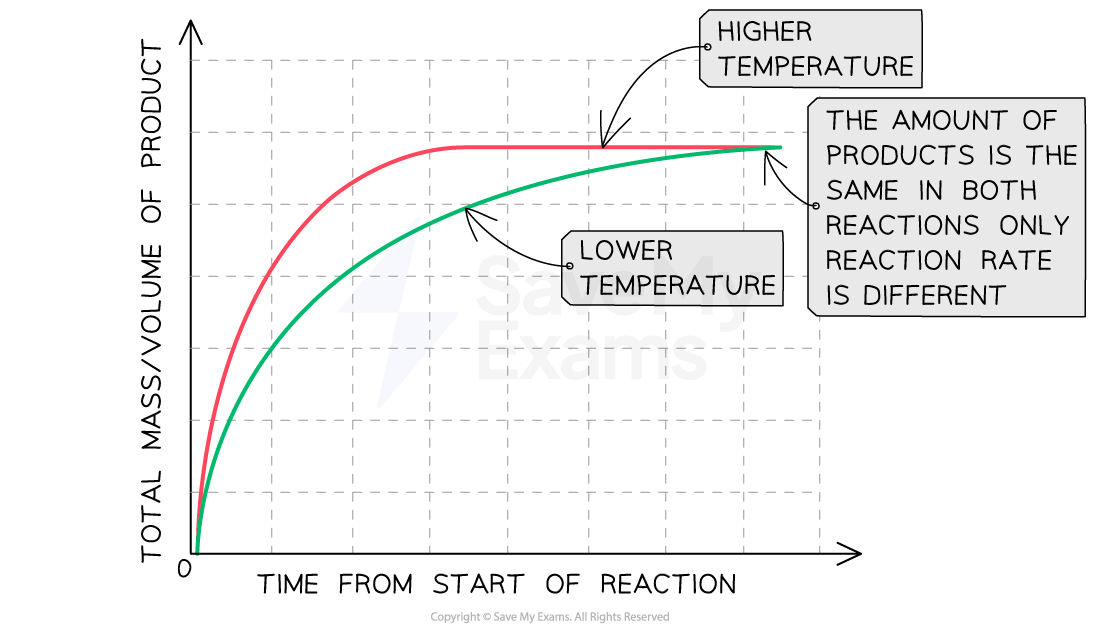
Increasing the temperature increases the rate of reaction
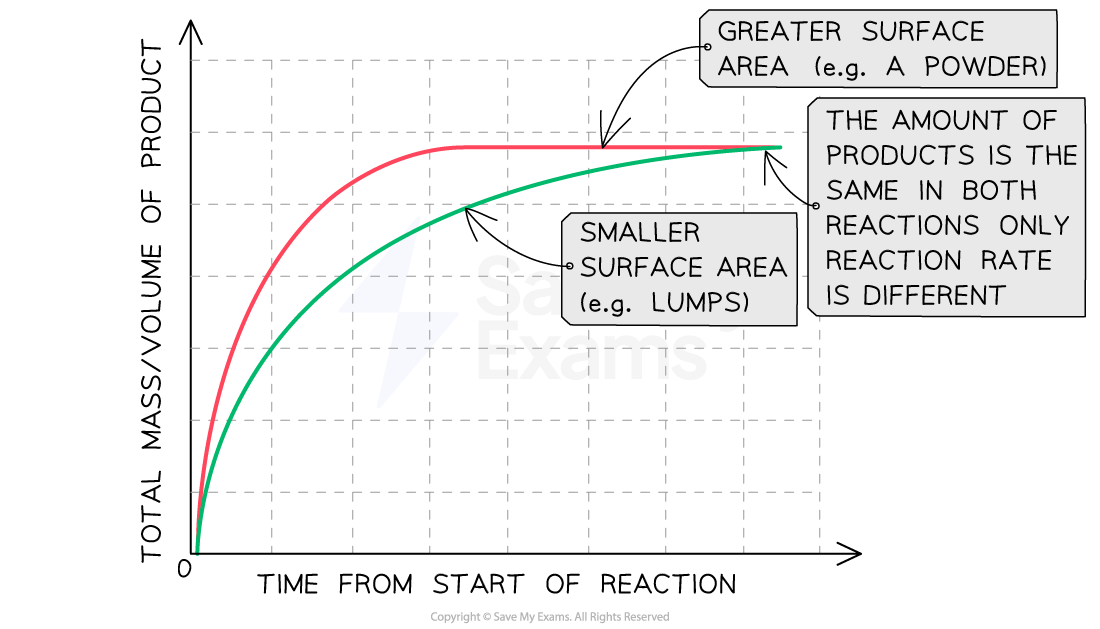
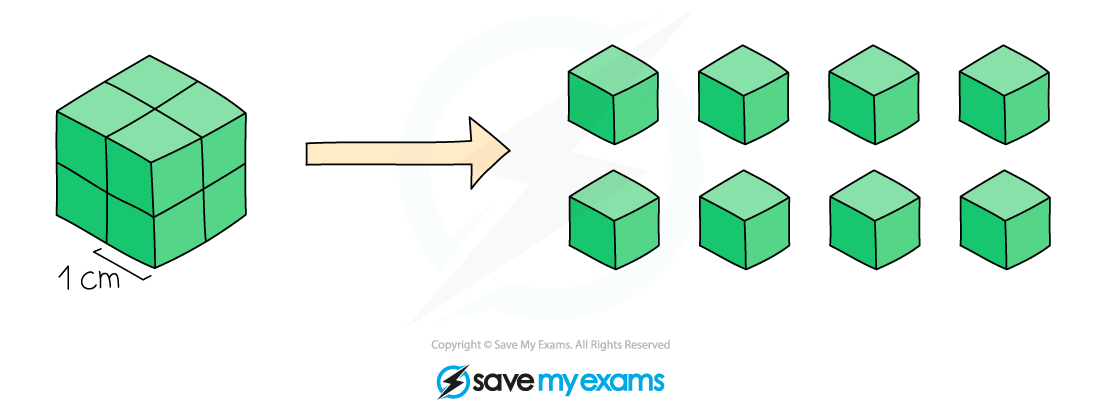
Increasing the surface area increases the rate of reaction
Guided content from the SME authoring corpus — note rn_XJ8qXfzZJJFKXHnF, pinned at 51a6ed34e715 · promoted SyllabAI/syllabai-resources e967e75f1339