Energy Level Diagrams
2 guided lessons · 18 checks · 3. Physical Chemistry → Energetics
Guided lessons for this note
Which concept don't you understand yet?
We'll explain it simply and check your understanding. Pick any lesson — any order works.
0 of 18 checks correct so far
Lesson 1 of 2
Reading the axes and arrows
An energy level diagram is a map of where the energy sits before and after a reaction. This lesson fixes the axes, the two levels and the arrow that tells you which way the heat flowed.
What you know already
From Exothermic & Endothermic you already know which reactions warm their surroundings and which cool them. This note draws that story as a picture, placing reactants and products on an energy axis so the direction of change can be read at a glance. Two carefully labelled sketches are all the exam asks for.
Key points of understanding
- An energy level diagram sets the energies of reactants and products side by side for comparison.
- Energy runs up the y-axis while the x-axis tracks how far the reaction has progressed.
- Arrows point downwards for exothermic reactions and upwards for endothermic ones.
- The height difference between reactants and products represents the overall enthalpy change.
- Reactants sit above products in exothermic reactions and below them in endothermic ones.
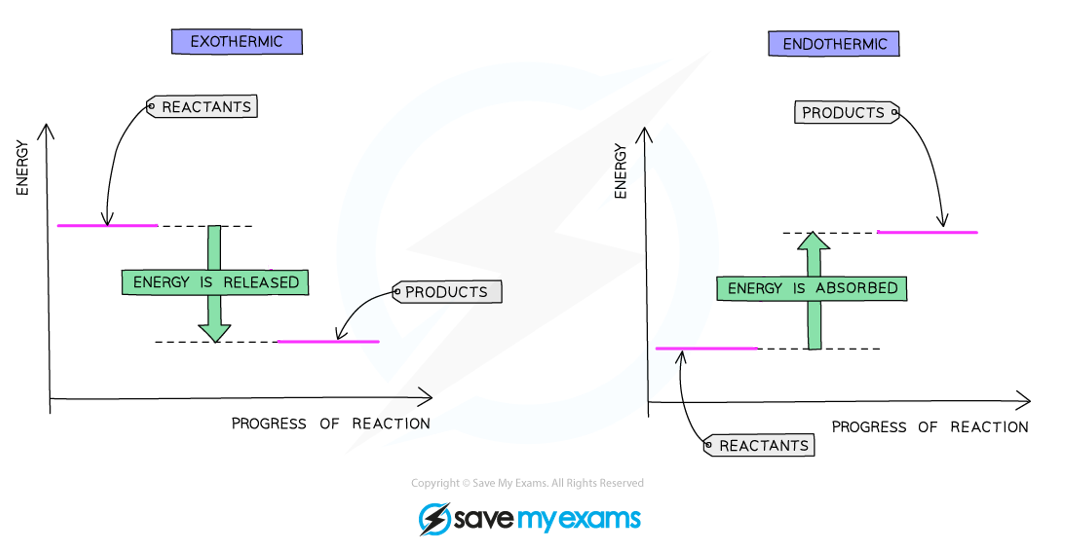
Energy level diagram of an exothermic reaction and an endothermic reaction
Choose a confidence level to continue.
Prefer to read it all at once? Show the full lesson as a page
1.Reading the axes and arrows
An energy level diagram is a map of where the energy sits before and after a reaction. This lesson fixes the axes, the two levels and the arrow that tells you which way the heat flowed.
Energy level diagram of an exothermic reaction and an endothermic reaction
Key points
- An energy level diagram sets the energies of reactants and products side by side for comparison.
- Energy runs up the y-axis while the x-axis tracks how far the reaction has progressed.
- Arrows point downwards for exothermic reactions and upwards for endothermic ones.
- The height difference between reactants and products represents the overall enthalpy change.
- Reactants sit above products in exothermic reactions and below them in endothermic ones.
First pass
The sketch puts energy up the side and the run of the reaction along the bottom. Two lines mark the starting and ending energy, and an arrow between them shows heat leaving or entering.
Analogy — It is like a thumbnail sketch of a hill walk: the two heights matter, and the arrow between them says whether you climbed or descended.
Exam pointer — Label both axes, both energy levels and the arrow direction whenever you draw or read one.
Going deeper
The y-axis carries the energy of the reactants and products while the x-axis tracks the progress of the reaction. A downward arrow marks an exothermic change and an upward arrow an endothermic one, with the vertical gap giving the overall enthalpy change.
Analogy — Think of a lift journey between two floors: the shaft is the axis, the floors are the energy levels, and the direction of travel is the arrow.
Exam pointer — Quote both features examiners scan for: labelled axes and a correctly directed arrow between the levels.
Checks
0 of 9 attempted · 0 correct
2.Drawing the two labelled sketches
The exam rewards two tidy sketches: one with products below reactants, one with products above. This lesson sets out the labels that must never be missing and the negatives that must never creep in.
Key points
- An exothermic sketch shows reactants high, products low and a downward arrow between them.
- An endothermic sketch shows reactants low, products high and an upward arrow between them.
- Both sketches need labelled axes, named energy levels and the direction of energy change.
- The enthalpy change is negative for the exothermic sketch and positive for the endothermic one.
- Energy is given out in exothermic reactions and taken in in endothermic reactions.
First pass
Draw the axes first, then two levels: high-to-low with a down arrow for warming reactions, low-to-high with an up arrow for cooling ones. Write the names on every line.
Analogy — Two sketches are like before-and-after photos on a staircase: the same stairs, but the people stand on different steps.
Exam pointer — Examiners award marks for labels, so annotate axes, levels and arrows before anything else.
Going deeper
For the exothermic sketch place the reactant level above the product level and mark the change negative with a downward arrow. For the endothermic sketch reverse the placement, mark the change positive and point the arrow upwards.
Analogy — It is like drawing water slides in opposite directions: same structure, but one drops and one would need a pump to climb.
Exam pointer — Pair each sketch with its sign: negative below, positive above, and keep the arrow obeying the same rule.
Checks
0 of 9 attempted · 0 correct
Guided content from the SME authoring corpus — note rn_HNXFQt7vM32g6PMv, pinned at 51a6ed34e715 · promoted SyllabAI/syllabai-resources e967e75f1339