Practical: Investigating Temperature Changes
2 guided lessons · 18 checks · 3. Physical Chemistry → Energetics
Guided lessons for this note
Which concept don't you understand yet?
We'll explain it simply and check your understanding. Pick any lesson — any order works.
0 of 18 checks correct so far
Lesson 1 of 2
Setting up and running the temperature-change practical
The practical performs a calorimetry study of hydrochloric acid reacting with sodium hydroxide solution. This lesson lists the apparatus, then walks the five steps that build the results table.
What you know already
From Calorimetry you already know how an insulated cup turns a reaction into a temperature reading. This practical applies that apparatus to a neutralisation between acid and alkali, adding acid in steps to map how the energy change grows. The graph you plot at the end identifies the mixture that releases the most heat.
Key points of understanding
- The aim is a calorimetry study of the reaction between hydrochloric acid and sodium hydroxide.
- Apparatus includes dilute acid, dilute alkali, a polystyrene calorimeter with lid, a measuring cylinder, thermometer and stirrer.
- A lid is required on the calorimeter to prevent heat loss during the experiment.
- The method places sodium hydroxide solution in the calorimeter, records its temperature, then adds acid in 5 cm3 portions.
- After each addition the highest temperature reached by the mixture is measured and recorded.
Choose a confidence level to continue.
Prefer to read it all at once? Show the full lesson as a page
1.Setting up and running the temperature-change practical
The practical performs a calorimetry study of hydrochloric acid reacting with sodium hydroxide solution. This lesson lists the apparatus, then walks the five steps that build the results table.
Key points
- The aim is a calorimetry study of the reaction between hydrochloric acid and sodium hydroxide.
- Apparatus includes dilute acid, dilute alkali, a polystyrene calorimeter with lid, a measuring cylinder, thermometer and stirrer.
- A lid is required on the calorimeter to prevent heat loss during the experiment.
- The method places sodium hydroxide solution in the calorimeter, records its temperature, then adds acid in 5 cm3 portions.
- After each addition the highest temperature reached by the mixture is measured and recorded.
First pass
Put a measured portion of alkali in an insulated cup, read the starting temperature, then stir in acid a little at a time. After every addition, note the highest temperature the mixture reaches.
Analogy — It is like adding chilli to a soup spoonful by spoonful, rating the heat after each stir until you find the strongest mix.
Exam pointer — Name the insulated cup with its lid and the fixed starting volume when describing the set-up.
Going deeper
A fixed volume of sodium hydroxide solution is placed in the calorimeter and its temperature taken, then dilute hydrochloric acid is added in 5 cm3 portions with stirring. The highest temperature reached after each addition is recorded, and the whole run is repeated with the acid volume increasing each time.
Analogy — Each acid portion is one rung on a ladder: climb one rung at a time and record how hot the run gets before stepping up again.
Exam pointer — Quote the fixed alkali volume, the 5 cm3 acid step and the maximum-temperature reading as the core of the method.
Checks
0 of 9 attempted · 0 correct
2.Results, graph and conclusion
The numbers only become an answer once they are graphed. This lesson tables the results, draws the line of best fit and reads off the volume of acid that releases the most heat.
Key points
- Results are recorded in a table of acid volume against the temperature reached.
- A graph of the results is plotted with a line of best fit drawn through the points.
- The graph identifies the volume of acid that causes the biggest temperature change.
- The larger the temperature difference, the more energy is absorbed or released by the reaction.
- This practical is one example of the simple calorimetry experiments described for neutralisation.
First pass
Each run gives one pairing of acid volume and peak temperature, collected into a table with two columns. Plotting the pairs and drawing a best-fit line shows which acid volume warmed the mixture most.
Analogy — It is like marking your best javelin throws on a chart to spot the distance that worked best.
Exam pointer — Sketch the table headings and the axes, then point to the peak of the line as the answer.
Going deeper
The results table pairs each acid volume with the maximum temperature reached, and the plotted line of best fit locates the volume causing the biggest temperature change. Since a larger temperature difference means more energy absorbed or released, that volume marks the mixture releasing the most heat.
Analogy — A tasting chart of soup samples: each row is a recipe strength, and the tallest bar on the graph names the winner.
Exam pointer — Link the biggest temperature change to the greatest energy change, and name the practical as solution calorimetry.
Checks
0 of 9 attempted · 0 correct
From the revision note
Diagrams on this note's page that are not tied to a specific lesson.
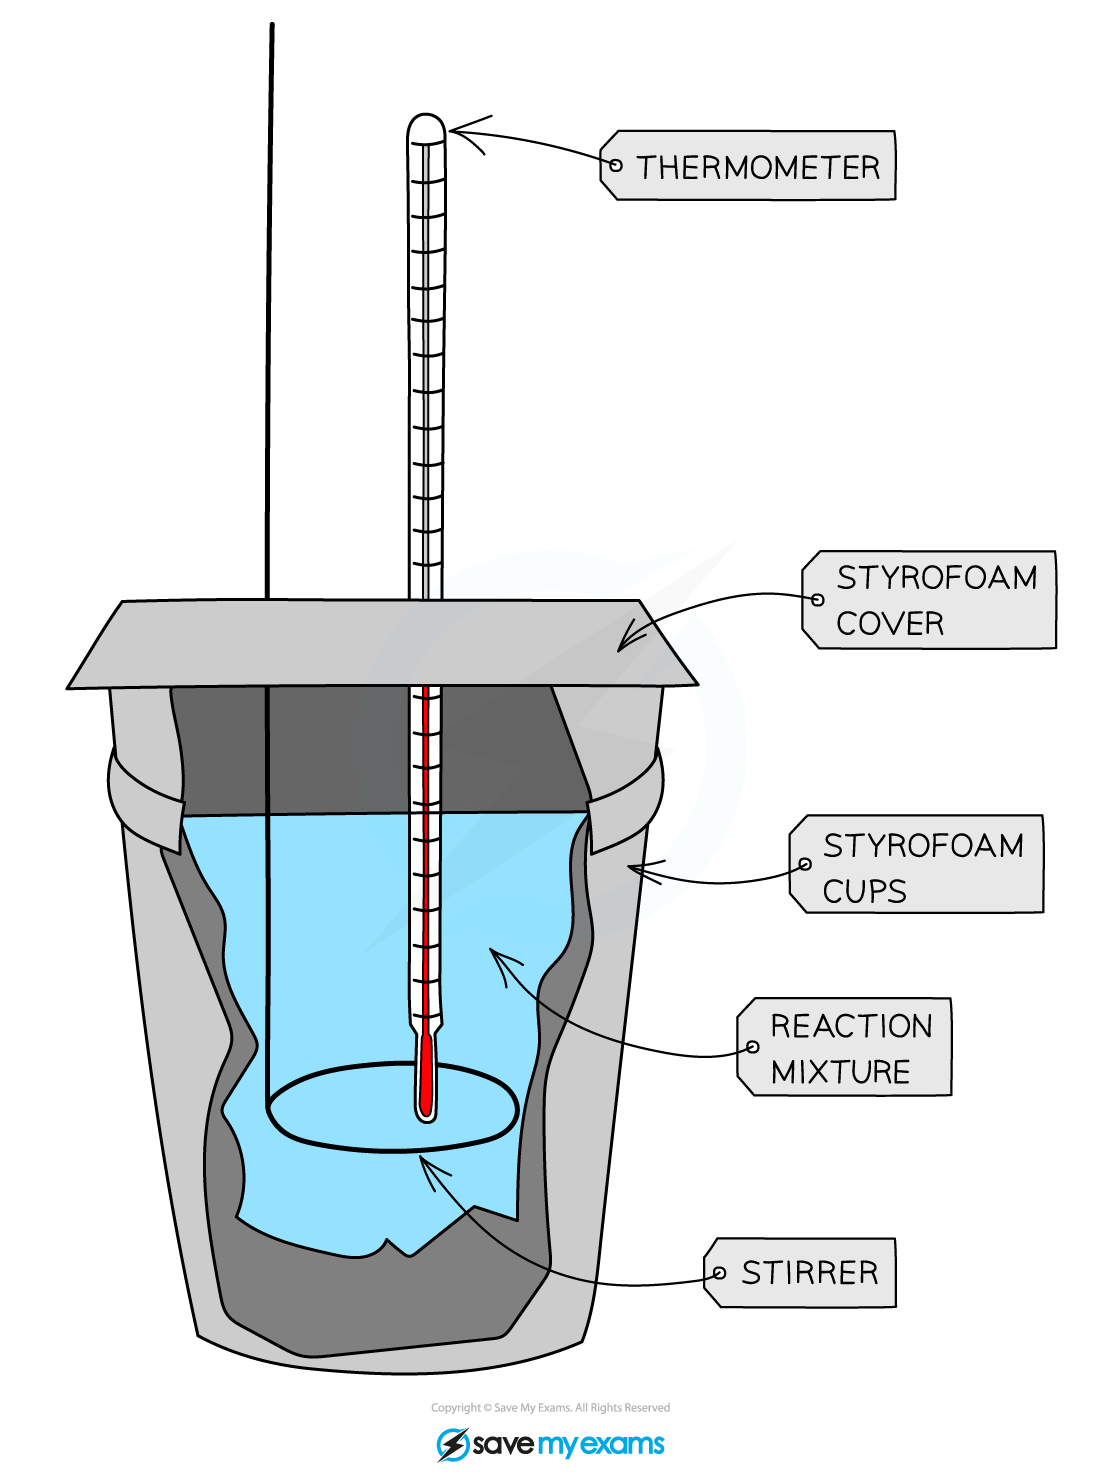
A lid is required to prevent heat loss
Guided content from the SME authoring corpus — note rn_6478QfpYNQDjZSvt, pinned at 51a6ed34e715 · promoted SyllabAI/syllabai-resources e967e75f1339