Hazardous Practical Skills (Edexcel IGCSE Geography)
Spec point —
4GE1-S9.128
Hazardous environment fieldwork
-
Fieldwork in a hazardous environment is based on the physical processes involved in an extreme weather event
-
To undertake a weather fieldwork enquiry there are a range of practical skills and methods that are used
-
These can be applied to any weather fieldwork
-
The fieldwork enquiry should be linked to geographical theory
- In a weather fieldwork enquiry, the theories of microclimate and the passage of a depression or tropical storm can be used
Aims and hypothesis
-
The aims and hypothesis come from questions asked about the weather, such as:
- How does the weather change as a depression passes over an area?
- How does the microclimate of an area vary?
- What are the impacts of the built environment on microclimate?
-
Aims look like this:
- An investigation into the effect of school buildings on the microclimate
- An investigation into the changing weather patterns during the passage of a depression
-
Hypothesis would be a statement:
- Temperatures decrease with distance from buildings
- Precipitation is greatest when air pressure is lowest during the passage of a depression
-
After the aims and hypothesis of the fieldwork have been established, the next steps include:
- Selecting the sites – this will involve sampling
- Deciding on the equipment to be used
- Considering any health and safety issues - completing a risk assessment
- Data collection method
Worked Example (i) Suggest one aim of a microclimate investigation
Final answer: Answer:
Any valid aim acceptable for 1 mark
The 2nd mark requires the development of the aim:
- measure weather conditions (1 mark)
- compare with another local site (1 mark)
- measure temperature … (1 mark)
- compare with Met Office station recordings for that area (1 mark)
(ii) Identify three reasons why a microclimate investigation might not achieve the aim given in (i)
Final answer: **Answer: **
- accuracy of data collected (1 mark)
- sufficient data collected** (1 mark)**
- careful data recording (1 mark)
- accuracy of data collation (1 mark) and data presentation (1 mark)
- reliable analysis and interpretation of findings (1 mark)
- validity of conclusions reached (1 mark)
- realism and practicality of aim (1 mark)
- suitability of sites chosen (1 mark)
Site selection and sampling
-
It is not practical to include all weather measurements throughout the day or to take measurements at all sites
-
To select sites, sampling should be used
- Sampling will reduce bias
- It will provide an overview of the whole
-
There may be situations where access to the sample site may not be possible, meaning an opportunistic approach may need to be taken
- The site should be as close as possible to the site selected using sampling
-
The most commonly used sampling strategies for a weather enquiry are:
- Systematic- sampling of sites at regular intervals along a transect line
- Random- this means that all sites have an equal chance of being selected. A grid placed across a map of the school site would enable random sampling
- Stratified - sampling sites which represent the whole
Worked Example A group of students have investigated the physical processes involved in an extreme weather event by recording a weather diary. The students use an anemometer to record wind speed every hour.
Identify the sampling method used **
(1 mark)
** A. **Systematic
** B. **Random
C. Stratified
** D. **Opportunistic
Final answer: Answer:
- A (1 mark)** - Systematic (the measurements are taken at regular intervals)
Worked Example Outline three factors which should be considered when choosing a suitable sampling site for a microclimate enquiry (6 marks)
Final answer: Answer:
- Different surroundings (1 mark) 2nd mark for this to be exemplified twice e.g. south-facing aspect (1 mark); sheltered spot (1 mark); open space (1 mark)
- 1 mark allowed for valid health and safety considerations, e.g. trespass (1 mark); traffic (1 mark)
- open space (1 mark) gives a more 'natural' reading for the area (1 mark)
- trespass (1 mark) ensure permission acquired (1 mark)
Equipment
-
To complete weather measurements, a range of equipment is needed
-
The equipment includes the following:
- Equipment may be in a Stevenson Screen
- Thermometer- temperature
- Hygrometer- humidity
- Anemometer- wind speed
- Barometer - air pressure
- Wind vane- wind direction
- Rain gauge- precipitation amount
- Pencil for writing data
- Camera to take photographs of equipment/measurements
Risk assessment
-
Any fieldwork will involve consideration of health and safety using a risk assessment
-
Risks specifically associated with weather fieldwork may include:
- Weather conditions
- Slipping on uneven ground
- Working in an unfamiliar place
- Misuse of equipment – mercury thermometers
- Traffic
Worked Example A group of students investigated the physical processes involved in an extreme weather event by recording a weather diary.
**(i) Identify one risk that the students may identify when undertaking a risk assessment for the investigation **
(1 mark)
Final answer: Answer:
- (Falling over in) strong winds (1 mark).
- Exposure to sunburn** (1 mark)**
- Slips/trips/bumps (1 mark)
- An extreme weather event (1 mark)
- Heavy rain/flooding (1 mark)
**(ii) State one way this risk could be managed **
(1 mark)
Answer: *(Staying indoors is not accepted and the answer must be specific to the answer given to (i))
- Avoid exposed locations / out in the open** (1 mark)**
- Collecting data once the storm has died down (1 mark)
- Use secondary data** (1 mark)**
- Walking with care** (1 mark)
- Working in groups (1 mark)
- Wearing sunscreen suntan lotion (1 mark)
- Staying away from a storm (1 mark)
- Using a weather forecast (1)
- Remote collection of weather data (1 mark)
Using Equipment in the Field - hazards
Spec point —
4GE1-S9.128
Using equipment in the field - Hazardous environments
Data collection methods
- The data collection methods depend on the aims/hypothesis of the fieldwork
- A weather diary and a microclimate study will both require the use of meteorological (weather) instruments to take measurements
- Data collection should include both quantitative and qualitative methods
Weather diary
- A weather diary is a record of weather conditions over a set period
Measuring the weather
- A digital weather station can be used to record the weather
- Alternatively, individual instruments can be used
- To ensure the accuracy of data, some of the instruments – thermometer, hygrometer and barometer – should be placed in a Stevenson screen
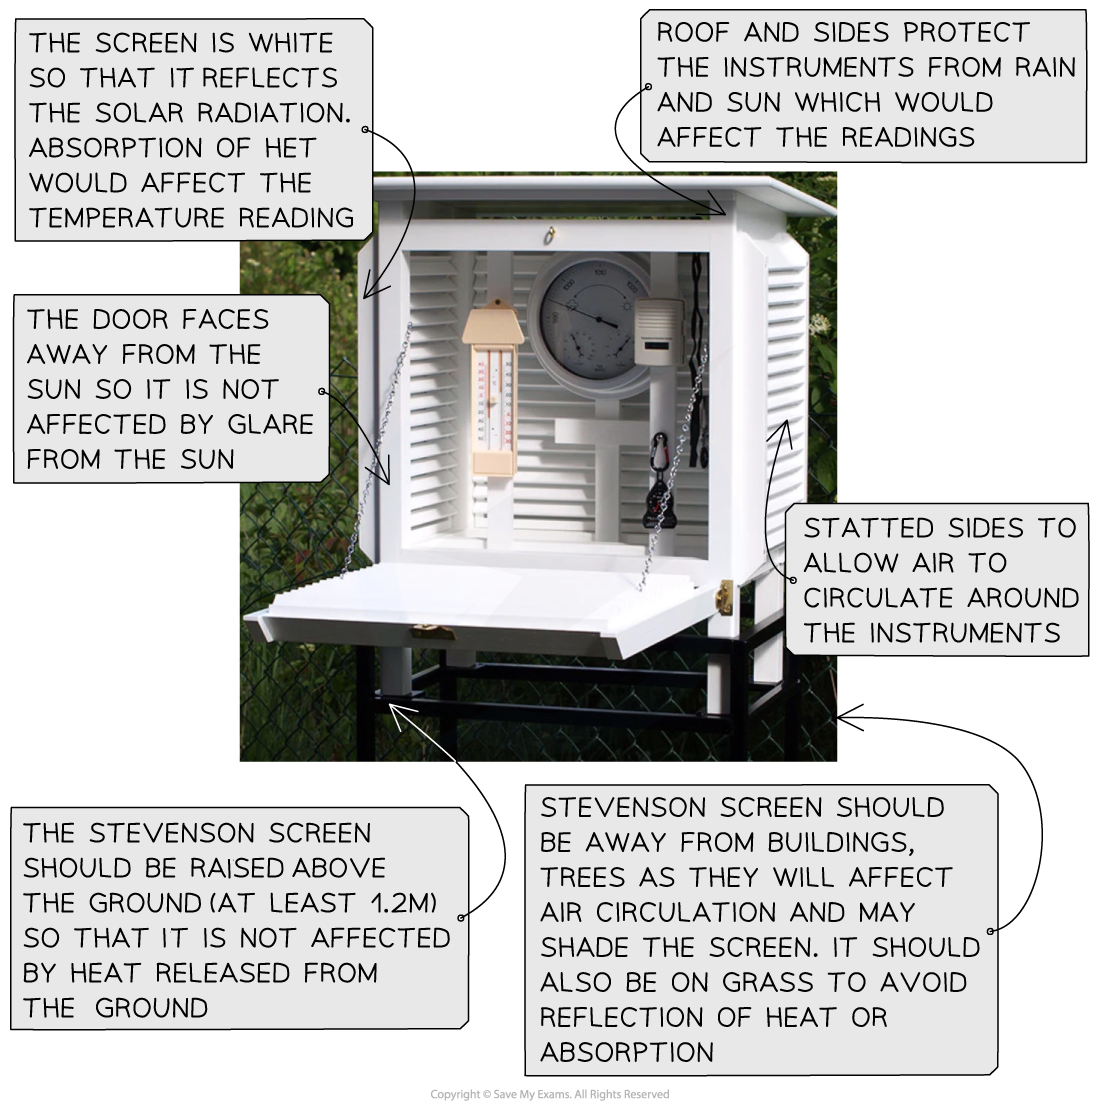
Features of a Stevenson screen
-
Temperature
- Measured using a maximum and minimum thermometer
- These give the maximum and minimum readings over 24 hours
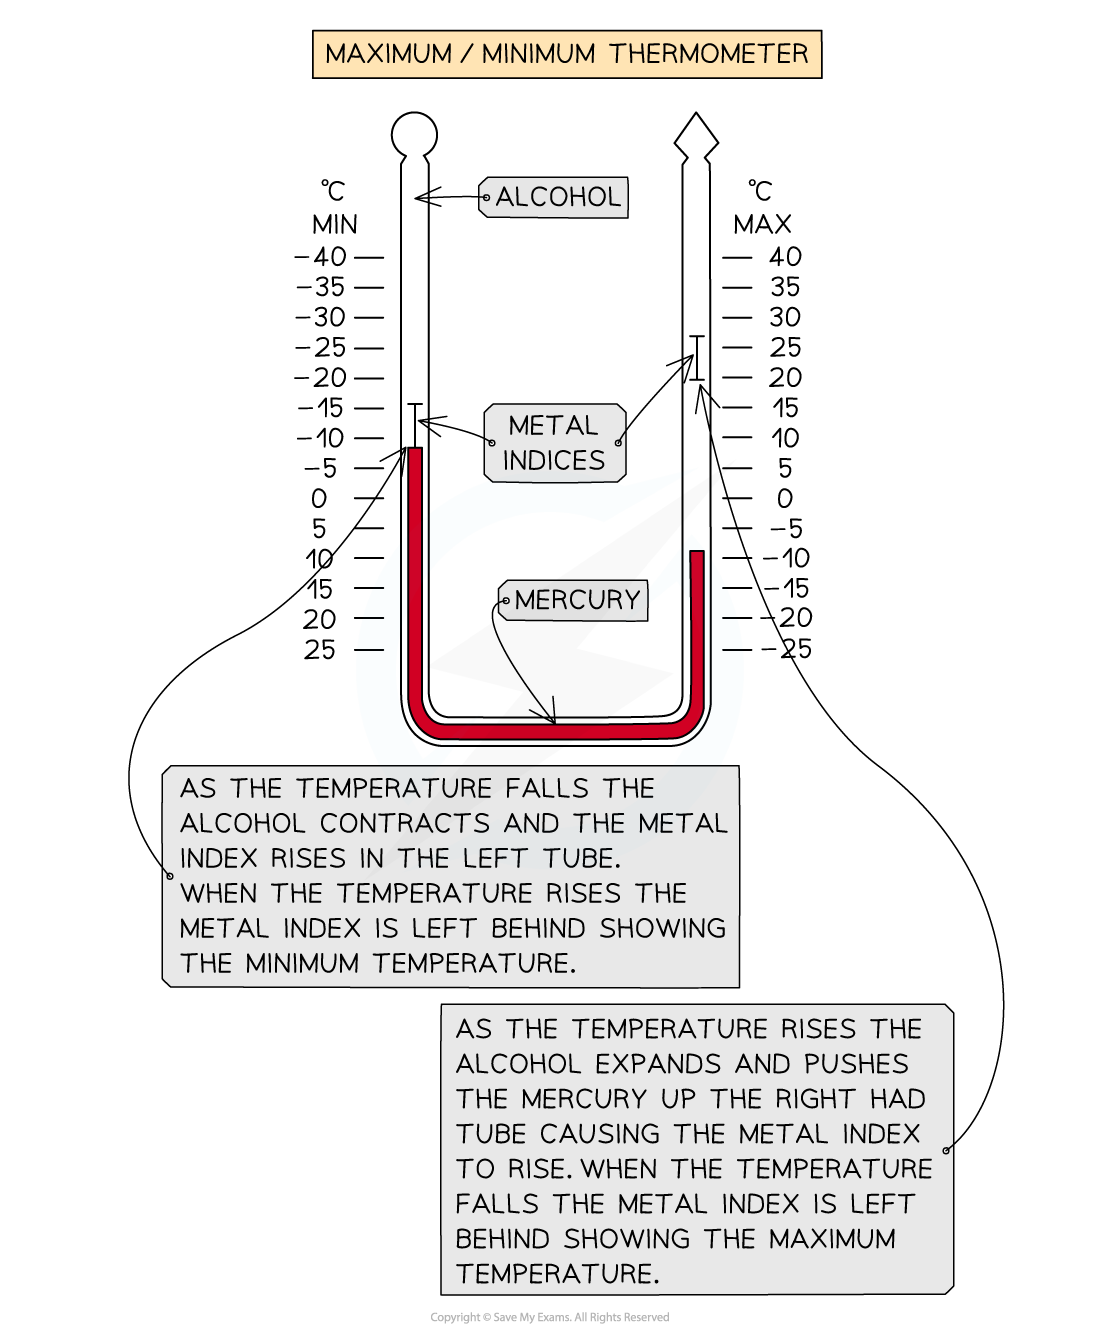
Measurements on a maximum and minimum thermometer
-
Air pressure
- Measured using a barometer in millibars
-
Humidity
- Measured using a hygrometer as a percentage
-
Wind speed
- Measured using an anemometer in km/h
-
Wind direction
- A wind vane is used to give the direction the wind is coming from
-
Rainfall
- A rain gauge measures the amount of rainfall in mm
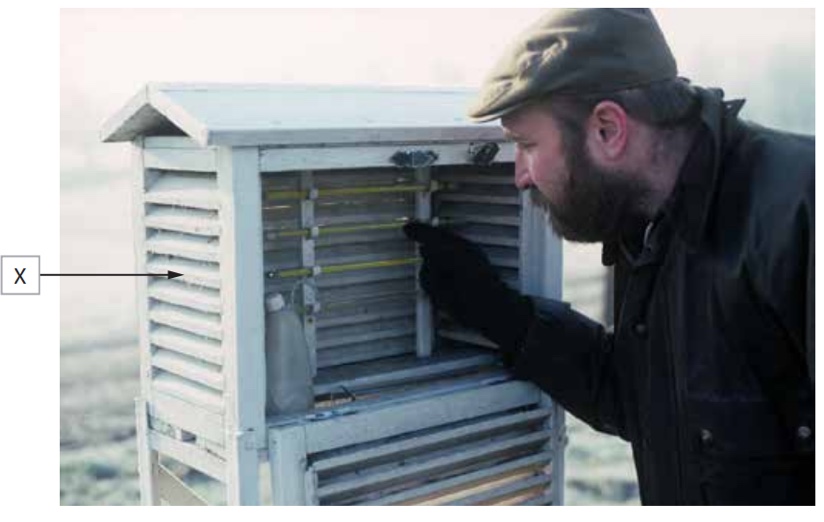
Worked Example Study Figure 1 shows a geographer collecting weather data
Figure 1 - collecting weather data
Name piece of equipment X
(1 mark)
Final answer: Answer: **
- Stevenson screen (1 mark)
** Describe how a piece of equipment X is used in collecting weather data **
(3 marks)
Answer:** This should outline how the equipment is used:*
- Regular visits with log (1 mark). Open the front panel and record data **(1 mark). Log current instrument readings (1 mark) **
- Housing for a variety of instruments** (1 mark).** Allows air temperature in shade, not sun-exposed temperature, to be recorded (1 mark). Safety and instrument protection (1 mark)
Photographs and field sketches
- Photographs and field sketches are qualitative data
- Just as with any data collection and presentation, they have strengths and weaknesses
- In a weather enquiry, photographs and field sketches can be used to show weather conditions and sample site locations
- Photographs are also useful for illustrating the data collection methods used
Worked Example To extend a weather study, students recorded wind speeds every hour using an anemometer. Students were asked to use one other primary data method.
Explain one other primary data method
(3 marks)
Answer: *You will gain 1 mark for the identification of a primary data method and 2 further marks for explaining how this can be used.
- Rain – the use of a rain gauge (1 mark) to collect data on mm of rainfall over some time (1 mark). Data can be plotted to explore patterns**(1 mark) **
- Temperature – the use of a thermometer (1 mark) to measure temperature**(1 mark). Plotted data against wind speed to explore patterns over some time (1 mark) **
- Air pressure – the use of a barometer (1 mark) to measure air pressure**(1 mark). Plotted against wind speed to explore patterns over some time (1 mark)
Exam Hint Annotations and labels are not the same. A label is a simple descriptive point. For example, 'shaded area'. Whereas an annotation is a label with a more detailed description or an explanatory point. For example, a south-facing classroom which receives more sun through the day will be warmer than a north-facing classroom.
Was this revision note helpful?