Coastal Enquiry Skills (Edexcel IGCSE Geography)
Coastal Fieldwork Report
Spec point —
4GE1-S9.128
The fieldwork report
Coastal enquiry data presentation
- Data presentation can take many forms
Primary data
-
Much of the primary data collected in a coastal enquiry will be presented in the form of graphs
- Each type of graph is suitable for particular data sets
- The graphs also may have strengths and limitations
-
Suitable graphs include:
-
Line graphs which show continuous changes in data over time, for instance:
- traffic flows
- population change
- height of sediment (groyne profile)
-
Bar graphs show data using rectangles that are drawn to a certain length (height)
- Number of people in certain locations
- Sediment size along a transect
-
Scatter graphs show either a positive or negative relationship between two variables plotted onto a graph
- Sediment size and beach gradient
- Wave count and time
-
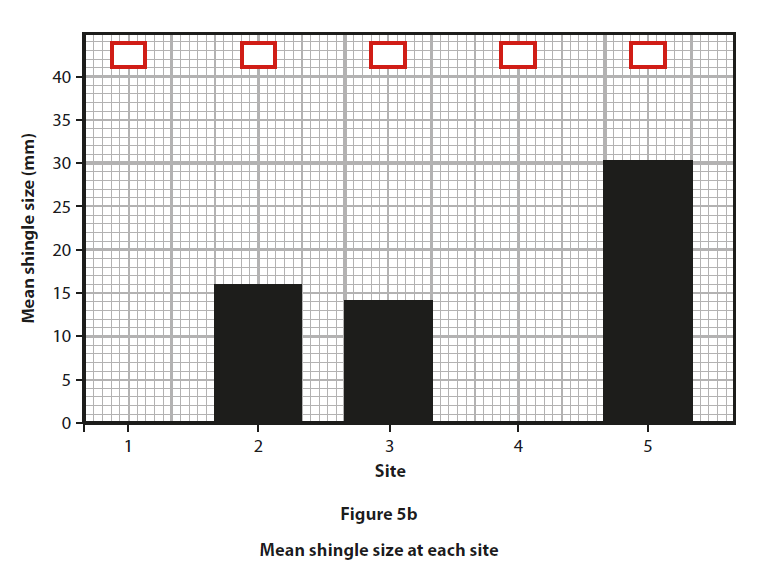
Worked Example **Using the data in Figure 5a, complete Figure 5b below for measurements 1 and 4 **
(2 marks)
Site Mean shingle size (mm) 1 21.1 2 16.0 3 14.1 4 10.0 5 30.1
Final answer: Answer:
- Award 1 mark for each correct bar
- To be awarded the mark for the first bar, the line must be drawn between 21-22
- The second bar needs to be right on the line
- Shading is not required
Mark an x in the box on Figure 5b which represents the site with the anomalous result
(1 mark)
- One mark for an ‘x’ in box 5** (1)**
**Suggest one possible explanation for this anomaly **
(2 marks)
Award 1 mark for an initial reason, and a further mark for extension of this point
- E.g., human error with the equipment used to measure sediment /calculation of the mean/selection of the sample to be measured** (1), **which meant that the sediment appeared bigger than it was (1)
- The sample could have been taken from an area that is protected from the action of the waves / near groynes (1), which means that less would have taken place at this site (1)
- Site 5 may have experienced a recent rockfall** (1),** which meant that the sample was larger / less eroded than the other sites (1)
- Accept any other appropriate response
Exam Hint In the exam, you will not be asked to draw an entire graph. However, it is common to be asked to complete an unfinished graph using the data provided. You may also be asked to identify anomalous results or to draw the best fit line on a scatter graph.
Take your time to ensure that you have marked the data on the graph accurately
Use the same style as the data which has already been put on the graph
- Bars on a bar graph should be the same width
- If the dots on a graph are connected by a line, you should do the same
Secondary data
-
Any fieldwork should include secondary data as well as primary data
-
In a coastal enquiry, suitable secondary data may include:
- Weather data from the Meteorological Office (Met Office)
- Old photographs of the coastal sample site
- Newspaper articles/websites about the coastal area
- Ordnance Survey maps to identify the sample sites
- Geology maps
- Aerial photographs
Worked Example **Describe two sources of secondary data that might be useful when planning a coastal environment enquiry **
(4 marks)
Answer:
- Environment Agency or National Resources Wales provide flood maps (1) which give information about \
- locations at risk from coastal flooding (1)
- Met Office rainfall data **(1) **gives information regarding any weather events impacting on data collected (1)
- Google Earth or Ordnance Survey (OS) map** (1) **enables the identification of sample site locations (1)
- Geology map (1) rock type information for the coastal cliffs** (1)**
- Aerial photographs** (1) changes in the beach profile (1)**
- Shoreline Management Plans (SMP) from local authorities or Environment Agency or the government (1)
Analysing & Interpreting Coastal Data
Spec point —
4GE1-S9.128
Analysis
- Once data has been collected and presented it needs to be analysed
- The data which is collected from the coast, such as beach slope and pebble size is quantitative and will need to be analysed using statistical methods
One of the main statistical methods used in a coastal enquiry will be the mean, where mean pebble size or longshore drift needs to be calculated
Worked Example Study the figure below. It shows the beach data collected by the students at the five sites along the beach
Sediment characteristic Units Site 1 Site 2 Site 3 Site 4 Site 5 Long axis mm 46 56 50 60 62 Roundness score 1-6 3 3 4 5 4 Beach gradient 6 8 10 12 15
(a) Which of the following are the correct units used for the beach gradient in the figure? (1)
- a) mm
- b) °
- c) cm2
- d) m3
Answer: b °
(b) Calculate the mean and median gradient of the beach (2)
- Mean gradient = ………………… ᵒ
- Median gradient = ………………… ᵒ
Final answer: Answer:
Mean = 10.2 (add all the values together, then divide by the total number of data sets) 6+8+10+12+15 = 51 divided by 5
Median = 10 (the middle value in a set of data by organising data in order from smallest to largest)
- 6 8 10 12 15
Exam Hint Calculation of the mean is a popular exam question. You must remember the following:
Show your work by writing out the calculation in full. This is usually worth 1 mark
If asked to give your answer to one decimal place, remember to round up or down
- If the number after the first digit following the decimal point is 5 or higher, you need to round up – 10.15 would become 10.2
- If the number after the first digit following the decimal point is 4 or lower, you need to round down – 10.13 would become 10.1
Analysing photographs and field sketches
-
The analysis of photographs and field sketches is qualitative analysis
-
Photographs can be used in a coastal enquiry to analyse several features:
- Landforms and their formation
- Data collection techniques
Worked Example You have studied coastal environments as part of your geographical enquiry
Evaluate how successful your chosen data analysis methods were in answering your geographical enquiry question
(8 marks)
Final answer: Answer:
Your answer needs to make a judgement about how successful your data analysis was in enabling you to reach a conclusion
You must include examples from your enquiry
You need to demonstrate evidence of:
Different skills and techniques being used for data collection
Different skills and techniques being used for the analysis of the data
Your own conclusions
Issues with equipment
- Were there any equipment errors?
- This could be faulty equipment or issues with reading the measurements correctly
- How did these errors affect your ability to answer the enquiry question?
Issues with the enquiry design
- Were the data collection/sampling methods appropriate?
- Were more sample sites needed?
- Would a different sampling technique have been more effective?
- Should the data have been collected using a different method?
- Was additional or different equipment needed?
- How did these affect your ability to answer the enquiry question?
Issues with analysis methods
- Were the analysis methods you used – central tendency, best-fit lines, etc. – appropriate?
- Were there any alternative methods that could have been used?
- How did your use of these affect your ability to answer the enquiry question?
At the end of your answer you must make a judgement about the success of your data analysis techniques
Your evaluation needs to be in-depth and directly linked to your enquiry
There must be recognition of where data analysis was less successful due to the enquiry design or technique used
Are the outcomes reliable – can the study be repeated and obtain the same results?
Conclusion
-
Once the data collected has been analysed, conclusions can be reached
-
This should state whether the hypothesis has been proved or disproved
-
Identify and explain anomalies such as:
- recent rockfall making the sample size larger
- taking a sample from a protected area or near a groyne
- the result of incorrect recording or human error reading equipment
Evaluation
-
The final stage of the coastal enquiry is the evaluation, where you note how successful, or not, the coastal investigation was and what you would do differently next time
- Next time I would take measurements over a longer period of time to ensure reliability of data...
- My equipment failed, and I would make sure to bring a spare next time...
- I think my investigation went well, and I would like to repeat this after a storm event to see how much erosion has taken place...
Exam Hint The 8-mark fieldwork question is often an evaluation of your enquiry or unfamiliar fieldwork. The evaluation could be regarding data collection, analysis or your conclusion. The key factors to remember to include in your answer are:
- What went well? How do you know that your results were accurate and therefore valid?
- Is the enquiry reliable – could it be repeated and the same results achieved?
- What could have been improved?
- What would you do if you were to repeat the enquiry?
Was this revision note helpful?