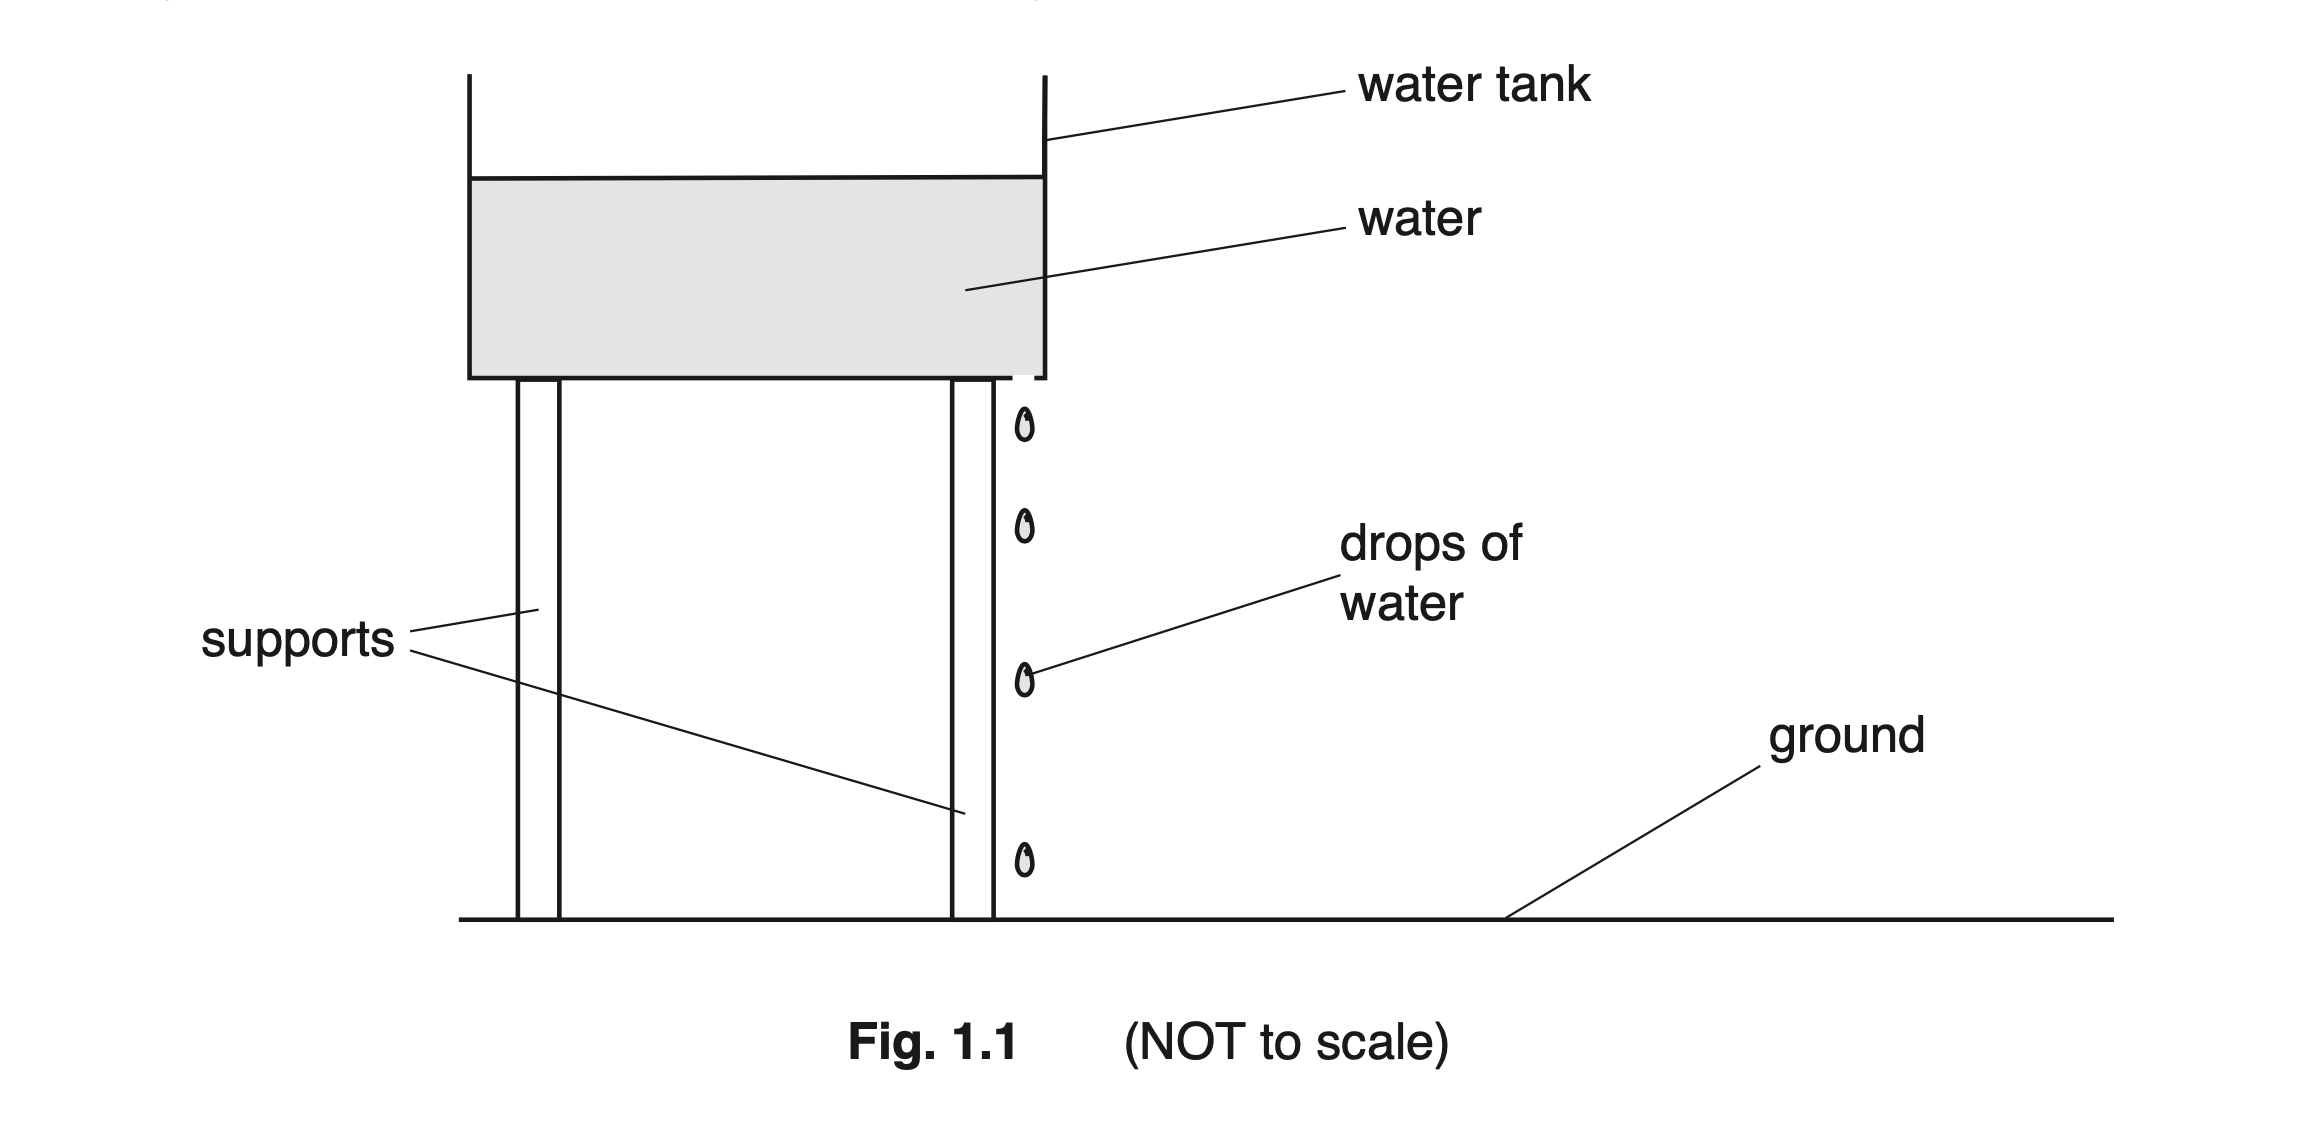
During a training flight, a fighter jet travelling at 300 m/s makes a turn to avoid bad weather.
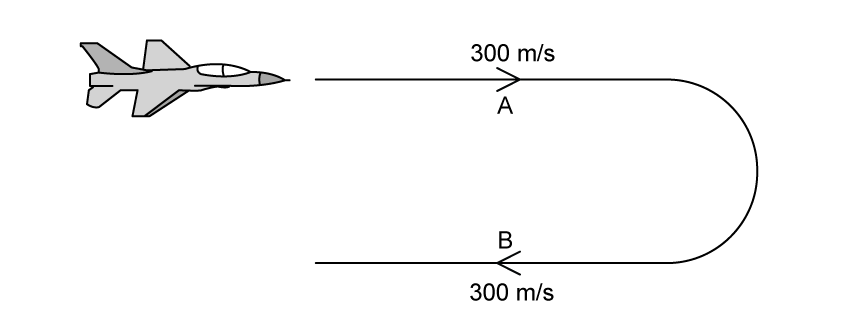
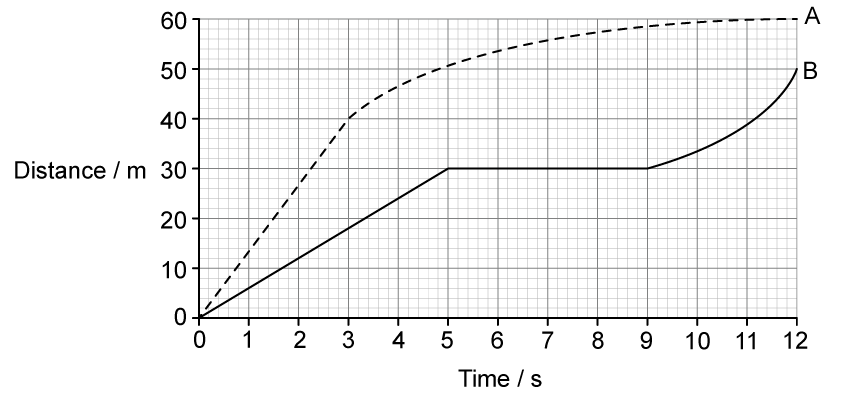
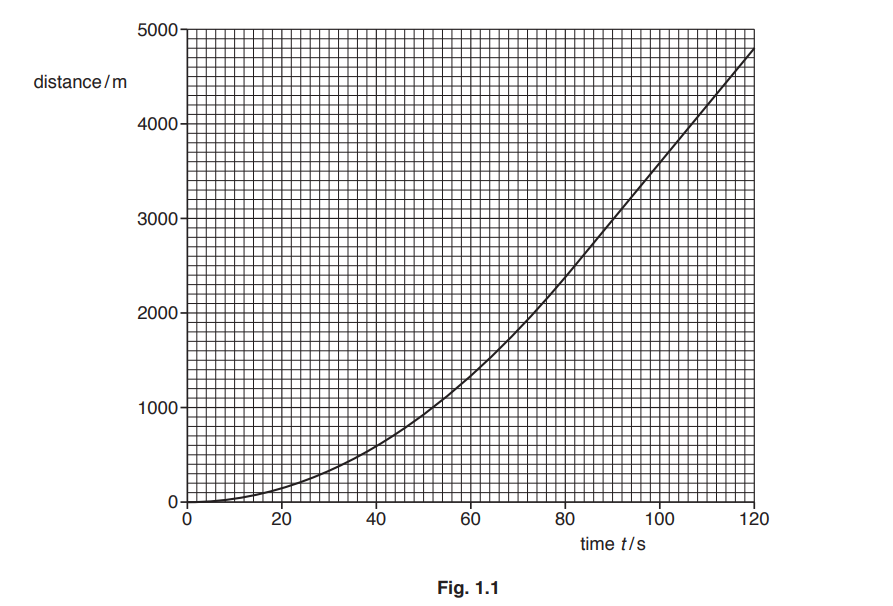
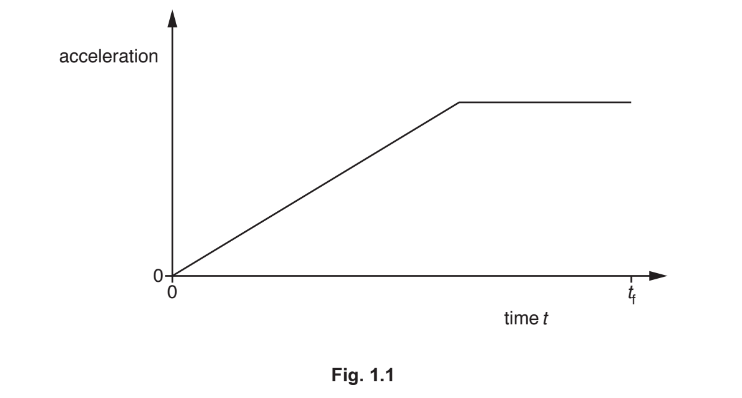
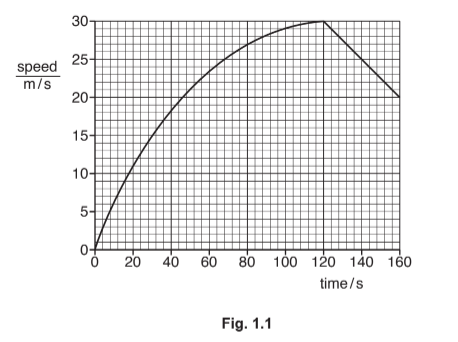
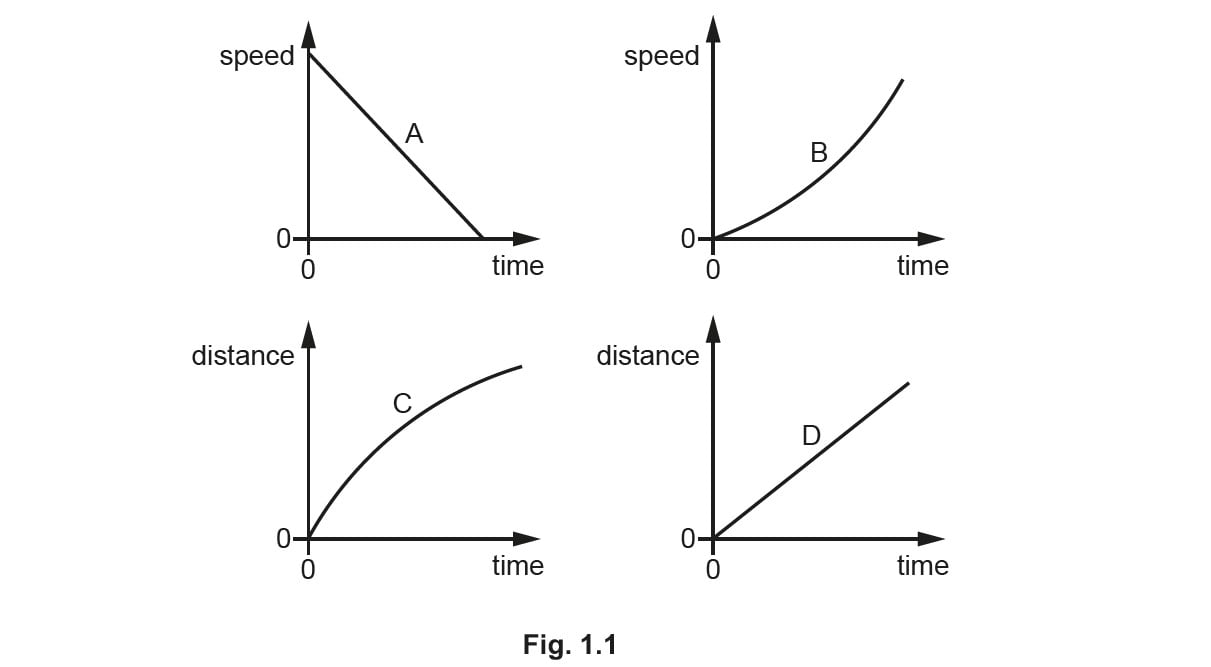
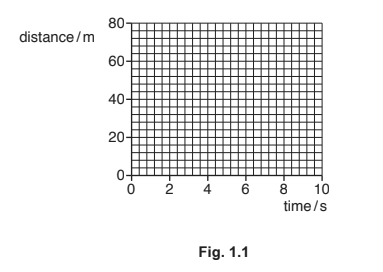
Fig. 1.1
Compare the speed and velocity between points A and B in Fig. 1.1.
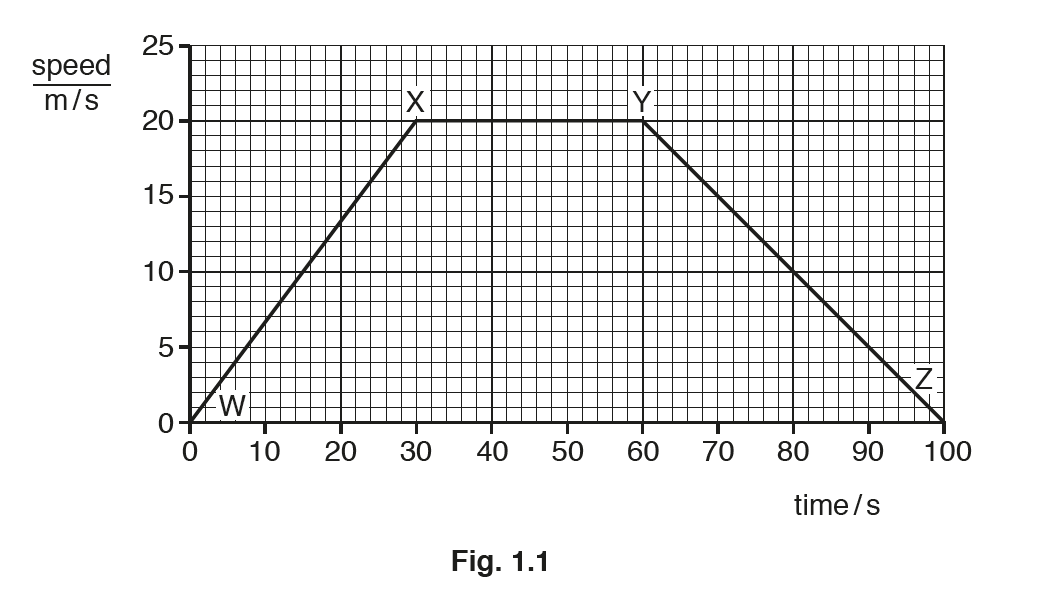
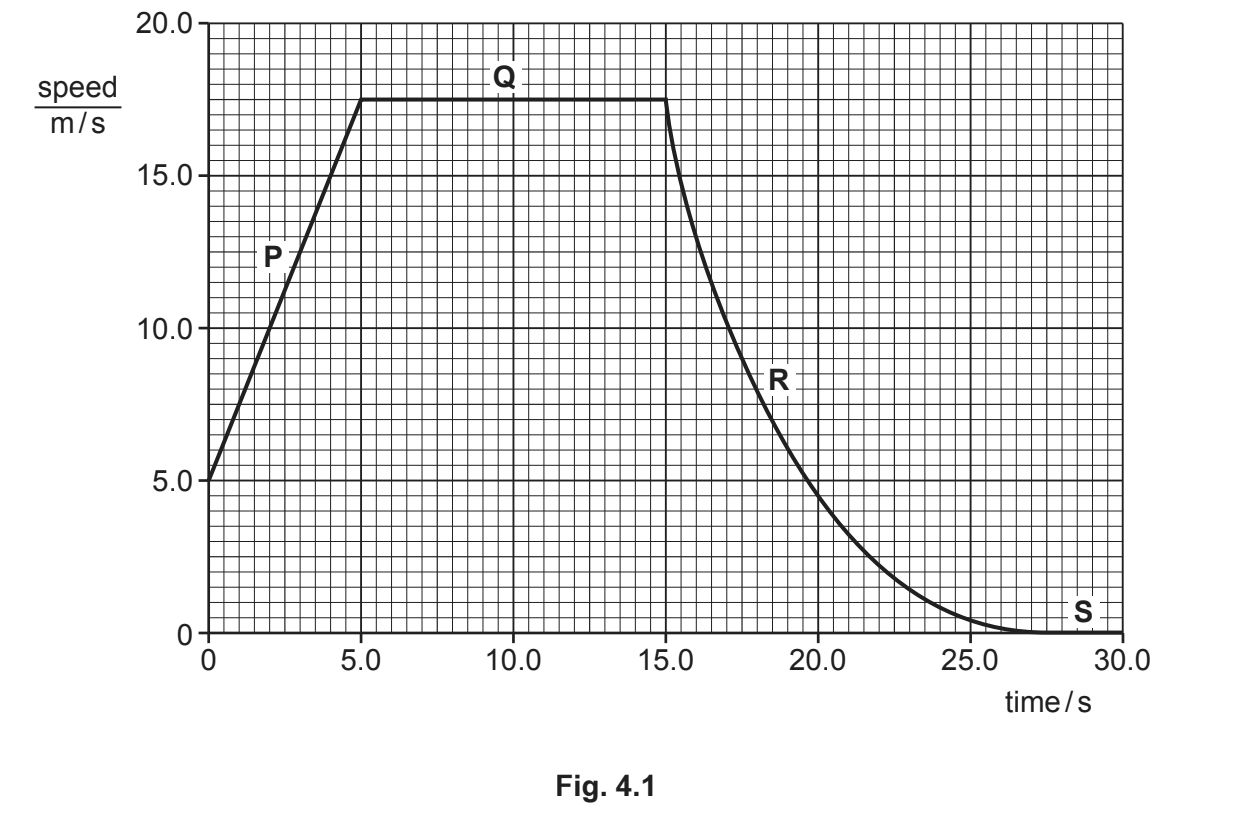
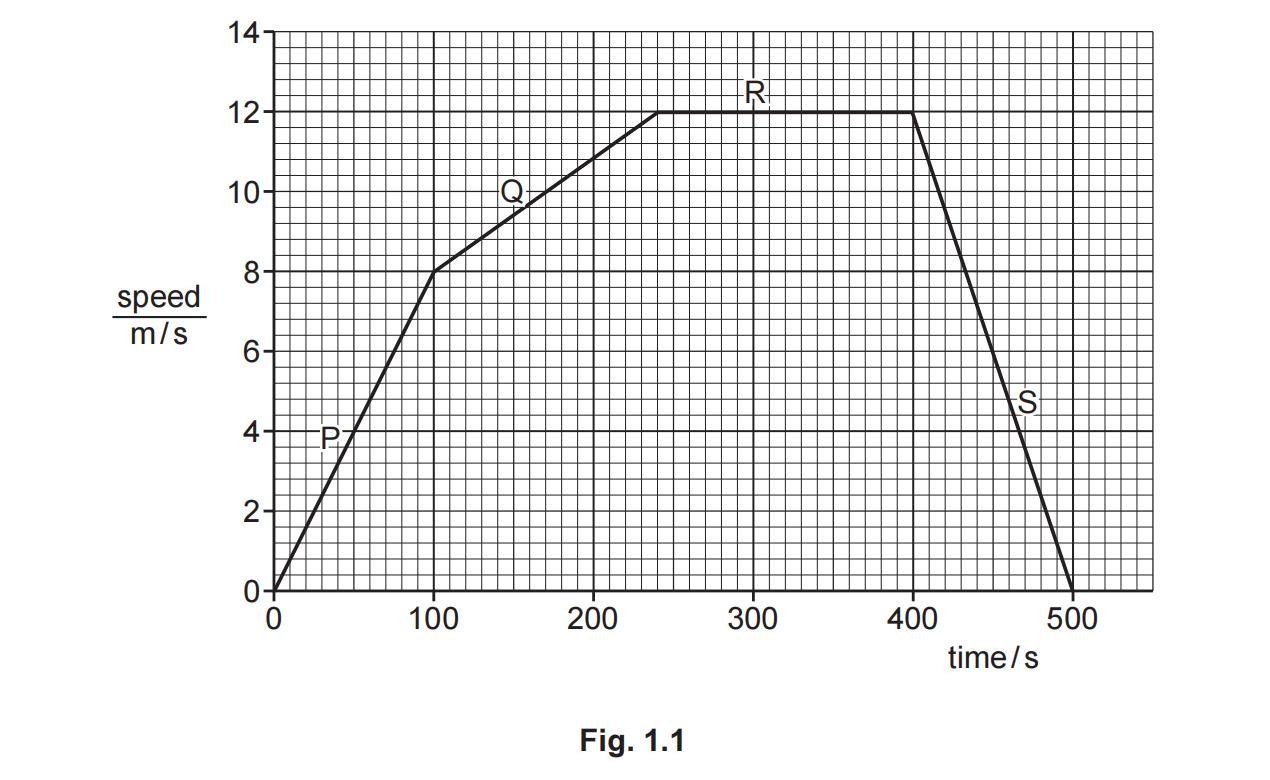
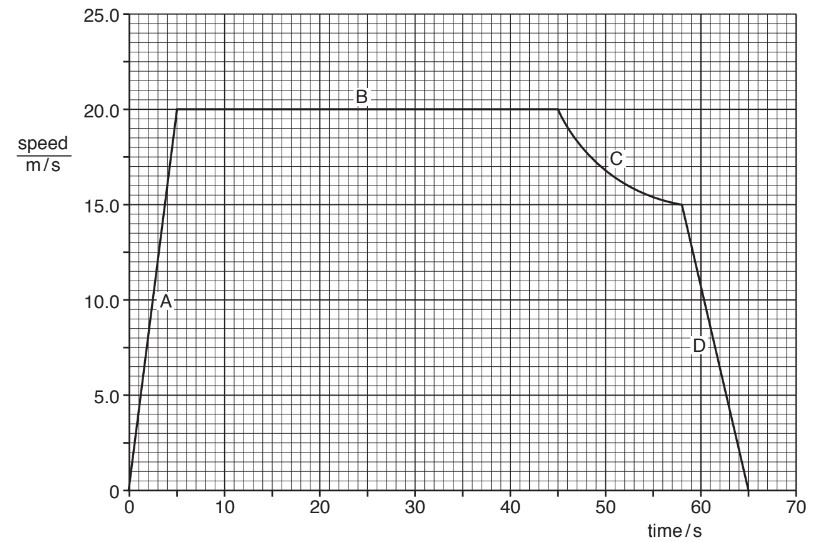
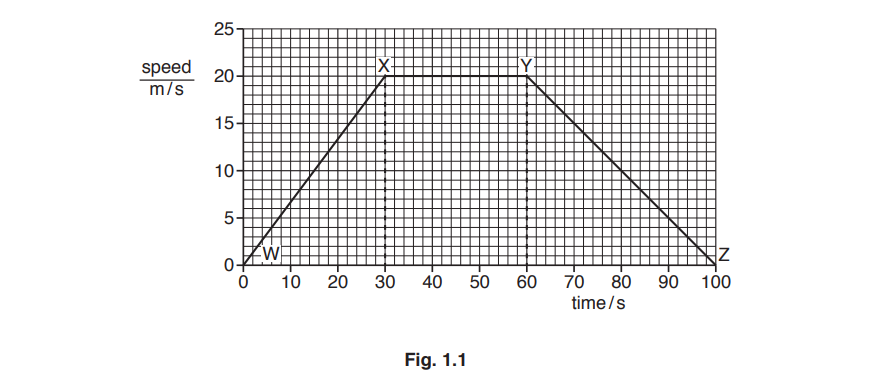
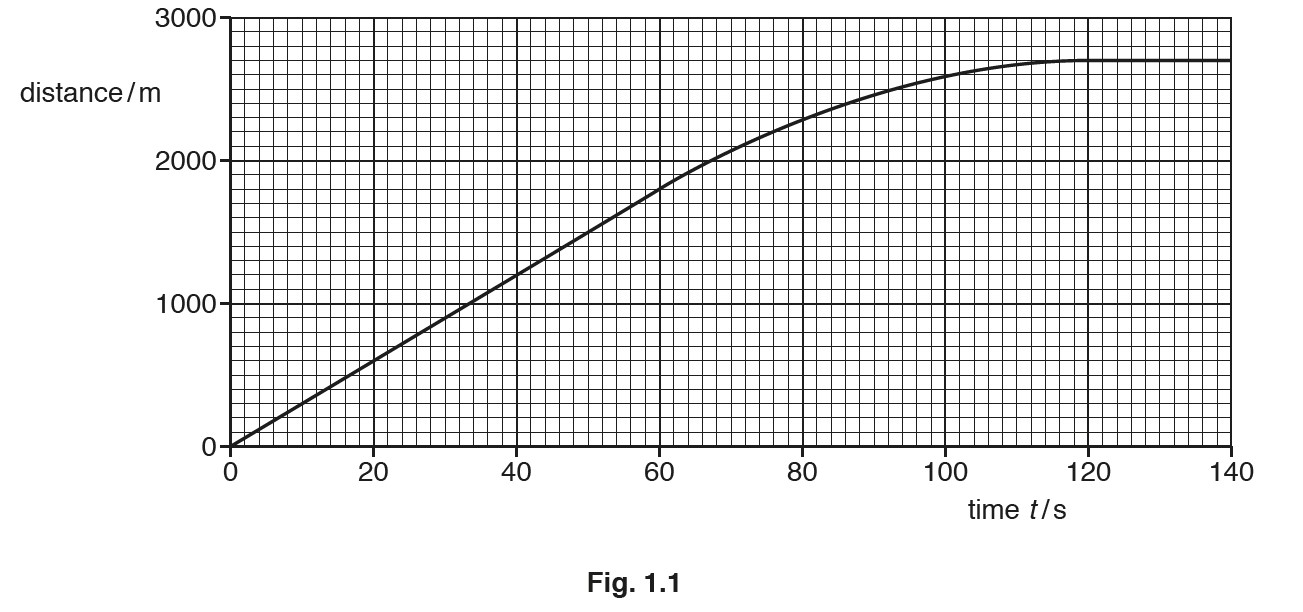
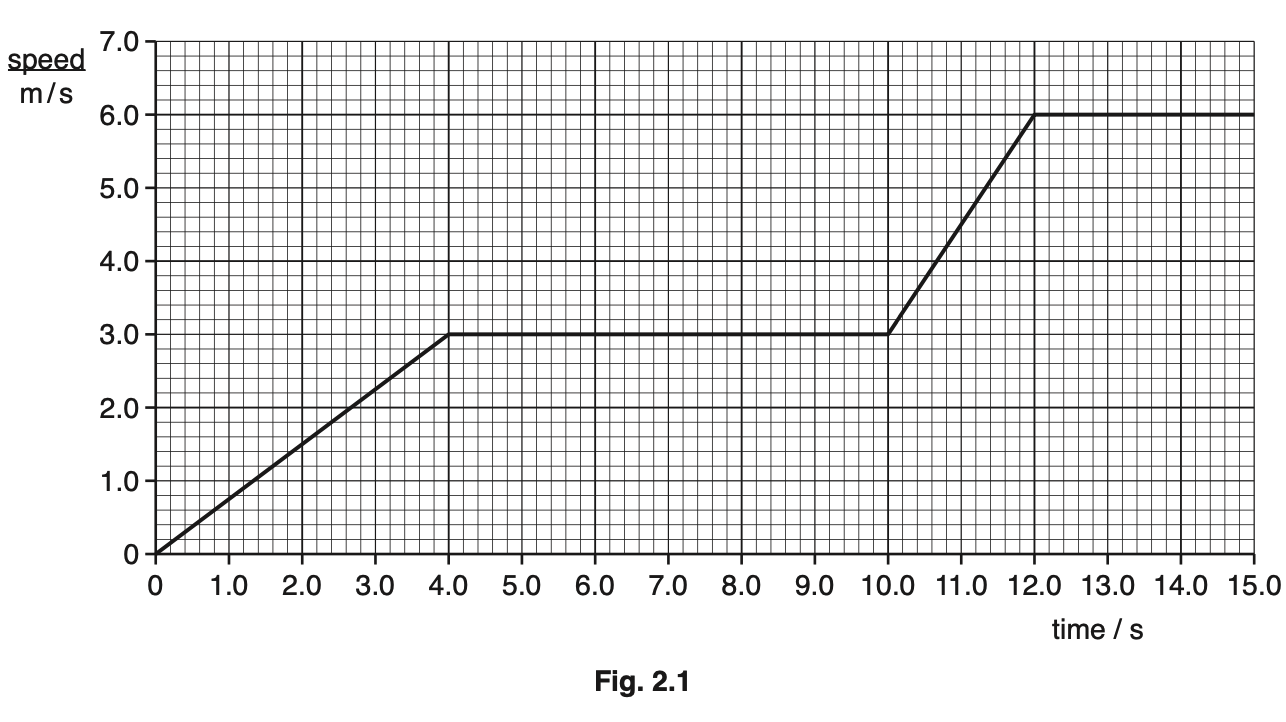
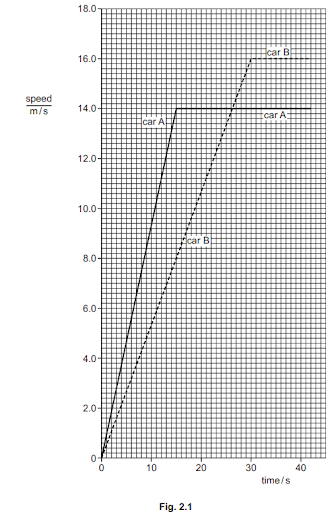
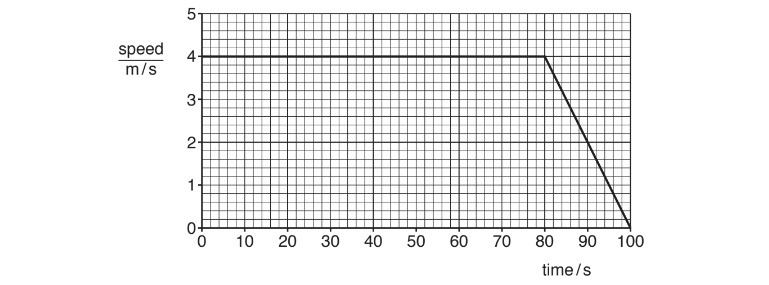
The speed-time graph of a different test flight is presented to an analyst.
State how she uses the graph to determine the distance travelled during the test flight.
Extract:
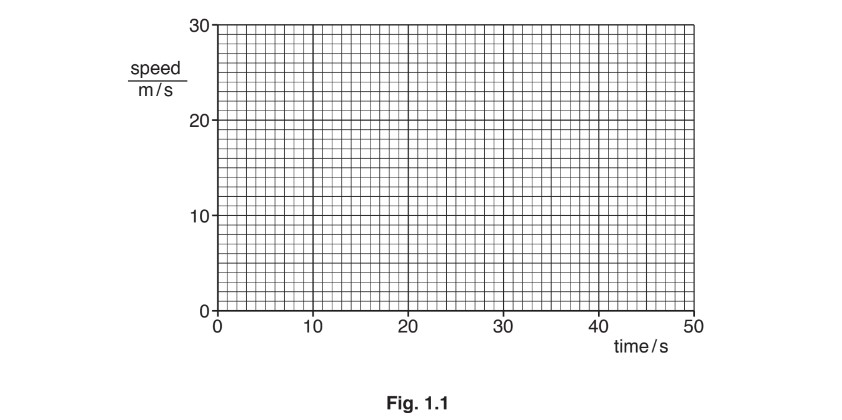
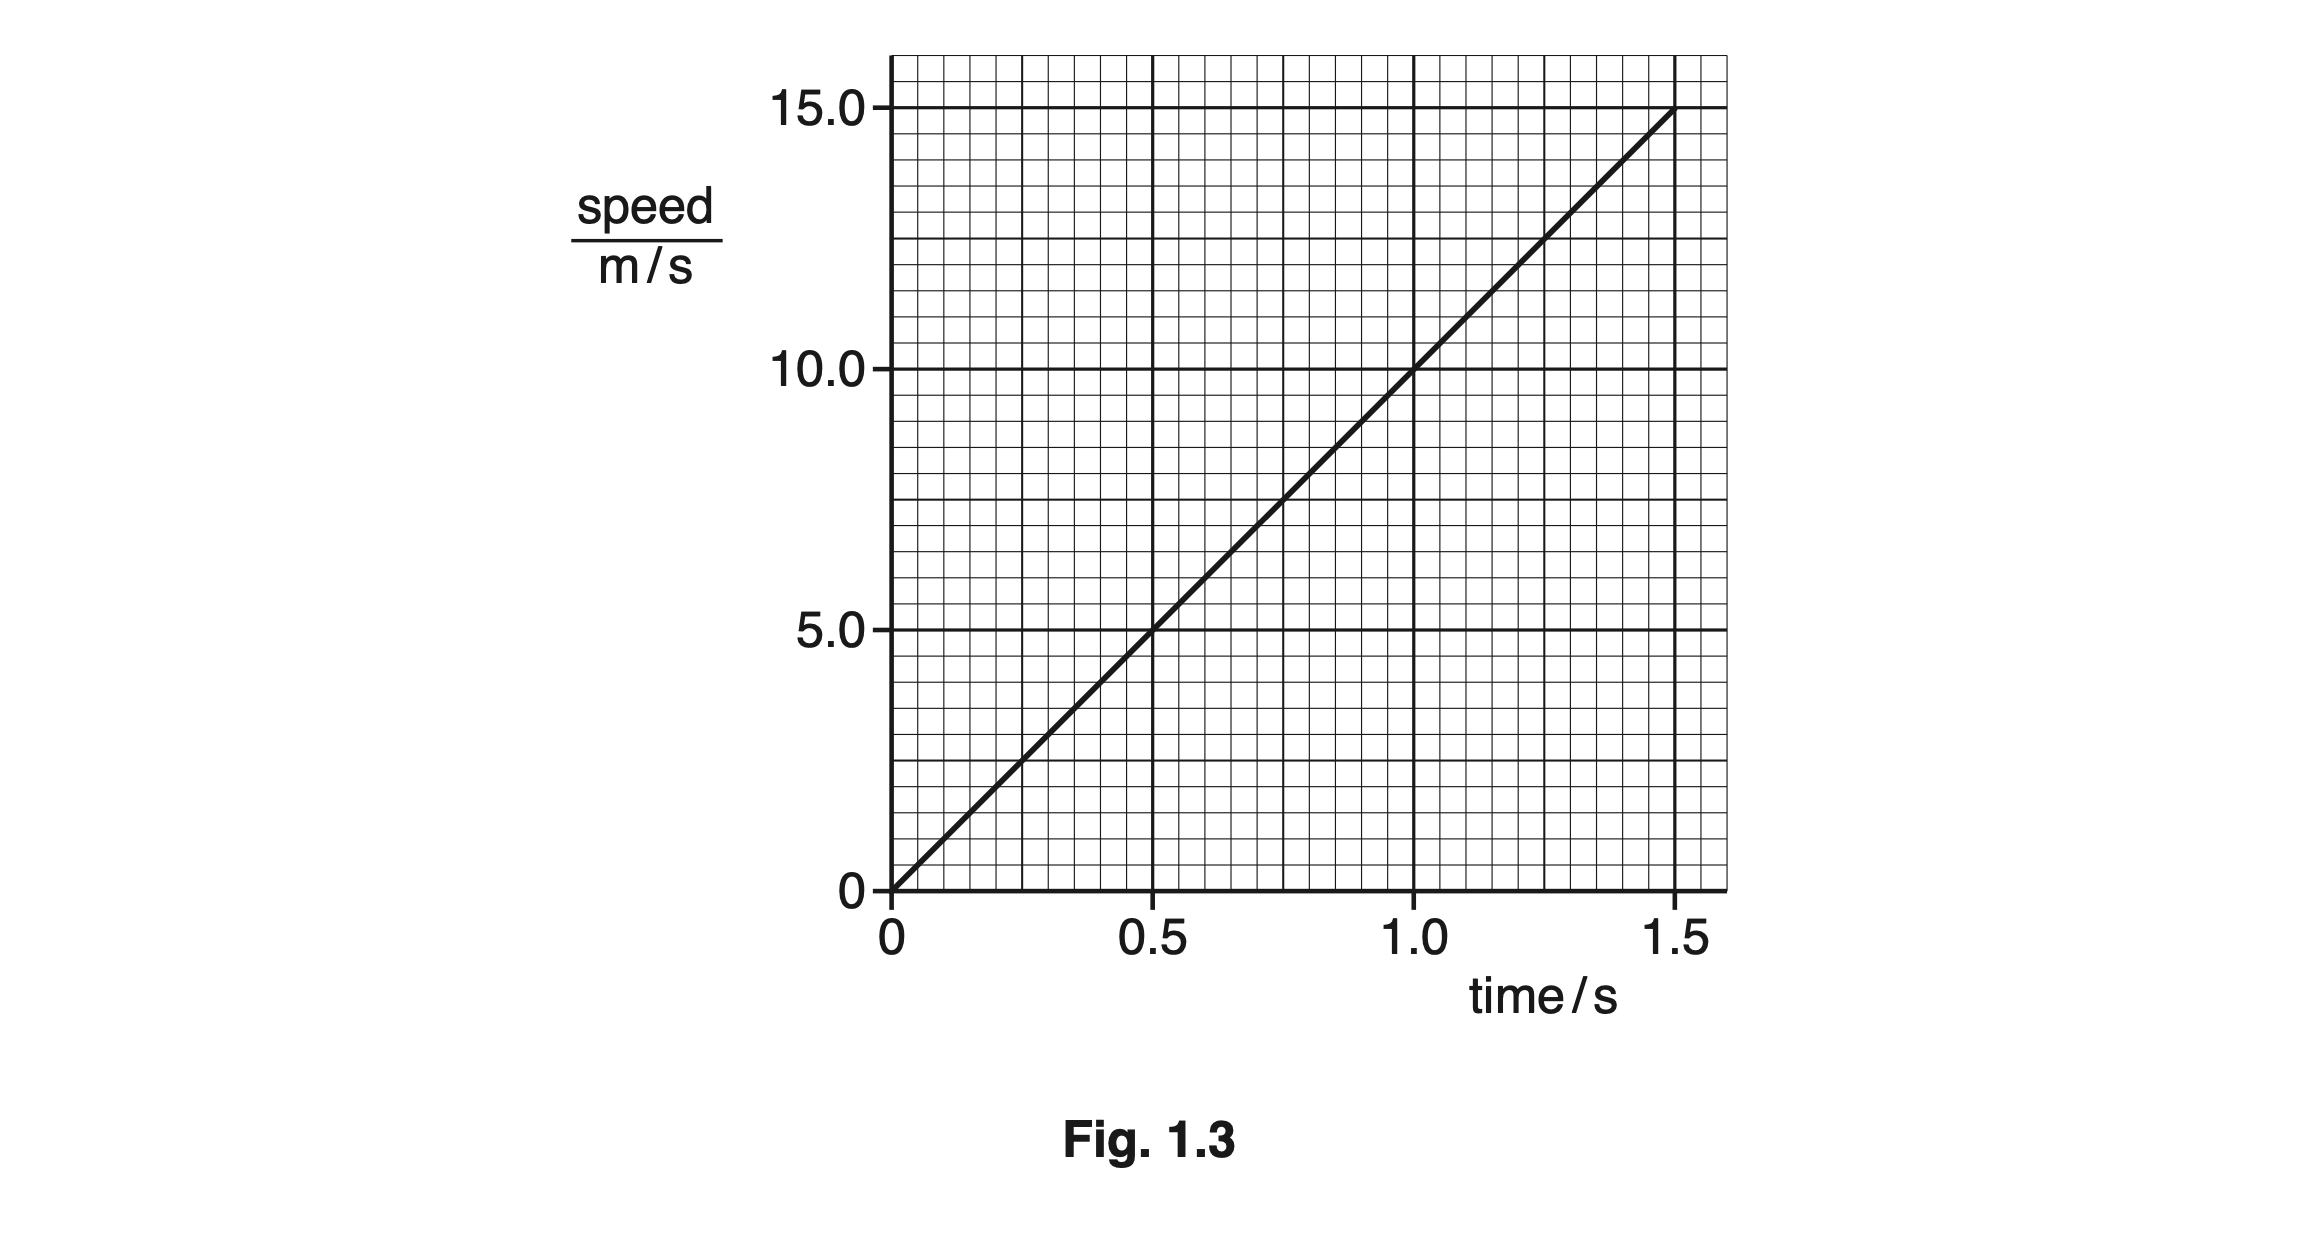
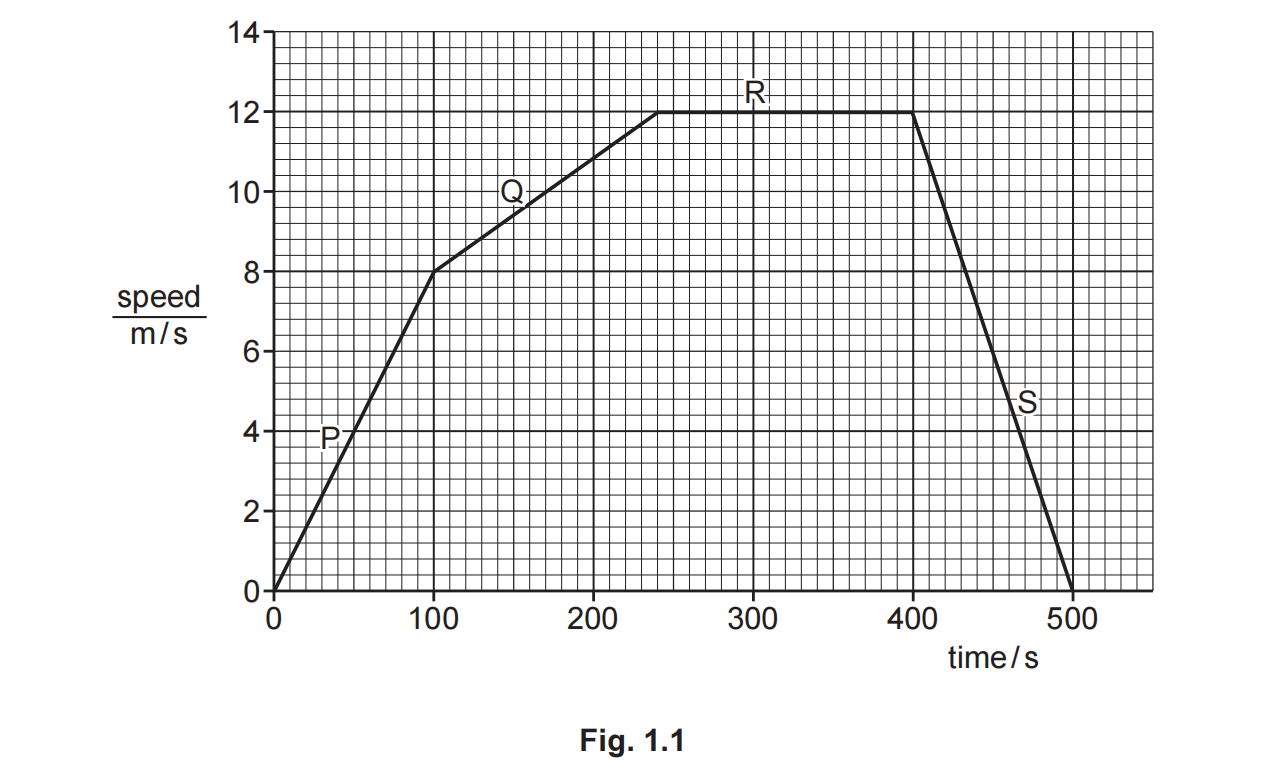
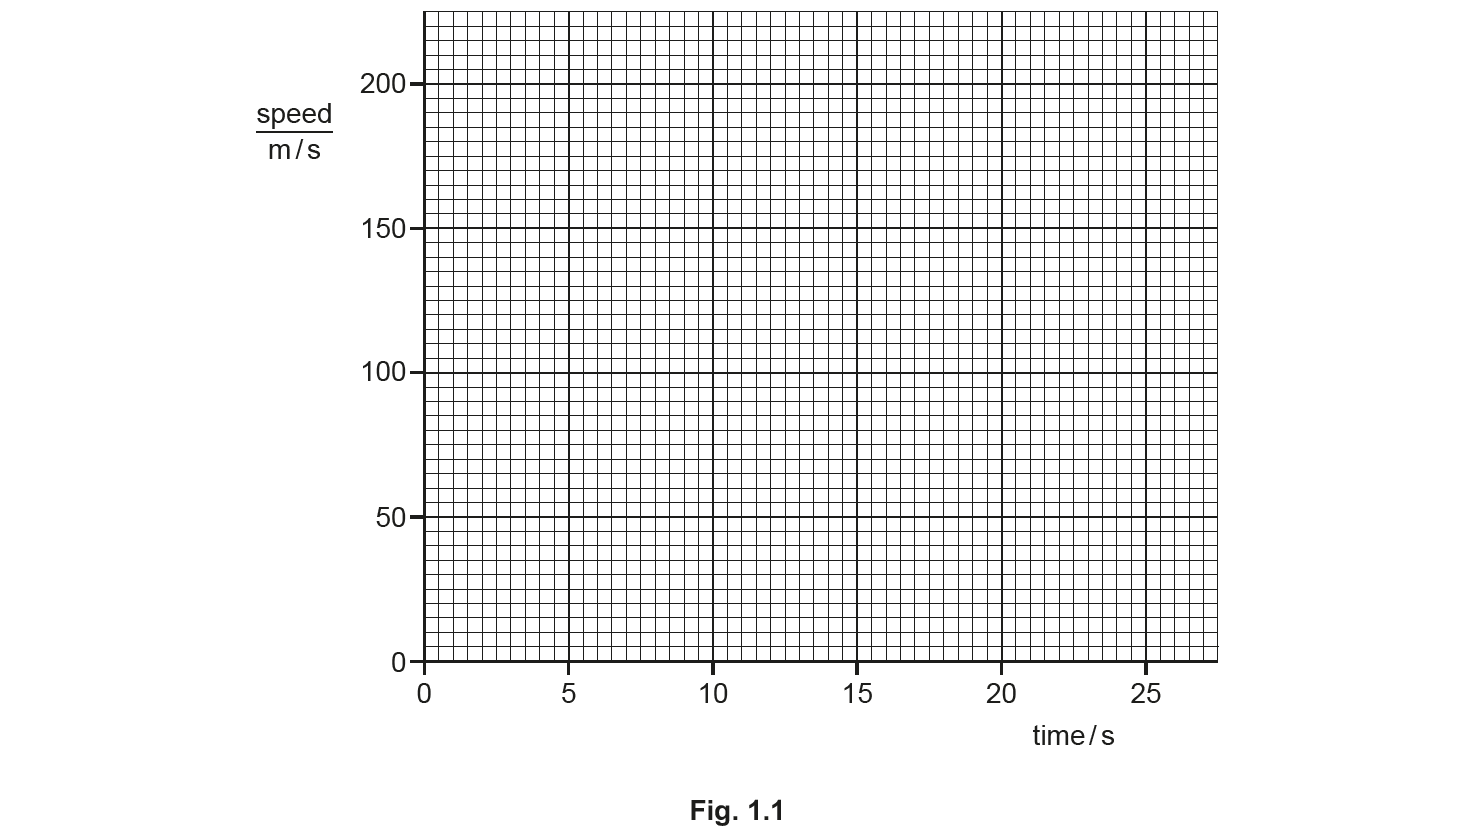
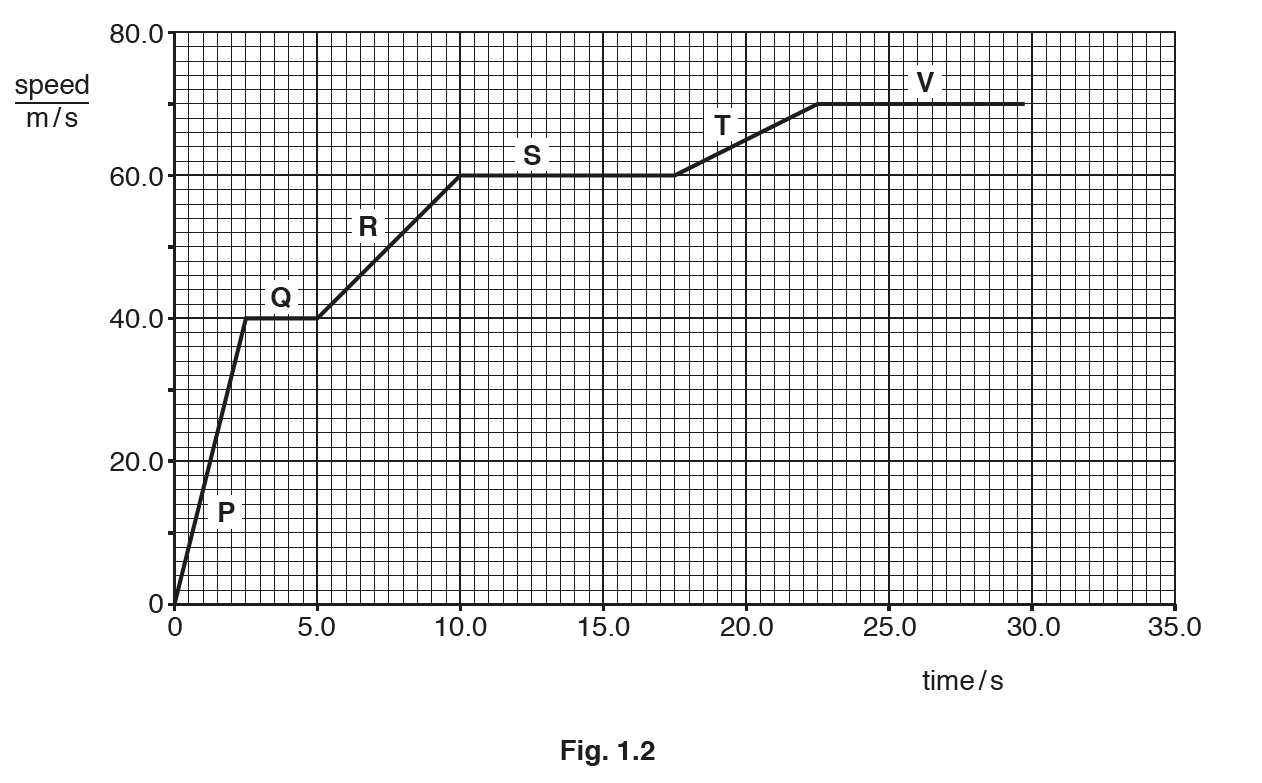
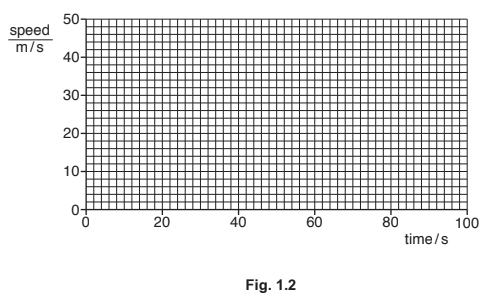
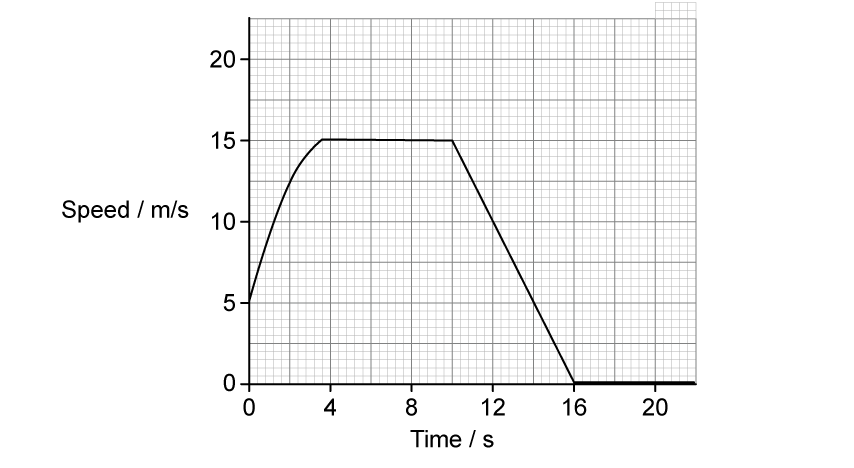
The speed-time graph for the initial part of the fighter jet's test flight is shown in Fig 1.2:
(i) State the length of time for which the jet is travelling at constant speed.
Speed is constant between 200 s and 40 s (The jet is travelling at a constant speed for 200 – 40 =) 160 s
(ii) Calculate the distance covered by the jet during this time.
rectangle area = height × width distance = 350 × 160 distance = 56 000 m
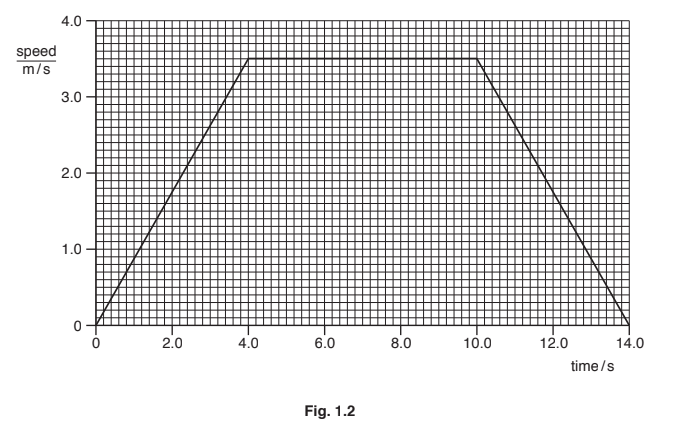
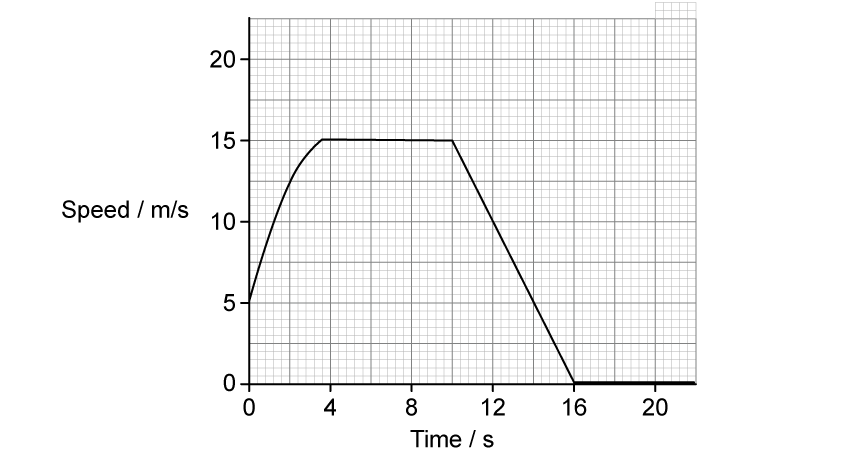
The speed-time graph for the initial part of the fighter jet's test flight is shown in Fig 1.2:
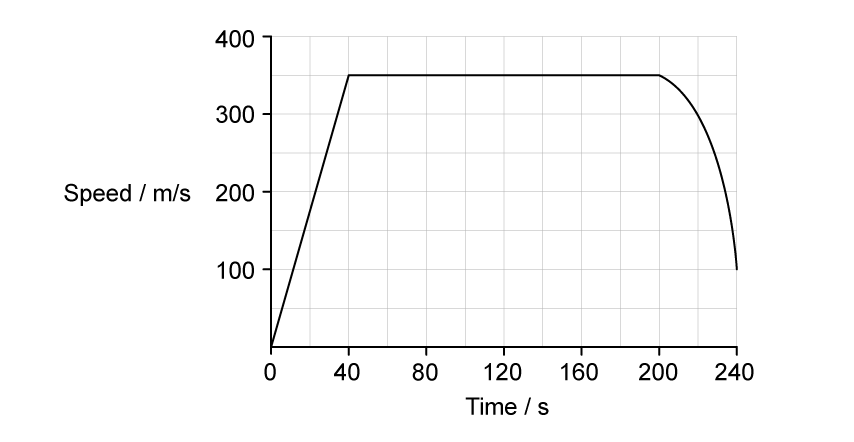
Fig. 1.2
(i) State the length of time for which the jet is travelling at constant speed.
(1 mark)
(ii) Calculate the distance covered by the jet during this time.
(2 marks)
Extended tier only
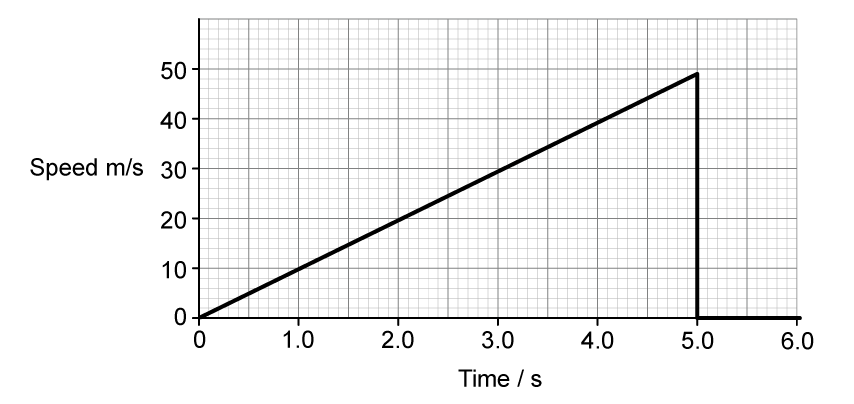
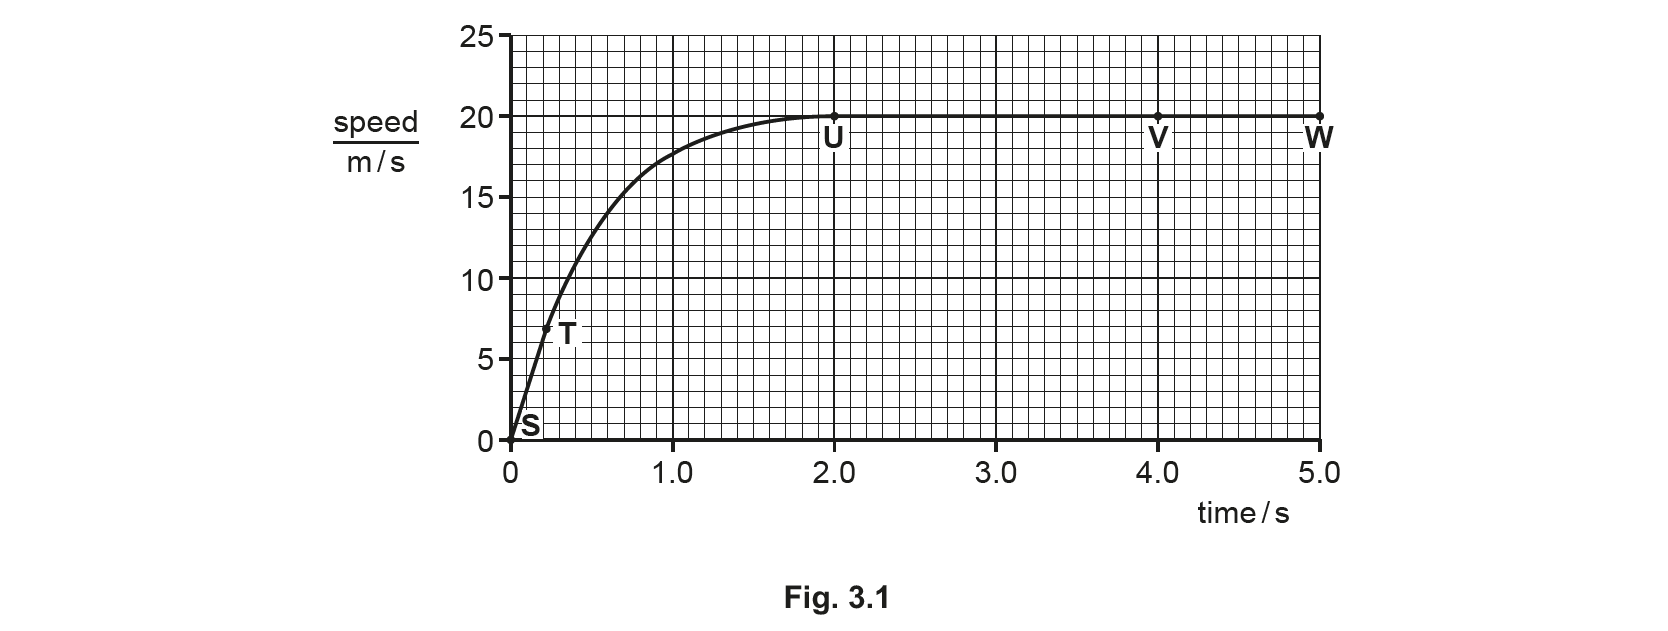
For a brief time, the engine cuts out and the jet is in free fall.
Describe the shape and the gradient of the speed-time graph during this time.