Demand, Price & Quantity (Cambridge International IGCSE Economics)
Introduction to Demand
Spec point —
2.3.1· Definition, drawing and interpretation of appropriate diagrams. The link between individual and market demand in terms of aggregation.
Introduction to Demand
-
Demand is the amount of a good/service that a consumer is willing and able to purchase at a given price in a given time period
- If a consumer is willing to purchase a good, but cannot afford to, it is not effective demand
-
A demand curve is a graphical representation of the price and quantity demanded (QD) by consumers
- If data were plotted, it would be an actual curve. Economists, however, use straight lines so as to make analysis easier
Individual and market demand
-
Market demand is the combination of all the individual demand for a good/service
- It is calculated by adding up the individual demand at each price level
The Monthly Market Demand for Newspapers in a Small Village
| Customer 1 | Customer 2 | Customer 3 | Customer 4 | Market Demand |
|---|---|---|---|---|
| 30 | 15 | 4 | 4 | 53 |
- Individual and market demand can also be represented graphically
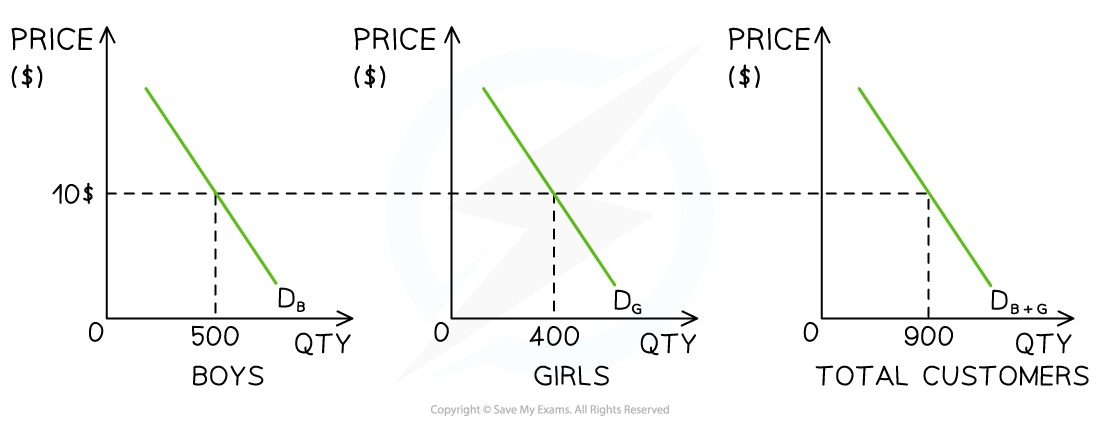
Market demand for children's swimwear in July is the combination of boys and girls demand
Diagram analysis
- A shop sells both boys and girls swimwear
- In July, at a price of $10, the demand for boys swimwear is 500 units and girls is 400 units
- At a price of $10, the shops market demand during July is 900 units
Movements Along a Demand Curve
Spec point —
2.3.1· A demand curve to be drawn and used to illustrate movements along a demand curve with appropriate terminology, for example extensions and contractions in demand.
-
If price is the only factor that changes (ceteris paribus), there will be a change in the quantity demanded (QD)
- This change is shown by a movement along the demand curve
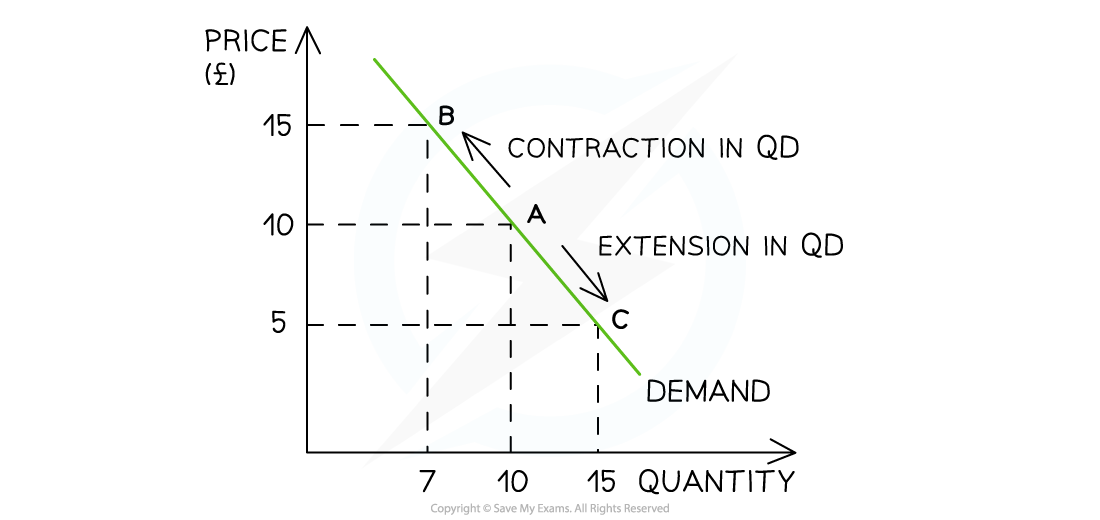
A demand curve showing a contraction in quantity demanded (QD) as prices increase and an extension in quantity demanded (QD) as prices decrease
Diagram analysis
-
An increase in price from £10 to £15 leads to a movement up the demand curve from point A to B
- Due to the increase in price, the QD has fallen from 10 to 7 units
- This movement is called a contraction in QD
-
A decrease in price from £10 to £5 leads to a movement down the demand curve from point A to point C
- Due to the decrease in price, the QD has increased from 10 to 15 units
- This movement is called an extension in QD
-
The law of demand captures this fundamental relationship between price and QD
-
It states that there is an inverse relationship between price and QD
- When the price rises the QD falls
- When prices fall the QD rises
-
Was this revision note helpful?
Build on this topic