Infrared Spectroscopy (Cambridge International AS Chemistry)
Interpreting Infrared Spectra
Interpreting IR Spectra
-
Infrared (IR) spectroscopy is a technique used to identify compounds
- It works by measuring how covalent bonds in molecules absorb infrared radiation
- This absorption causes the bonds to vibrate in specific ways
-
A spectrophotometer irradiates the sample with infrared waves
- Then, it detects how much radiation is absorbed at each frequency
- The resulting spectrum shows which types of bonds are present
Bond vibrations and absorption
- All covalent bonds behave like tiny springs rather than rigid bars
- Like springs, they can vibrate in different ways, such as stretching and bending
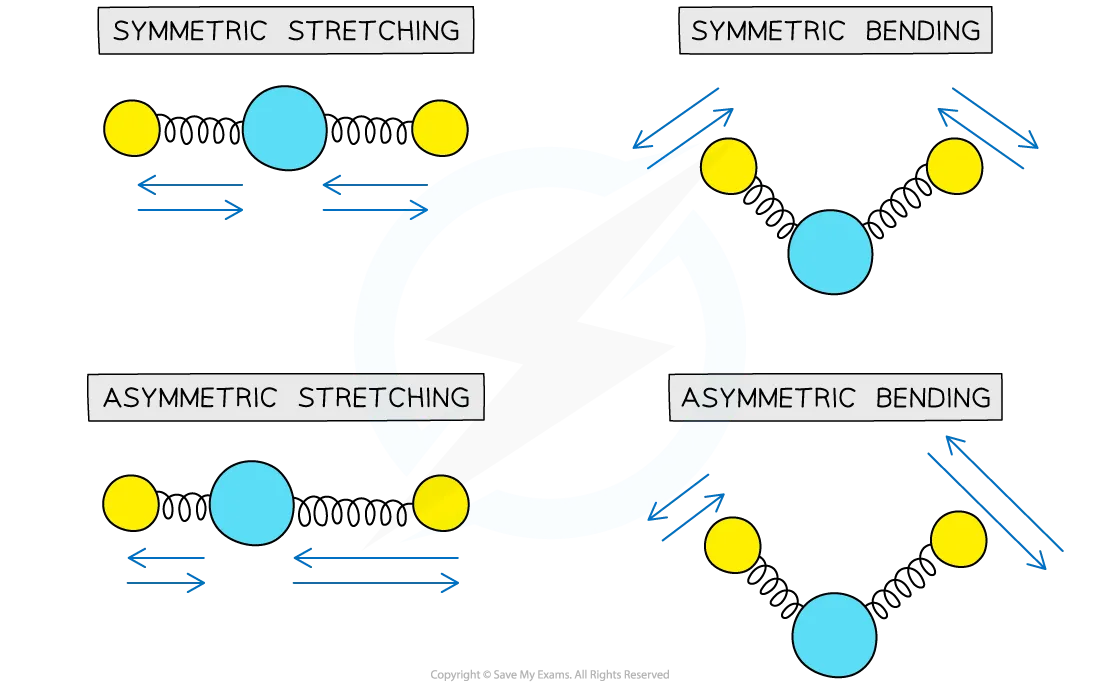
Different modes of vibration in molecules. Each mode has a characteristic frequency of vibration
- These vibrations occur at specific frequencies in the infrared (IR) region of the electromagnetic spectrum
- When IR radiation matches a bond’s natural frequency, the bond absorbs energy and vibrates more strongly
- Each vibration mode (e.g. symmetric stretch, bending) has its own characteristic frequency
- These absorbed frequencies are expressed as wavenumbers (cm⁻¹), which are the reciprocal of wavelength
Absorption patterns and functional groups
-
Each organic compound has a unique IR spectrum
- Particularly in the region below 1500 cm⁻¹, known as the fingerprint region
-
This region contains many small peaks caused by complex bond vibrations that are difficult to assign to specific groups
-
However, comparing the fingerprint region to spectra from a database allows exact identification of a compound
-
This is useful, for example, for identifying a particular isomer in a homologous series
- They will all have the same functional groups but different fingerprint regions
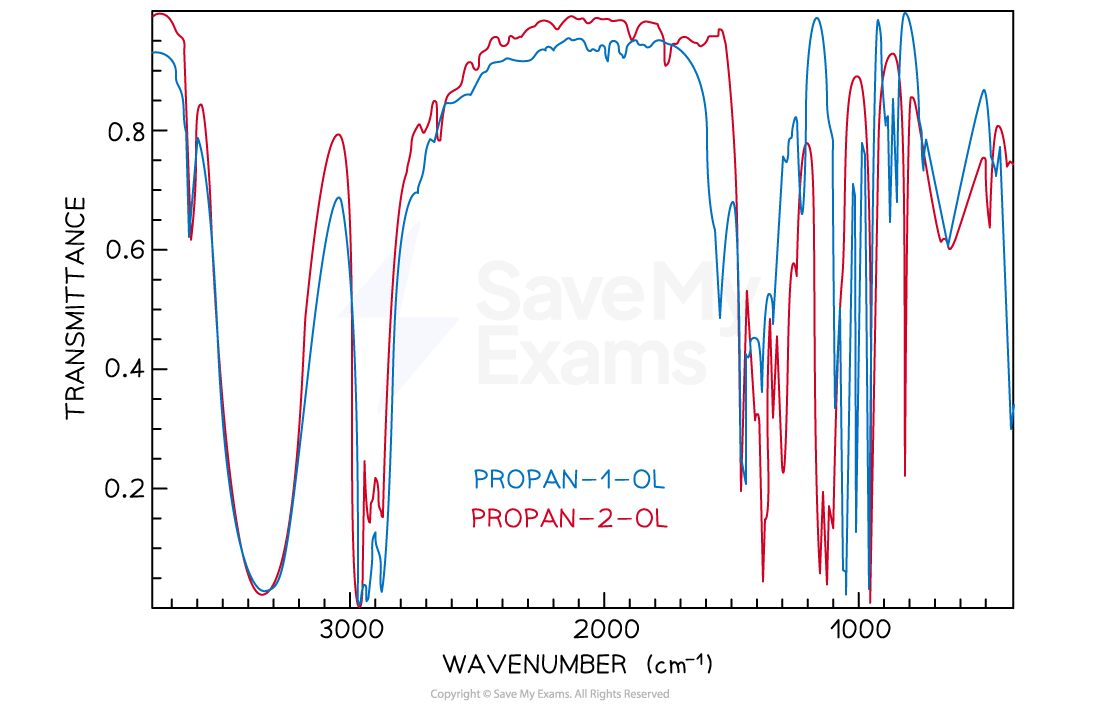
The superimposed spectra of propan-1-ol and propan-2-ol show the same bonds above 1500 cm-1 but different fingerprint regions
-
Each bond type absorbs within a characteristic wavenumber range
-
Absorptions vary in width (broad or sharp) and intensity (strong or weak)
-
For example:
- O–H bonds in alcohols and carboxylic acids give broad peaks due to hydrogen bonding
- C=O bonds in carbonyl compounds give sharp, strong peaks.
-
Comparing an unknown IR spectrum with data for known compounds helps identify functional groups
Absorption range of bonds table
| Bond | Functional groups containing the bond | Characteristic infrared absorption range (in wavenumbers) / cm-1 |
|---|---|---|
| C-O | Hydroxy, ester | 1040 - 1300 |
| C=C | Aromatic compound, alkene | 1500 - 1680 |
| C=O | Amide Carbonyl, carboxyl Ester | 1640 - 1690 1670 - 1740 1710 - 1750 |
| CN | Nitrile | 2200 - 2250 |
| C–H | Alkane | 2850 - 2950 |
| N–H | Amine, amide | 3300 - 3500 |
| O–H | Carboxyl Hydroxyl | 2500 - 3000 3200 - 3600 |
- Due to some absorption bands overlapping each other, other analytical techniques such as mass spectrometry should be used alongside IR spectroscopy to identify an unknown compound
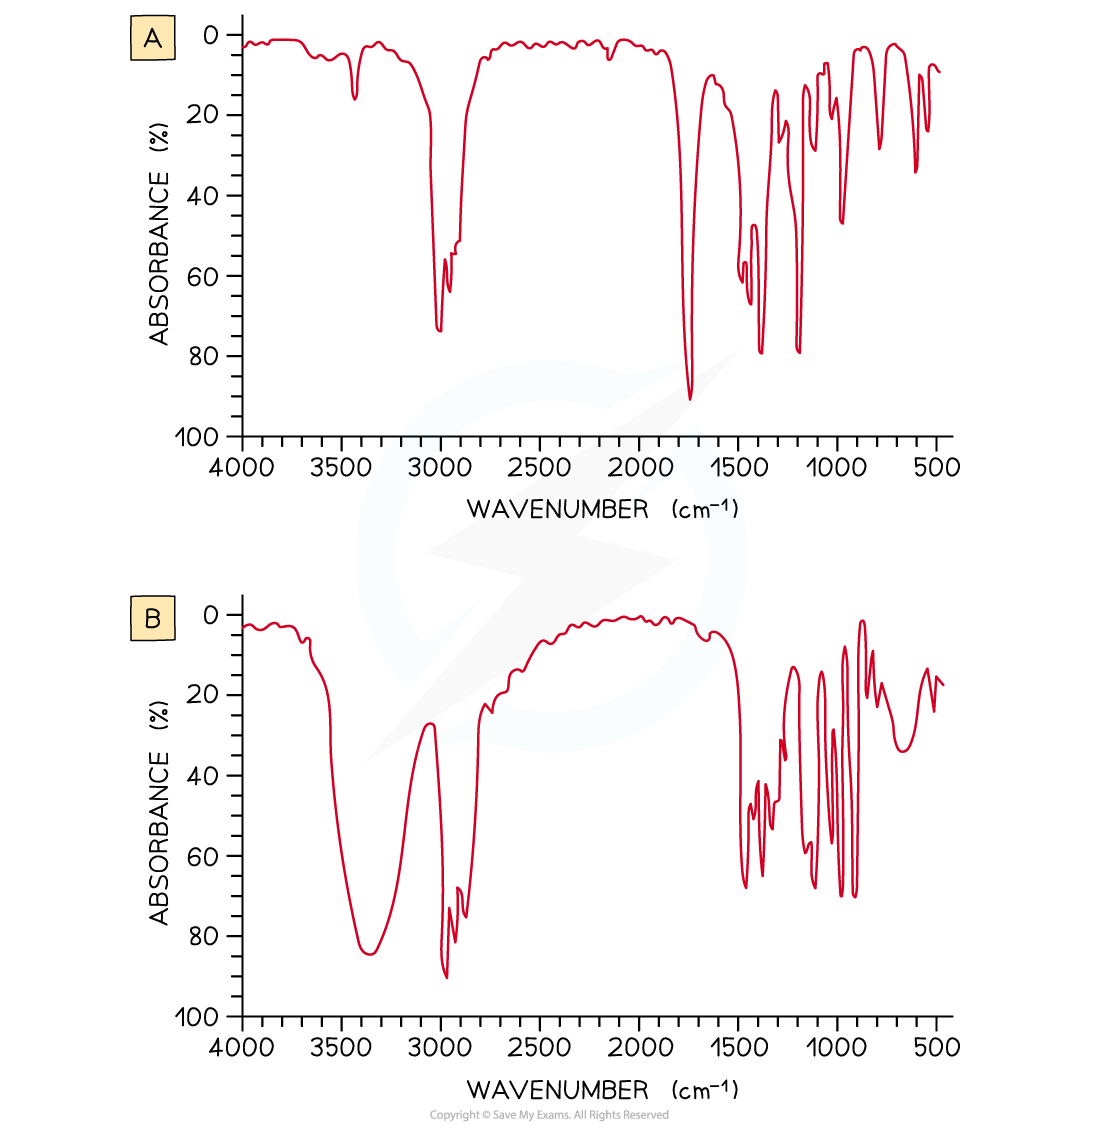
Worked Example Look at the two infrared spectra below and determine which one corresponds to propanone and which one to propan-2-ol.
Answer:
- IR spectrum A is propanone and spectrum B is propan-2-ol.
- In IR spectrum A the presence of a strong, sharp absorption at about 1700-1750 cm-1 corresponds to the characteristic C=O, carbonyl, group in a ketone.
- In spectrum B the presence of a strong, broad absorption around 3200-3500 cm-1 suggests that there is an alcohol group present, which corresponds to the -OH group in propan-2-ol.
Was this revision note helpful?
Build on this topic