Invertibles
Excerpt: Pair up the functions so that each one is with its inverse function; match the pairs of functions with graphs and sketch in the missing curves.
Problem
- Put these functions in pairs – each one with its inverse. One function is missing so you’ll need to fill in the blank card.
- Pull down the bottom edge of the card sort area to reveal the graphs of some of the functions. Match up the functions with their graphs and draw in the graphs of their inverse functions.
,
,
,
,
,
(\ )
,
,
,
,
,
,
,
Now try these
Solution
Put these functions in pairs – each one with its inverse. One function is missing so you’ll need to fill in the blank card.
Three of the first set of functions are quadratics in completed square form and four involve square roots. We noticed that functions and are simpler than the others so we looked at those first.
,
,
To find the inverse of , we rearrange the equation to make the subject. To resolve the ambiguity, note that the definition of specifies the domain . So we must require the positive square root. The function is defined for all positive values of so can take any value greater than or equal to .
So now changing the input from to we have the inverse function, defined on the domain . This is the same as and we can say that is the inverse of .
For more about the process of finding inverses, see Making inverse functions.
What would the inverse function be if instead we had defined only for ?
Alternatively, we could verify that and are inverses by evaluating their composition. This almost confirms it, but we have to think a bit harder to make sure the domains are correct. For what values of is defined?
For them to be a pair of inverse functions we also require that over a suitable domain.
What are the ranges of and ? How are the domains and ranges of the two functions related?
The graph of will be a parabola with vertex at but restricted to being positive. There is no such graph on the sheet.
The graph of is a positive square-root graph starting at . This is on graph (2), so we can sketch in the graph of on the same axes.
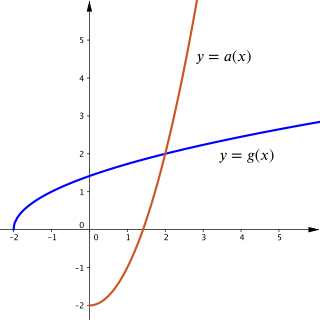
Graphs
Having had to think about the domains, we next noticed that and differ only in their domains…
,
,
,
,
Rearranging we have but so we need the positive square root here, and as increases from , increases from . Hence we have which matches function .
Similarly, rearranging
but for
we have
so
You might have expected a difference only in the domains to result in the inverses differing only in their ranges. But instead we have different functions.
The graph of appears on graph (1) and is on graph (4).
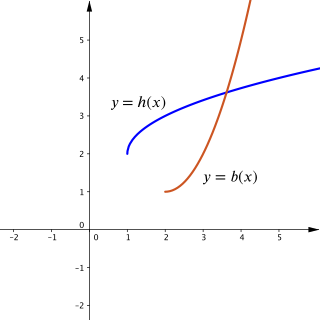
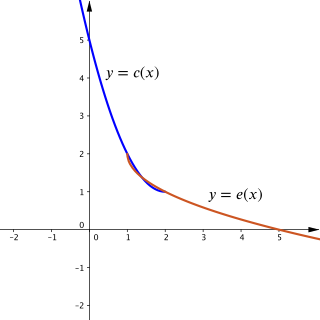
What do you notice about the pairs of graphs?
Graphs
,
(\ )
Rearranging we have which means that
To find the domain of , consider that as increases from , increases from . So the inverse function will be defined only for . Hence is paired with
The graph of appears on graph (3).
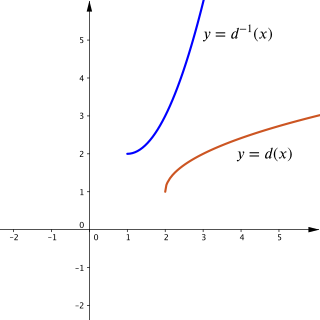
Graphs
The second set are all rational functions. The only one that looks different is but it is hard to predict how any of them behave without doing some work, so we started with .
,
,
To find the inverse of
we want to rearrange its equation to make
the subject. Here are two different ways of doing that.
And so we have the inverse function,
We get to the same result, but you might find the second method and equations and more informative when it comes to sketching the graphs.
In each case the domain is specified to exclude the value of where the fraction is undefined.
Equation indicates that the graph of is a hyperbola turned upside down and translated left by and up by . It appears on graph (6).
We have so its graph is an upside down hyperbola translated right and down.
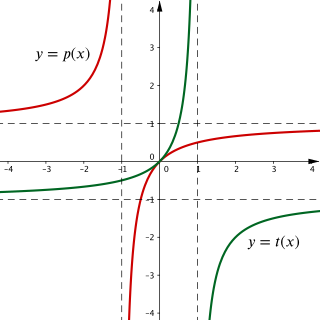
Graphs
,
,
Rewriting and rearranging as above, we have
and so
The functions
and
are identical which means that this is a
.
What does this imply about the composition or ?
The graph of is a hyperbola translated left by and down by . It appears on graph (5).
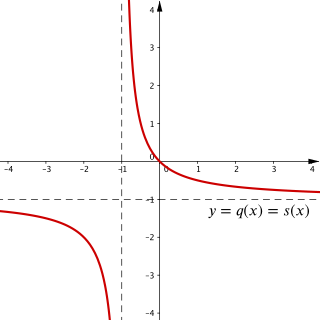
The previous graphs have shown paired functions as reflections of one another. What has happened to this pair?
Graphs
,
As before we have
The graph of does not appear, but is a hyperbola translated right by and down by . It appears on graph (7).
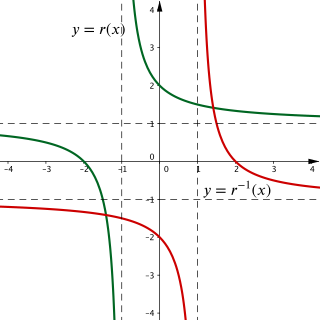
Graphs
Things you might have noticed
- In each case, the graphs of a function and its inverse are mirror images of one another in the line .
- The graphs of self-inverse functions are symmetrical about the line .
- The domain of a one-to-one function is the same as the range of its inverse and the range of is the same as the domain of .
- In these examples, we have chosen a domain for each function that is as big as possible whilst allowing the function to have an inverse.
- For the quadratic functions, we chose one half or the other so that the function was one-to-one rather than many-to-one.
- For the rational functions, we chose domains that excluded only the problematic values where the functions are undefined (corresponding to vertical asymptotes).
- You could define functions with the same equations on different domains. They could still be inverted so long as they were one-to-one.