Demand and Supply (Cambridge International A-Level Business)
Factors influencing demand and supply
Factors influencing demand
-
Demand refers to the number of goods or services customers are willing and able to buy at a given price
-
There is an inverse relationship between the quantity demanded by customers and price
- As price increases, the quantity demanded decreases
- As price decreases, the quantity demanded increases
- Hence the demand curve slopes downwards from left to right
-
This is illustrated in the diagram below
A simple demand curve
A demand curve showing how a change in price will lead to a change in quantity demanded (QD)
-
An increase in price from £10 to £15 leads to a movement up the demand curve from point A to B
- Due to the increase in price, the quantity demanded (QD) has fallen from 10 to 7 units
-
A decrease in price from £10 to £5 leads to a movement down the demand curve from point A to point C
- Due to the decrease in price, the QD has increased from 10 to 15 units
Factors leading to a change in demand
-
A change in price leads to a movement along the demand curve
-
However, a change in any other factors affecting demand will shift the entire demand curve to the left or right
- These are called non-price factors affecting demand
Non-price factors affecting demand
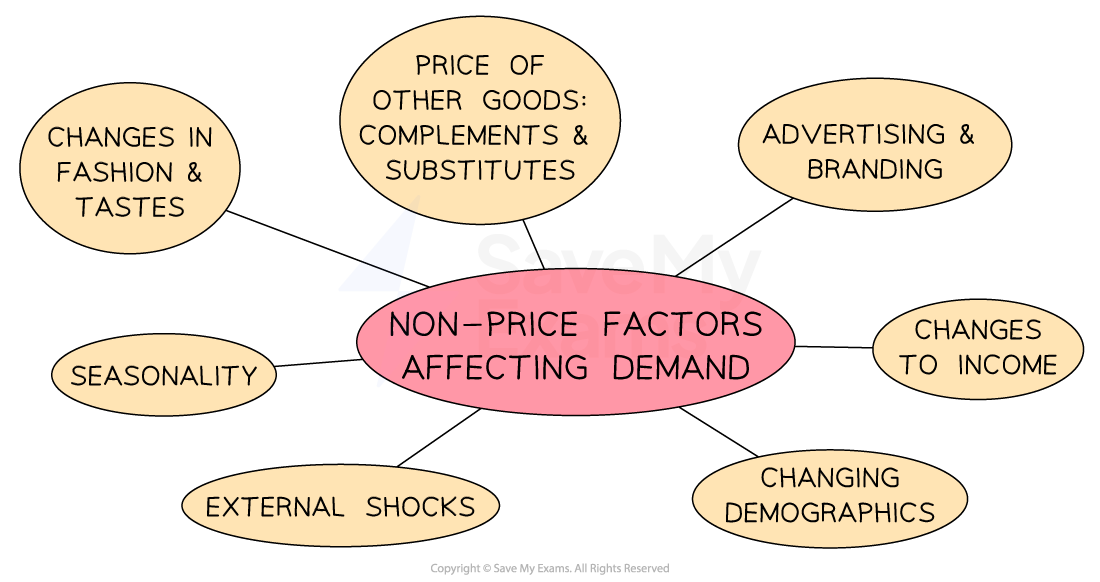
*The non-price factors affecting demand result in a shift of the entire demand curve *
-
For example, if a firm increases its Instagram advertising, there will be an increase in demand as more consumers become aware of the product
- This is a shift in demand from D to D1. The price remains unchanged at £7 but the demand has increased from 15 to 25 units
Illustreating changes in non-price factors
A change in any non-price factor will lead to a change in the position of the demand curve
-
The initial demand curve is seen at D
- At a price of £7, 15 units are demanded
-
If price remains constant at £7 but demand decreases due to one of the non-price factors of demand (e.g. decreasing incomes), the entire demand curve shifts to the left from D to D2
- Demand has decreased from 15 units to 5 units
-
If price remains constant at £10 but demand increases due to one of the non-price factors of demand (e.g. increased advertising expenditure), the entire demand curve shifts to the right from D to D3
- Demand has increased from 15 units to 25 units
Non-price factors affecting demand
| Non-price Factor | Explanation | Example |
|---|---|---|
| Change in the price of substitutes | - Substitute goods are replacement goods, e.g. different brands of car | - If the price of VW cars increases, demand for Ford cars might rise - This shifts the demand curve for Ford cars to the right |
| Change in the price of complementary goods | - Complementary goods are goods that are consumed together | - **Cars and petrol: **if the price of petrol rises, the demand for cars may fall - This shifts the demand curve for cars to the left |
| Change in consumer incomes | - As a consumer’s income rises, demand for** normal goods) increases | -** Demand for branded goods, **e.g. Superdry hoodies, tends to increase as consumer incomes rise - This shifts the demand curve for branded goods to the right |
| - As a consumer’s income falls, demand for inferior goods) increases | - Demand for own label products, e.g. supermarket hoodies,** tends to rise as consumer incomes fall - This shifts the demand curve for own label goods **to the right | |
| Fashions, tastes and preferences | - If products become more fashionable, demand them increases | - Plant based foods have become more popular in recent years - This shifts the demand curve for plant based foods to the right |
| Advertising and branding | - If more money is spent on advertising or branding, then this increases consumer awareness and brand loyalty | -** Coca Cola spends an average of **$4bn per year on advertising and branding - This shifts Coca Cola's demand curve to the right and makes demand more price inelastic |
| Demographics | - If the structure or size of a country’s population changes, then the demand for products will also change | - A decrease in the number of babies being born will reduce the demand for baby products - This shifts the demand curve for baby products to the left |
| Seasonality | - Demand varies at different times of the year | - In cold climates, the demand for gas and electricity will fall in the summer months - This shifts the demand curve for** energy **to the left |
| External shocks | - An unexpected event can change the demand | - The outbreak of Covid-19 lead to panic buying of goods such as toilet rolls - This shifts the demand curve for** toilet rolls to the right |
Factors influencing supply
-
Supply is the number of goods or services businesses are willing to sell at a given price in a specific time period
-
There is a direct relationship between supply and price
- As price increases, the quantity supplied increases
- As price decreases, the quantity supplied decreases
- At higher prices, businesses are incentivised to supply more of the product
- Hence the supply curve slopes upwards from left to right
A simple supply curve
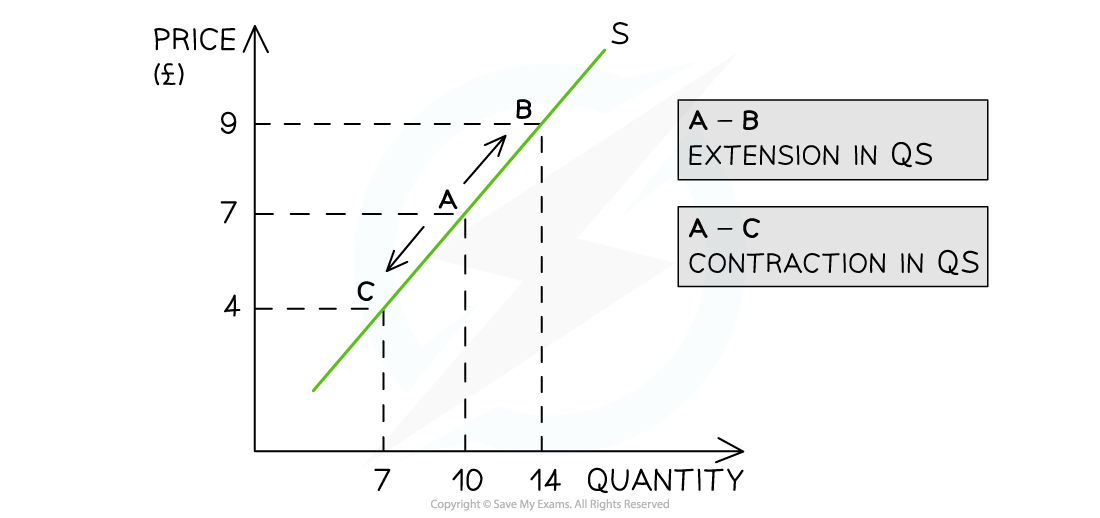
A supply curve showing how a change in price will lead to a change in the quantity supplied (QS)
-
An increase in price from £7 to £9 leads to a move up the supply curve from point A to B
- Due to the increase in price, the quantity supplied (QS) has increased from 10 to 14 units
-
A decrease in price from £10 to £7 leads to a movement down the supply curve from point A to point C
- Due to the decrease in price, the quantity supplied (QS) has decreased from 10 to 7 units
Factors leading to a change in supply
-
A change in price causes a movement along the supply curve
-
A change in any other factor affecting supply will shift the entire supply curve to the left or right
- These are called non-price factors affecting the supply
Non-price factors affecting supply
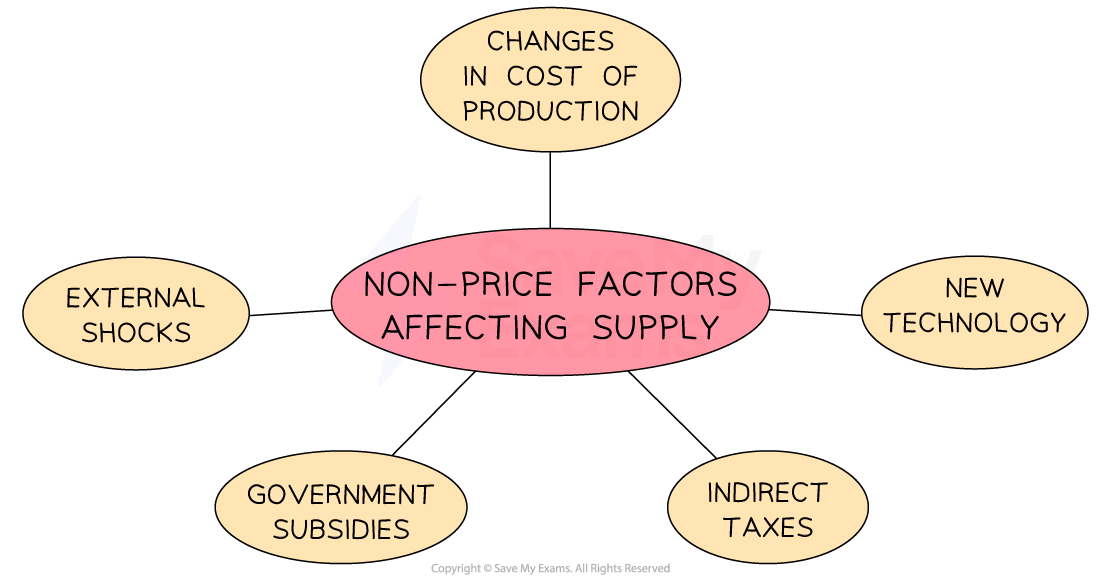
Non-price factors include changes in the costs of production, external shocks and indirect taxes
- E.g. If a firm's costs of production increase due to the increase in the price of a key resource, then there will be a decrease in supply as the firm is unable to afford to produce as many products
- This causes a shift in supply from S to S1. The price remains unchanged at £7 but the supply has decreased from 10 to 2 units
Changes in non-price factors
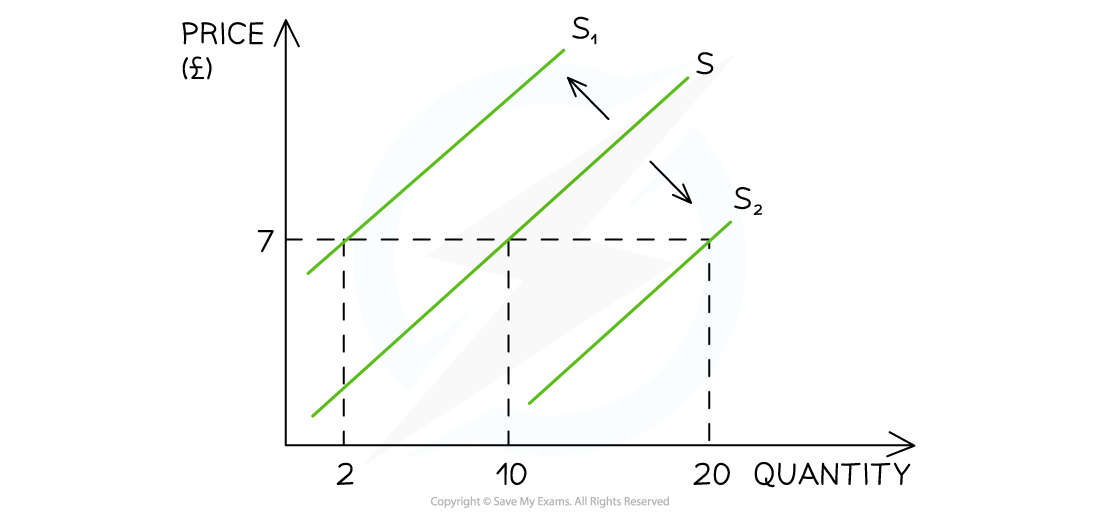
*A diagram showing how a change in any non-price factor of supply will shift the entire supply curve left or right *
-
The initial supply curve is seen at S
- At a price of £7, 10 units are supplied
-
If the price remains constant at £7 but supply decreases due to one of the non-price factors of supply (e.g. worker's wages increase), the entire supply curve shifts to the left from S to S1
- Supply has decreased from 10 to 2 units
-
If the price remains constant at £7 but supply increases due to one of the non-price factors of supply (e.g. costs of production fall), the entire supply curve shifts to the right from S to S2
- Supply has increased from 10 to 20 units
Non-price factors affecting supply
| Non-price factor | Explanations | Examples |
|---|---|---|
| Change in the costs of production | - An increase in costs of production makes it more expensive to produce each unit and a business will be able to produce less at a given price | - For a clothing manufacturer, an increase in energy and labour costs will increase the costs of making each item - This shifts the supply curve for clothing to the left |
| New technology | - Advances in technology will lead to lower costs of production and businesses will be able to produce more at a given price | - Robots have replaced many workers in car factories and this increases productivity - This shifts the supply curve for cars to the right |
| Indirect taxes | - The government increases indirect taxes on businesses, which causes an increase in the costs of production as firms have to pay extra costs | - The rate of **VAT increased from 17.5% to 20% in the UK in 2011 - This shifts the supply curve for all businesses to the left |
| Government subsidies | - A subsidy given by the government to businesses will reduce the costs of production | - A subsidy to the largest battery producer in the UK lowers the costs of production for electric car manufacturers - This shifts the supply curve** for electric vehicles **to the right |
| External shocks | - An unexpected event can change the supply | - The outbreak of Covid-19 caused many hotels, bars, and restaurants to close down - This shifts the supply curve for** hotels, bars, and restaurants to the left |
Interactions between demand, supply and price
-
In a market, prices for goods/services are determined by the interaction of demand & supply
-
A market is any place that brings buyers & sellers together to trade at an agreed price
- Markets can be physical (e.g. McDonald's) or virtual (e.g. eBay)
- Buyers agree on the price by purchasing the good/service
- If they do not agree on the price then they do not purchase the good/service
-
Based on this interaction with buyers, sellers will gradually adjust their prices until there is an equilibrium price and quantity that works for both parties
- At the equilibrium price, sellers will be satisfied with the rate/quantity of sales
- At the equilibrium price, buyers are satisfied that the product provides benefits worth paying for
Equilibrium
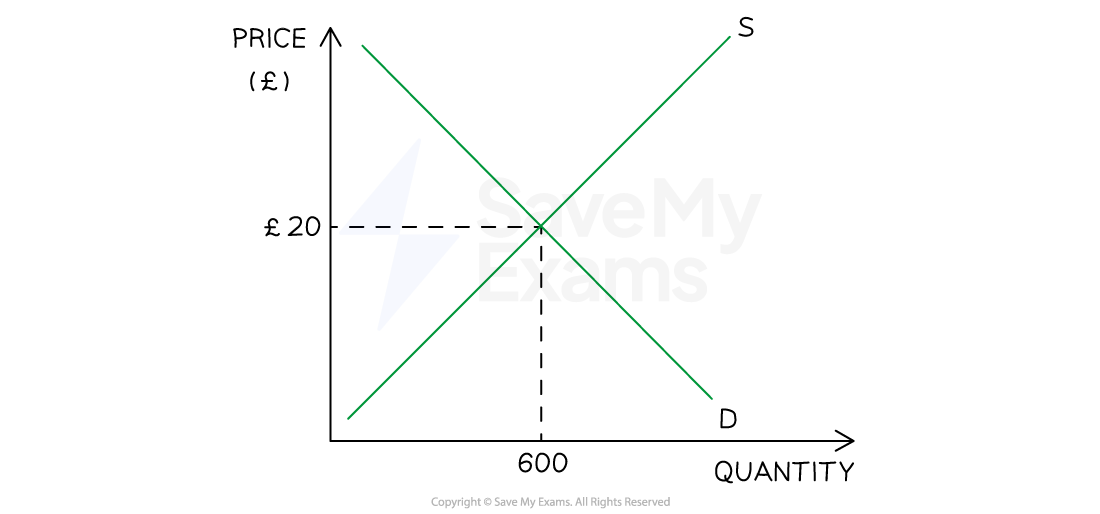
A graph showing a market in equilibrium with a market clearing price at P and quantity at Q
-
If the price is set at £20, demand will equal supply and equilibrium is reached
- 600 units will be demanded and supplied
- If the price was set above equilibrium, supply would be greater than demand and there would be a surplus
- If the price was set below equilibrium demand would be greater than supply and there would be a shortage
Dynamic changes in markets
- There are 4 diagrams that can be used to show the causes and consequences of changes to the non-price factors of demand and supply
A rise in demand
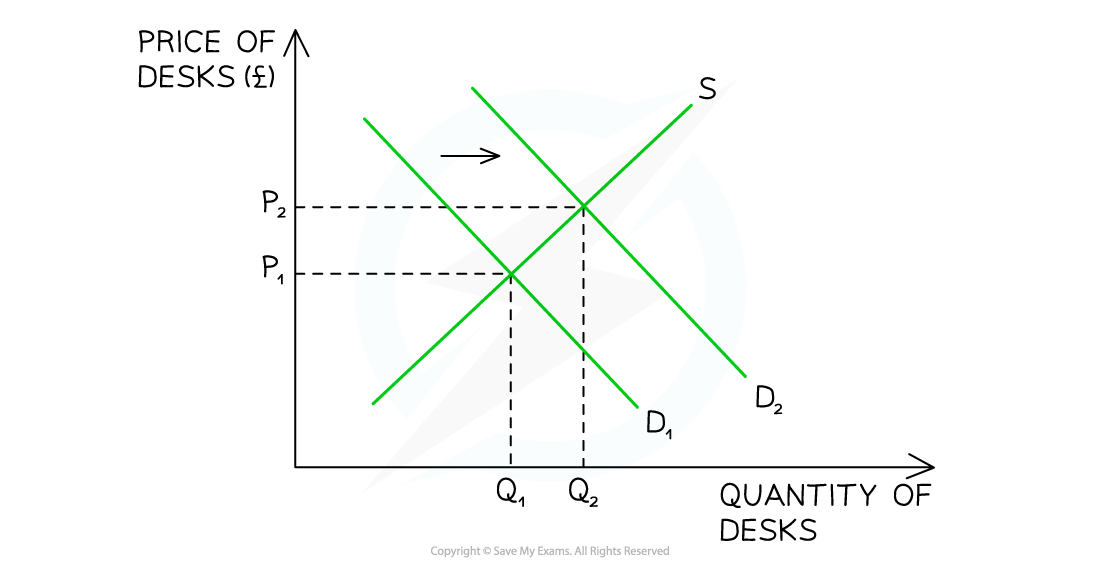
Supply and demand graph for desks showing a rightward shift in demand from D1 to D2.
- The original equilibrium was at P1 and Q1
- A rise in demand causes the demand curve to shift to the right from D1→ D2 (perhaps due to an increase in home working)
- At the original price of P1, there is now a shortage as demand exceeds the supply
- The shortage causes prices to rise from P1 to P2
- A new equilibrium develops at a price of P2 and a quantity of Q2 units
- The business revenue (P x Q) has changed from P1Q1 to P2Q2
A fall in demand
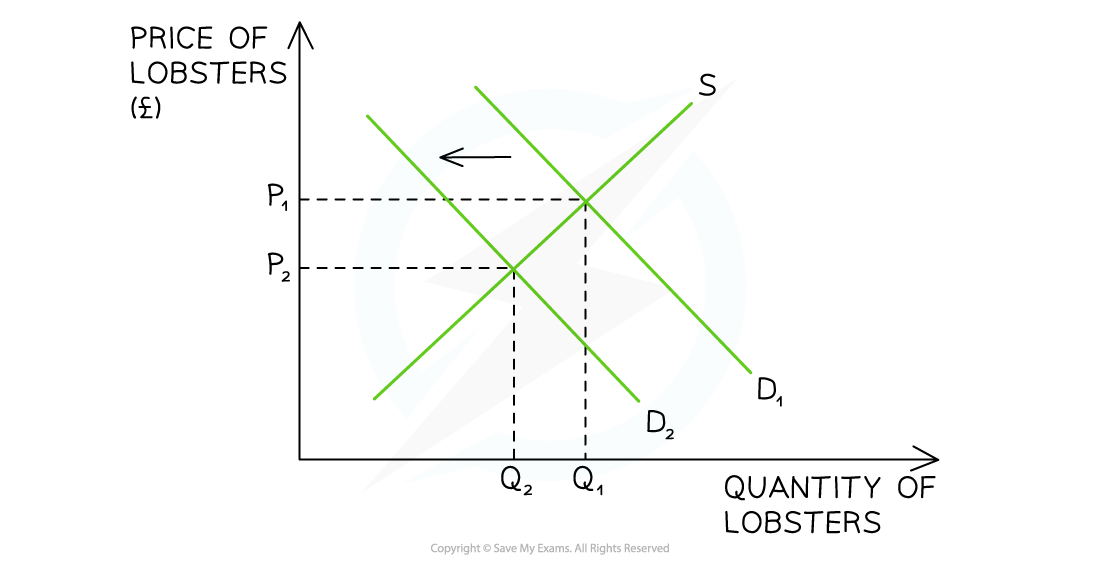
Graph showing supply and demand for lobsters, with a leftward demand shift from D1 to D2
- The original equilibrium was at P1 and Q1
- A fall in demand causes the demand curve to shift to the left from D1→ D2 (perhaps due to an external shock)
- At the original price ofP1, there is now a surplus as supply exceeds demand
- The surplus causes prices to fall from P1 to P2
- A new equilibrium develops at a price of P2 and a quantity of Q2 units
- The business revenue (P x Q) has changed from P1Q1 to P2Q2
A rise in supply
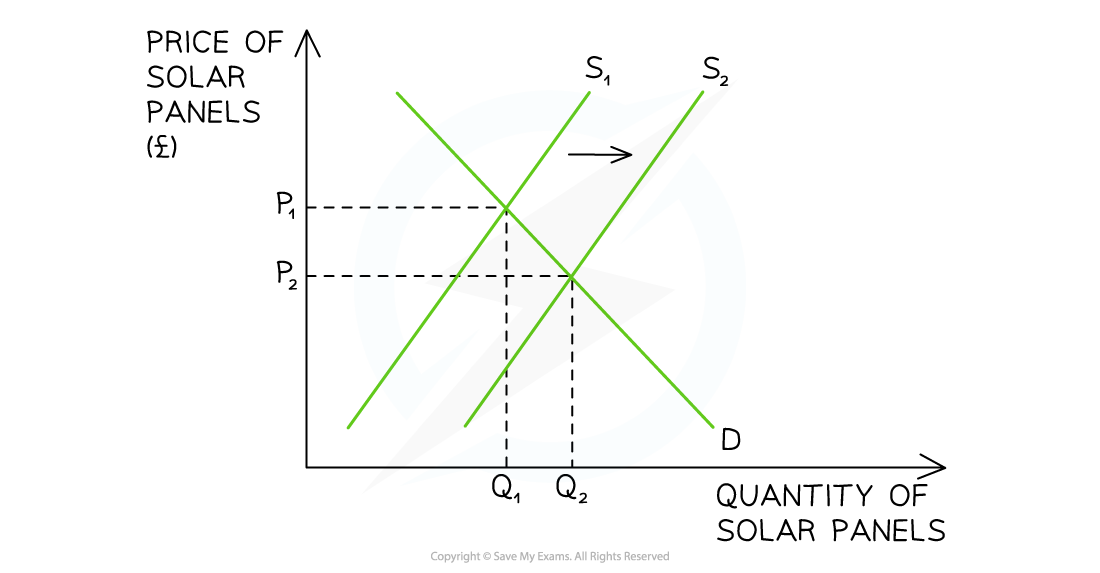
Supply and demand graph for solar panels, showing shift from supply curve S1 to S2
- The original equilibrium was at P1 and Q1
- A rise in supply causes the supply curve to shift to the right from S1→ S2 (perhaps due to an increase in productivity)
- At the original price of P1, there is now a surplus as supply exceeds demand
- The surplus causes prices to fall from P1 to P2
- A new equilibrium develops at a price of P2 and a quantity of Q2 units
- The business revenue (P x Q) has changed from P1Q1 to P2Q2
A fall in supply
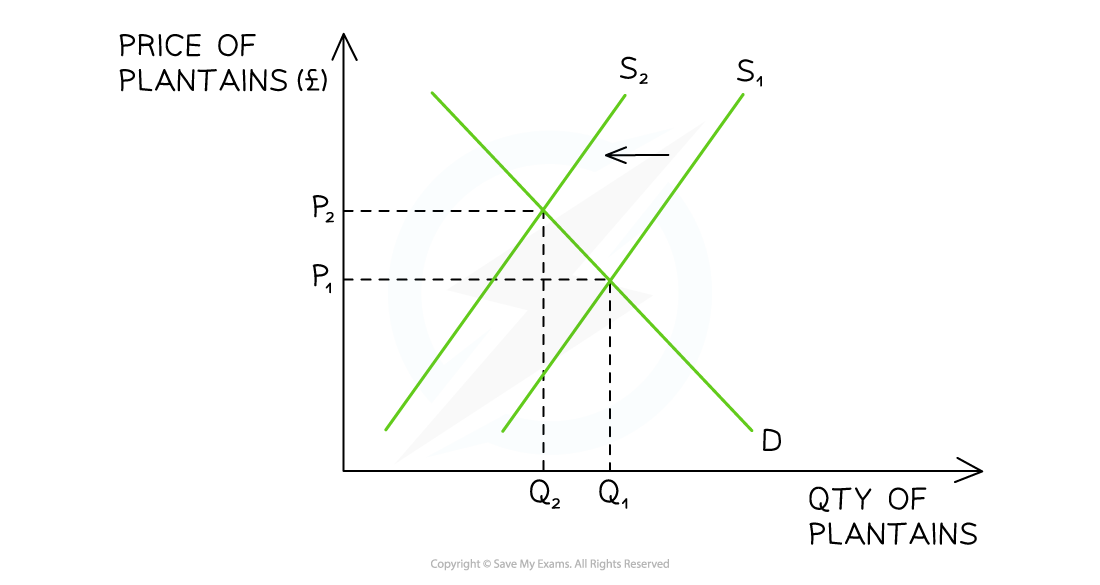
Supply and demand graph for plantains, showing S1 shifting left to S2
- The original equilibrium was at P1 and Q1
- A fall in supply causes the supply curve to shift to the left from S1→ S2 (perhaps due to an increase in the costs of production)
- At the original price of P1, there is now a shortage as demand exceeds the supply
- The shortage causes prices to rise from P1 to P2
- A new equilibrium develops at a price of P2 and a quantity of Q2 units
- The business revenue (P x Q) has changed from P1Q1 to P2Q2
Exam Hint When answering questions on changes to markets, remember that a change in the price of the good leads to a movement along the demand or supply curve, not a shift in the demand or supply curve.
Practice drawing and labelling demand and supply diagrams accurately, describing them step-by-step; this will help you gain analysis marks. You can also use demand and supply diagrams to illustrate changes in total revenue.
Was this revision note helpful?
Build on this topic