Operations Planning (Cambridge International A-Level Business)
The need for operations planning
-
Operations planning is the process of organising all the resources and activities needed to produce goods or services efficiently
- It ensures that the right products are made, at the right time, in the right quantity and using the right resources
Benefits of operations planning
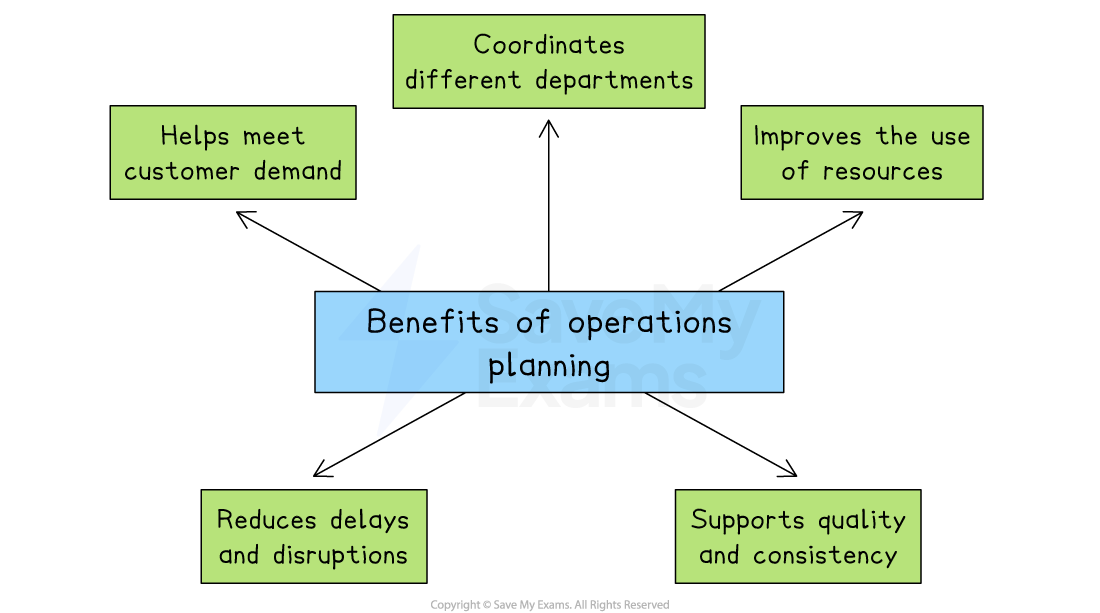
Operations planning helps a business meet customer demand and supports quality and consistency
-
Meet customer demand
-
Planning helps businesses produce the correct quantity of goods to match expected demand
- Without it, a business might make too little, causing stock shortages and lost sales,or too much, leading to waste and higher costs
-
-
Improve the use of resources
-
Operations planning ensures that staff, machinery and materials are used efficiently
- It helps avoid wasted time, overuse of equipment, or running out of stock during production
-
-
Coordination of departments
-
Good planning allows production, purchasing, finance, and marketing to work together
- E.g. Marketing can give sales forecasts, finance can set budgets and production can schedule output to meet targets
-
-
Reduces delays and disruptions
-
Planning helps identify potential problems early, such as a shortage of raw materials or a machine breakdown
- Solutions can be prepared in advance, reducing the risk of disruption
-
-
Supports quality and consistency
-
Operations planning includes setting clear standards for quality, timing and workflows
- This ensures that products or services are delivered consistently to meet customer expectations
-
An introduction to network diagrams
- A network diagram is a visual planning tool used in operations management to help organise and schedule tasks in a project
- It shows the order in which activities must be completed and how long each one is expected to take
Example network analysis
A simple network diagram showing key elements
- A network diagram must always start and end on a single node
- Lines must not cross and must only be assigned to activities
How network diagrams help operations planning
-
Network diagrams improve time management by helping managers identify the critical path, the shortest time needed to complete a project
- They highlight task dependencies by showing which activities must be completed before others can begin, helping to avoid mistakes and delays
-
Network diagrams support efficient resource allocation by showing when people, machines, or materials will be needed, reducing idle time and bottlenecks
- They improve decision-making by making it easier to adjust plans if there are unexpected delays or changes to deadlines
Elements of network diagrams
Node
-
A node is a circle that represents a point in time where an activity either starts or finishes
-
Each node is split into three sections
- The left half of the circle shows the activity number
- The top right section shows the earliest start time (EST)—the earliest point an activity can begin, based on the completion of the previous activity
- The bottom right section shows the latest finish time (LFT)—the latest time by which the previous activity must be completed without delaying the project
Activities
-
An activity is a task or process within a project that takes time to complete
- Activities are shown on a network diagram as a line linking two nodes
- Above the line, you will usually find either a letter or a short description of the activity
Duration
- The duration is the length of time required to complete an activity
- This is shown below the activity line and is usually measured in time units such as hours or days
Dummy activities
-
A dummy activity is an activity that has a weight of zero
- Dummies are not assigned names (letters)
- Dummies are represented by dotted lines
Where a dummy activity is used
-
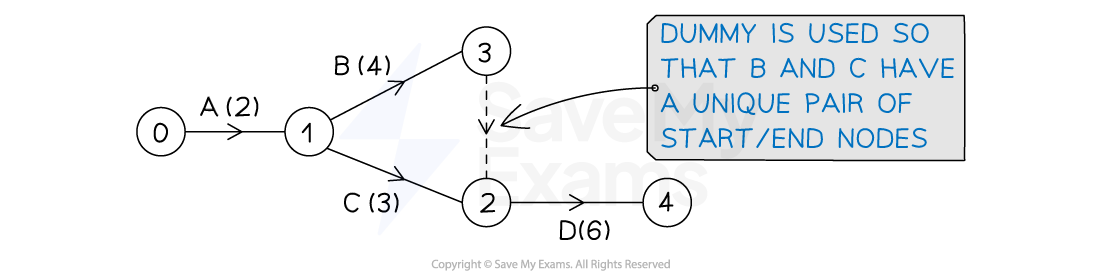
To ensure each activity has a unique pair of start and end nodes
-
E.g. In the activity network below, activity D has immediate predecessors B and C
- B and C cannot both start at event (node) 1 and end at event (node) 2 (this would not be a unique pair)
- a dummy activity is used so that B has start and end pair (1, 3) and C has a start and end pair (1, 2)
-
-
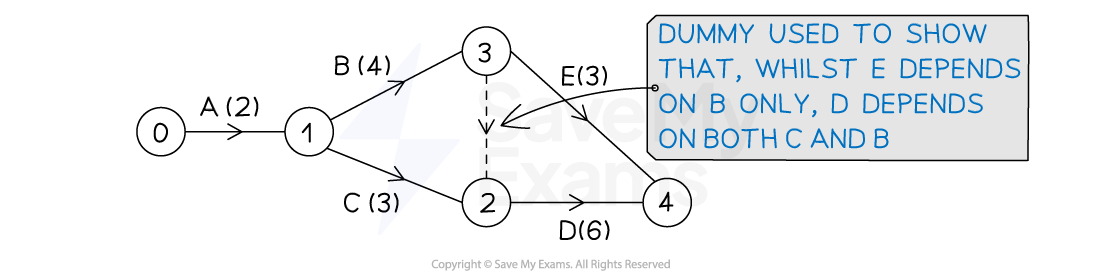
When there is a split of immediate predecessors
-
E.g. In the activity network below, activity D has immediate predecessors B and C
- Activity E only has B as an immediate predecessor
- A dummy activity is used to show that D depends on both B and C
-
Using network diagrams for critical path analysis
1. Calculating earliest start times (EST)
- Working forward from Node 1, it is possible to calculate the Earliest Start Time for each activity by adding the duration of each task
An example of a simple network diagram showing Earliest Start Times
-
The EST for each activity is placed in the top right of each node
-
Node 1 is the starting point of the project and where both Activity A and Activity B begin
-
Activity A and Activity B are independent processes
-
Activity A has a duration of 2 days and its earliest start time (EST) is 0 days
-
Activity B has a duration of 3 days and its EST is also 0 days
-
Activity C and Activity D both begin at Node 2 and are dependent upon the completion of Activity A but are independent from each other
- Activity C has a duration of 3 days and its EST is 2 days
- Activity D has a duration of 5 days and its EST is also 2 days
-
-
Activity E begins at Node 3
- Activity E has a duration of 4 days and its EST is 3 days
-
Activity F begins at Node 4
- Activity F has a duration of 2 days and its EST is 5 days
-
Activity G begins at Node 5
- Activity G has a duration of 1 day and its EST is 7 days
-
Activity H begins at Node 6
- Activity H has a duration of 3 days and its EST is 7 days
-
Node 7 is the end point of the project
2. Calculating latest finish times (LFT)
- Working backwards from Node 7, it is now possible to calculate the Latest Finish Time (LFT) for each activity by subtracting the duration of each task
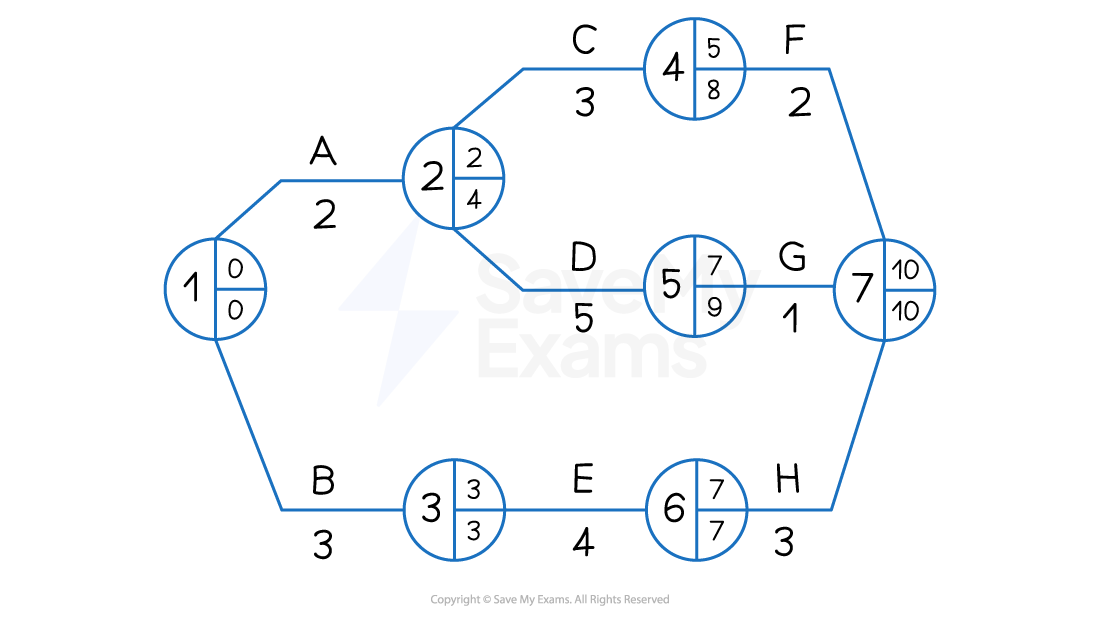
An example of a simple network diagram showing Earliest Start Times and Latest Finish Times
-
The LFT for each activity is placed in the bottom right of each node
-
Node 7 is the end point of the project, which has a latest finish time of 10 days
-
Activity H has a duration of 3 days
- The LFT in Node 6 is 7 days (10 days - 3 days)
-
Activity G has a duration of 1 day
- The LFT in Node 5 is 9 days (10 days - 1 day)
-
Activity F has a duration of 2 days
- The LFT in Node 4 is 8 days (10 days - 2 days)
-
Activity E has a duration of 4 days
- The LFT in Node 3 is 3 days (7 days - 4 days)
-
Activity D has a duration of 5 days
- The LFT in Node 2 is 4 days (9 days - 5 days)
-
Activity C has a duration of 3 days
- The LFT in Node 3 is 4 days because Activity D is the more time-critical of the two activities that are dependent upon the completion of Activity A and so its LFT is recorded
-
Activity B has a duration of 3 days
- The LFT in Node 1 is 0 days (3 days - 3 days)
-
Activity A has a duration of 2 days
- The LFT in Node 1 is 0 days because Activity B is the more time-critical of the two starting activities and so its LFT is recorded
-
-
The LFT in Node 1 is always 0
3. Identifying the critical path
-
The critical path highlights those activities that determine the length of the whole project
-
If any of these critical activities are delayed, the project as a whole will be delayed
-
The critical path follows the nodes where the EST and LFT are equal
- In the diagram below nodes 1 3 6 and 7 have equal ESTs and LFTs
- Activities that determine these nodes are B E and H
- These activities are marked with two short lines
- The critical path is therefore BEH
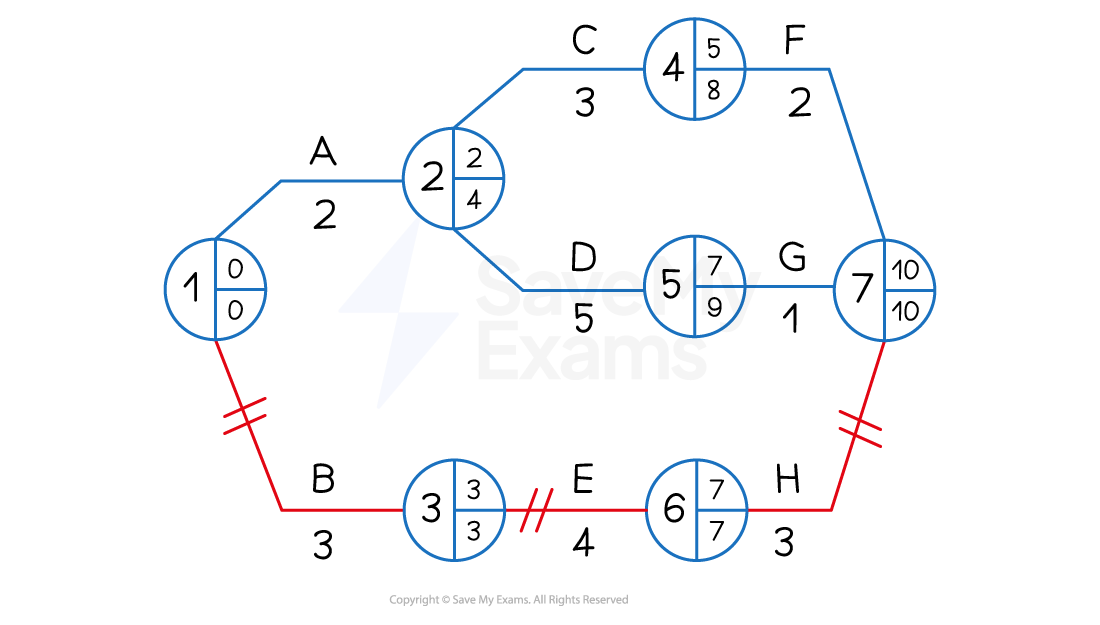
An example of a simple network diagram showing the critical path BEH
4. Identifying and calculating float time
-
Float time exists where there is a difference between the Earliest Start Time (EST and the Latest Finish Time (LFT)
-
Where float time is identified, managers may
- Transfer resources such as staff or machinery to more critical activities
- Allow extra time to complete tasks to improve quality or allow for creativity
An example of a simple network diagram showing float nodes (4 and 5) and a critical node (6)
Float time analysis
- The total float refers specifically to spare time that is available so that the overall project completion is not delayed
- The total float for a specific activity is calculated by
- Using the diagram above, the following total float times can be calculated for Activities A to H:
| Activity | LFT | - Duration | - EST | = Total Float |
|---|---|---|---|---|
| A | 4 | 2 | 0 | 2 |
| B | 3 | 3 | 0 | 0 |
| C | 8 | 3 | 2 | 3 |
| D | 9 | 5 | 2 | 2 |
| E | 7 | 4 | 3 | 0 |
| F | 10 | 2 | 5 | 3 |
| G | 10 | 1 | 7 | 2 |
| H | 10 | 3 | 7 | 0 |
- The critical activities B E and H each have a total float of 0 days
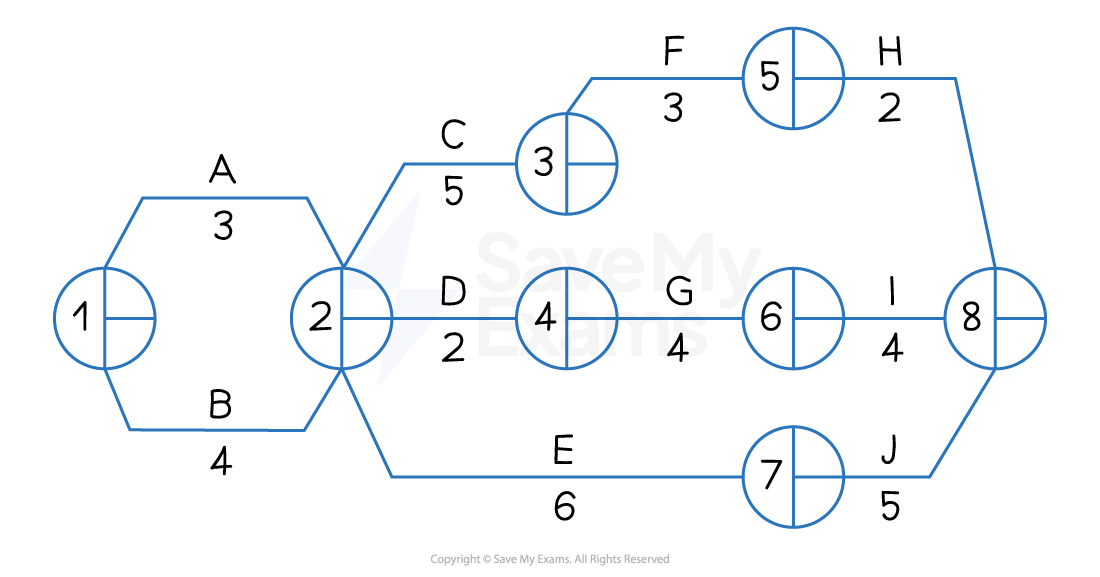
Worked Example The network diagram below shows the activities involved in a new promotional campaign for a small fashion accessories business as well as the time (in weeks) it is expected that each activity will take to complete.
Calculate
a) The earliest start times and latest finish times for each node.
[4]
b) The total float time for activity G
[2]
Step 1: Calculate the Earliest Start Times (EST)
Node 1 EST = 0
Node 2 EST = 0 + 3 = 3 but 0 + 4 = 4 so 4
Node 3 EST = 4 + 5 = 9
Node 4 EST = 4 + 2 =6
Node 5 EST = 9 + 3 = 12
Node 6 EST = 6 + 4 = 10
Node 7 EST = 4 + 6 = 10
Node 8 EST = 12 + 2 = 14 but 10 + 4 = 14 and 10 + 5 = 15 so 15 (2)
Step 2: Calculate the Latest Finish Times (LFT)
Node 8 = 15
Node 7 = 15 - 5 = 10
Node 6 = 15 - 4 = 11
Node 5 =15 - 2 = 13
Node 4 =11 - 4 = 7
Node 3 =13 - 3 = 10
Node 2 = 10 - 6 = 4
Node 1 = 4 - 4 = 0 (2)
Step 3: Calculate the total float time for Activity G
(2)
Amending network diagrams
- If the length of time taken to complete an activity changes, there may be an effect on the critical path and available float
An example of a simple network diagram showing the critical path BEH
-
In the strategy shown in the network diagram above, the duration of activity G is increased from 1 to 4 days
- The EST at node 7 will increase to 11 days and the LFT to 11 days
- The EST at node 5 will remains at 11 days, while the LFT will change to 7 days
- The EST at node 5 will remains at 2 days, while the LFT will change to 2 days
-
As a result, the critical path will switch from BEH to ADG
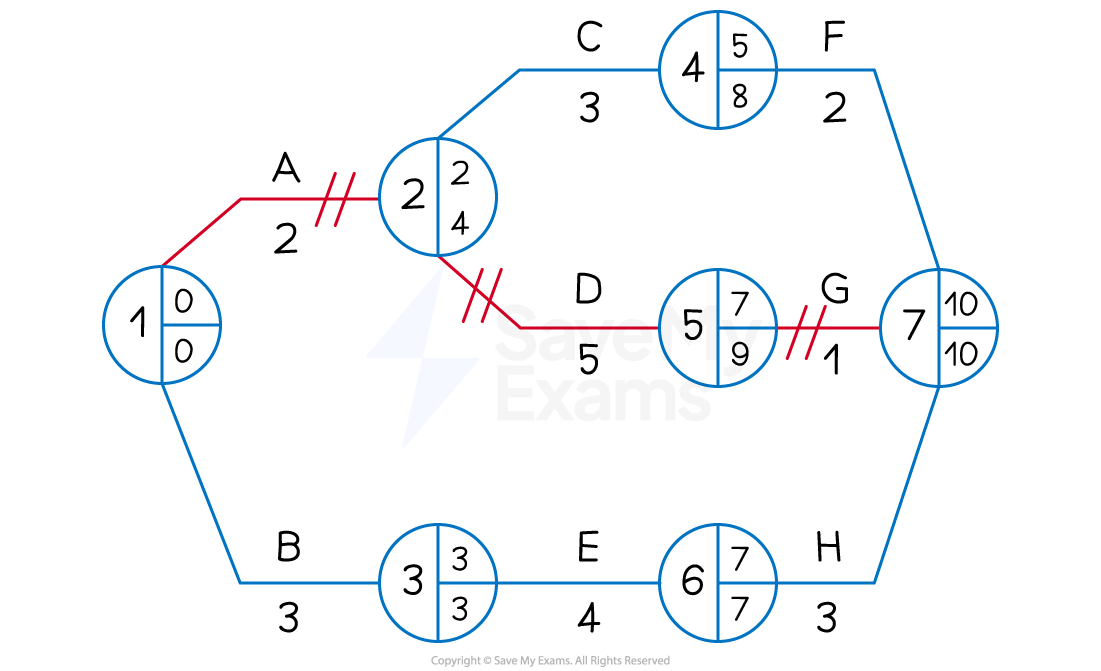
The amended network diagram showing the critical path ADG
Evaluating critical path analysis
- Although critical path analysis can be useful in project planning, the method has some limitations
Limitations of critical path analysis
| Limitations | Explanation |
|---|---|
| - Very lengthy or complex projects involve a very large number of activities that have numerous dependencies - Network analysis often relies on estimates and forecasts - Network analysis **does not guarantee the success **of a project - Resources may not prove to be as flexible as hoped when managers identify float periods | - Supervisors and specialist network planning software may be required - Significant research and good communication with suppliers is required to make** a network diagram** really useful - Project managers will need to be highly skilled and will need experience of working with complicated plans - Employees may require additional training in order to transfer to critical tasks - Machinery and other capital resources may need to be adapted or upgraded |
Was this revision note helpful?
Build on this topic