Market Research Data (Cambridge International A-Level Business)
Reliability of market research data
- Market research is a valuable tool that helps businesses make informed choices about, for example, product development, pricing and promotion
- However, if the data collected is unreliable, it can lead to poor decisions that waste time, money and resources
Why market research data can be unreliable
| Reason | Explanation | Example |
|---|---|---|
| Respondents may not give truthful or accurate answers | - People might give answers they think sound good, rather than what they truly believe. Others may guess or not take the questions seriously | - A customer claims they would buy an eco-friendly product to appear responsible, but they don’t actually plan to |
| Questions may be poorly designed or unclear | - If the wording is confusing, too vague, or biased, responses can be inconsistent or misleading | - A survey asking “Do you like affordable luxury?” may be interpreted differently by each person |
| Secondary data may be outdated or collected for a different purpose | - Existing data might not reflect current trends, or it may have been gathered with different goals in mind | - A business uses a 2019 report on travel habits, which doesn’t reflect post-pandemic behaviour |
| Data collection methods may be inconsistent or poorly managed | - Mistakes in how the research is conducted, recorded or analysed can reduce reliability | - An interviewer forgets to record some answers or enters the wrong data into a spreadsheet |
Analysis of quantitative and qualitative market research data
Quantitative data
-
Quantitative data is based on numbers
- It could include financial reports (e.g. sales, costs), market data (e.g. market share) or summaries of data gained from primary research (e.g. on a scale of 1–10, rate our customer service)
-
It is beneficial for a range of reasons
-
Percentages, scores, or yes/no answers are straightforward to organise, compare and present using graphs or charts
-
Large amounts of numerical data can reveal clear patterns in customer behaviour over time
- E.g. A clothing retailer may notice that online sales increase by 20% every November, helping them plan future promotions
-
Analysis of quantitative data using mean, median, mode and range
| Term | Definition | How to calculate | Example |
|---|---|---|---|
| Mean | - The average of a set of numbers | - Add all the numbers together, then divide by how many numbers there are | |
| Median | - The middle value when the numbers are in order | - Arrange the data from smallest to largest and find the middle number | |
| Mode | - The number that appears most often | - Find the value that repeats the most in the data set | |
| Range | - The difference between the highest and lowest values | - Subtract the smallest number from the largest |
Qualitative data
-
Qualitative data gathers descriptions or explanations
-
These can be based on conversations, discussions, impressions and emotional feelings and are usually gathered through primary research
-
It helps businesses understand not just what customers do, but why they do it
-
By listening to detailed customer feedback, businesses can make meaningful improvements to products or services based on real user experiences
- E.g. A technology company might learn from a focus group that users find a mobile app too complicated, leading to changes in layout and features
-
Analysis of qualitative data
-
Businesses often analyse qualitative data through a process called coding
- This is where similar responses or themes are grouped together, so the business can identify patterns and common issues
- Each theme is given a code to make it easier to sort and compare
Case Study Coding in action
A mobile phone company collects hundreds of open-ended survey responses asking customers what they like or dislike about a new handset
Marketing researchers read through the comments and assign codes:
- “BAT” for battery life
- “CAM” for camera quality
- “EAS” for ease of use
- “DES” for design and appearance
After coding the responses, they may notice that many customers mention “BAT” (battery life) negatively
The business can then use this insight to improve the battery in the next version of the product
They may also adjust their marketing to focus on features that customers value more positively

Limitations of quantitative and qualitative research data
| Limitations of quantitative data | Limitations of qualitative data |
|---|---|
| - Numerical data may be out-of-date, especially in dynamic markets - Data analysis and interpretation is a complex skill that is likely to be lacking in smaller businesses - Looking at a small amount of data and then extrapolating results can provide wrong assumptions on which to base decisions - Numerical data does not provide reasons for outcomes, e.g. data may reveal sales volumes are falling but not the reason for the decline | - Bias may mean that analysts can interpret responses in a particular way - Respondents may lack awareness or language skills to explain preferences accurately - Respondents in focus groups may be influenced by the responses of others or not provide accurate information - Qualitative data is difficult to present in graphs and charts, so it may not be easily understood |
Interpretation of tables, charts and graphs
1. Tables
- Tables summarise data in an organised form
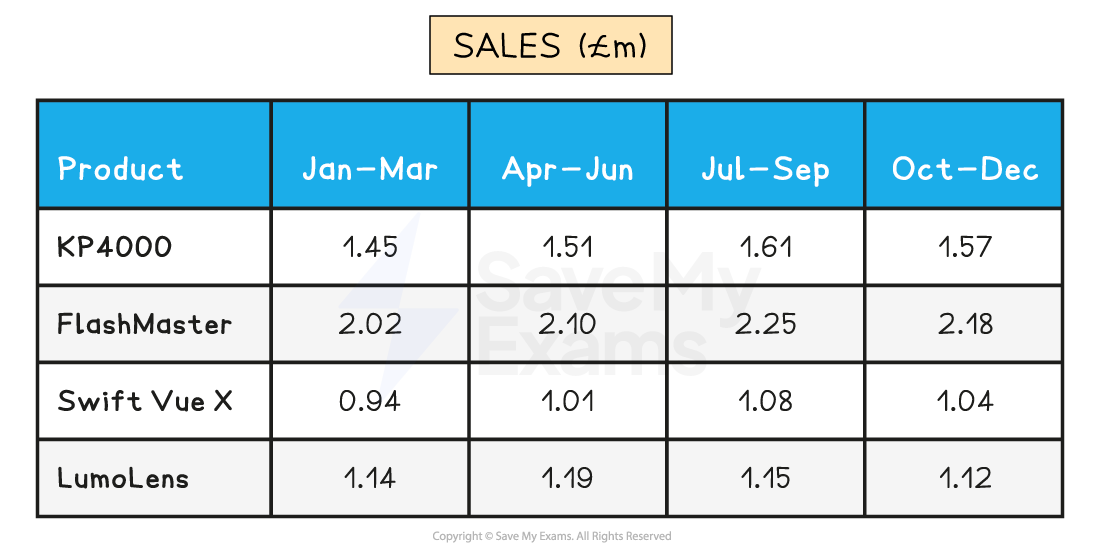
A table summarises data in an organised form
-
The table shows that:
- Flashmaster generates the highest sales in each period
- Sales of LumoLens are lower at the end of the year than at the start of the year
2. Graphs and charts
- Data contained in graphs and charts can be important sources of marketing research
- Data may be presented in a range of forms
Bar charts
- Bar charts show data that are independent of each other, such as sales per store
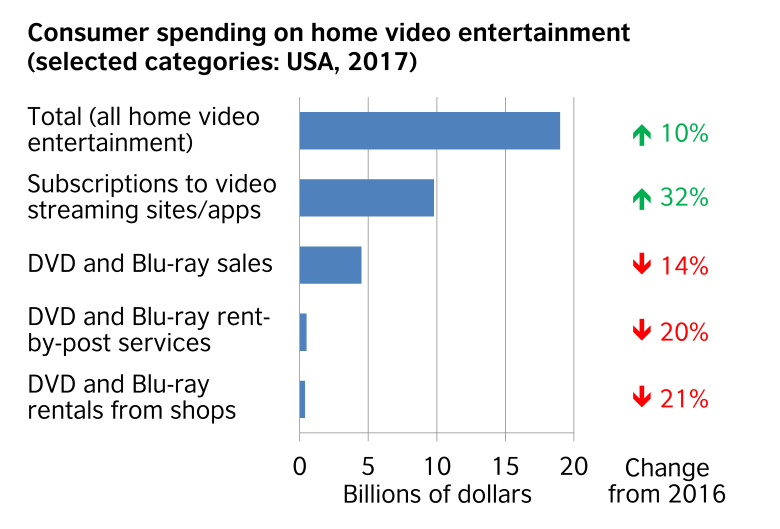
A bar chart showing sales revenue for a selection of home video entertainment formats in the USA in 2017 (Source: British Council)
Pie charts
- Pie charts show how a whole is divided into different elements, such as total sales divided amongst different product types
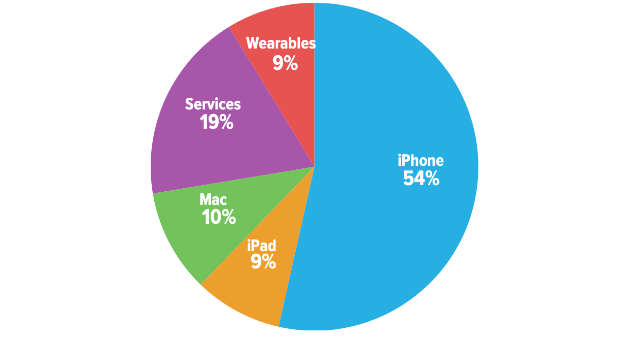
A pie chart showing Apple's quarterly revenue by category in April 2021 (Source: Six Colours)
Scatter graphs
- Scatter graphs allow businesses to compare two variables, such as sales volume and advertising, to establish if there is any correlation between them
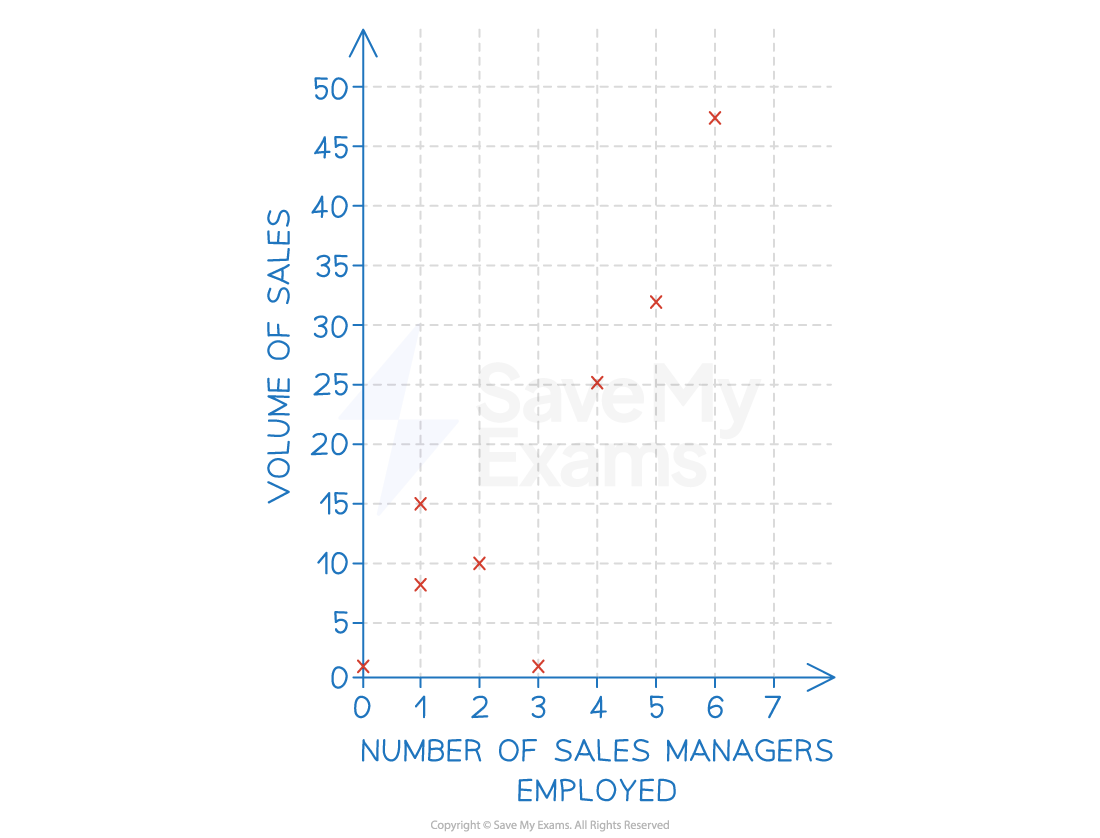
A scatter graph showing the number of sales managers employed by a business and the volume of items sold
-
A correlation exists where there is a relationship or connection between the two variables in a scatter graph
-
A positive correlation means that as one variable increases, so does the other variable
- A line of best fit that slopes upwards can be identified
-
A negative correlation means that as one variable increases, the other variable decreases
- A line of best fit that slopes downwards can be identified
-
No correlation means that there is no connection between the two variables
- It is not possible to identify a line of best fit
-
Correlation types
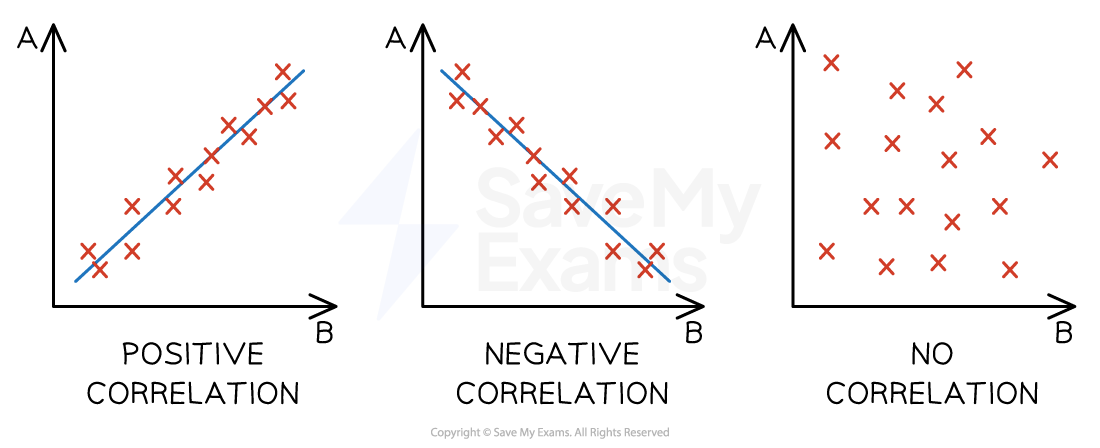
The main types of correlation between two variables: positive, negative and no correlation
-
Where a line of best fit can be identified and when causation *is determined, a business can extrapolate data to make predictions around changes to either of the variables
- E.g. extrapolation of the line of best fit in the example below means that the business could predict that employing seven sales managers would likely result in sales of 46 units
Extrapolation using a line of best fit
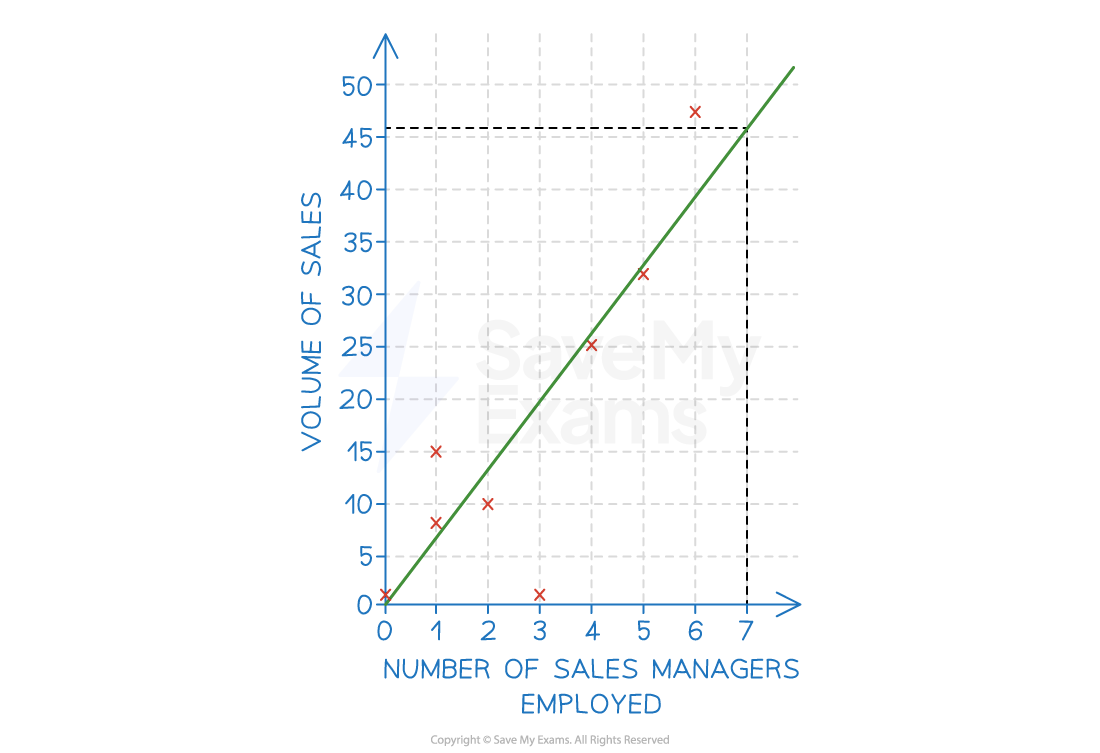
A scatter graph with a line of best fit showing the number of sales managers employed by a business and the volume of items sold
Exam Hint When drawing a line of best fit, you should try to include as many data points above the line as below the line
Watch out for outlying data — if there is more than one outlier above the line, adjust your line of best fit upwards
Similarly, if there is more than one outlier below the line, adjust your line of best fit downwards. Just one outlier should not influence your line of best fit
Was this revision note helpful?
Build on this topic