A sample of 50 eggs is taken from Farm A.
The table shows information about the masses of the eggs from Farm A.
Farm A
| Mass,m(grams) | Frequency |
|---|
| 53<mless−thanorslantedequalto58 | 8 |
| 58<mless−thanorslantedequalto63 | 19 |
| 63<mless−thanorslantedequalto68 | 15 |
| 68<mless−thanorslantedequalto73 | 8 |
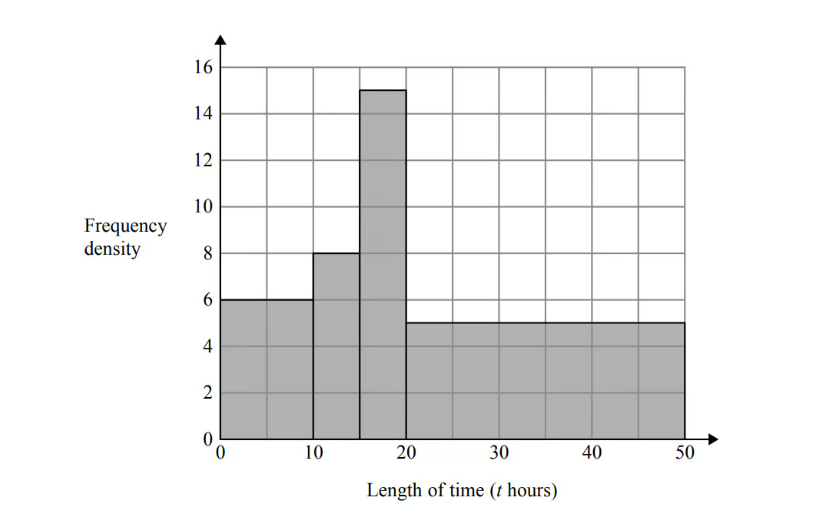
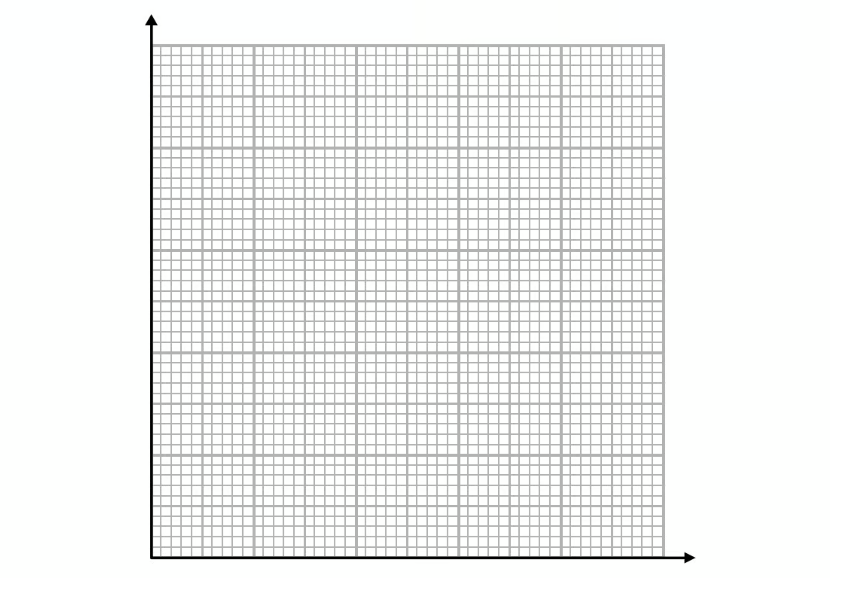
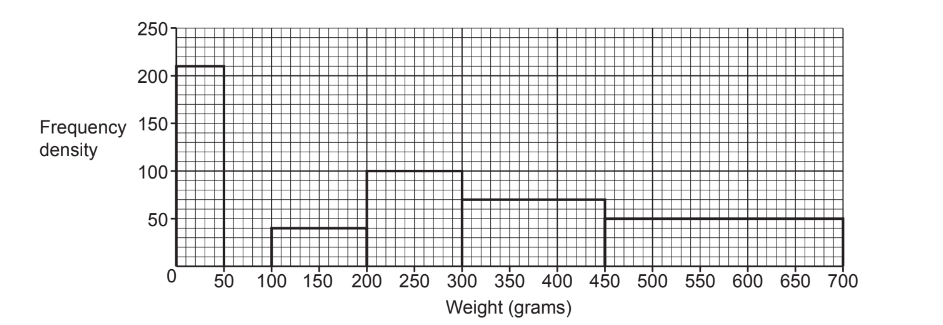
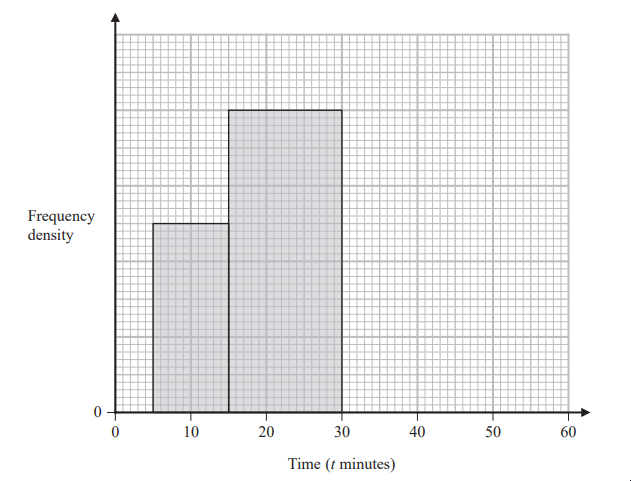
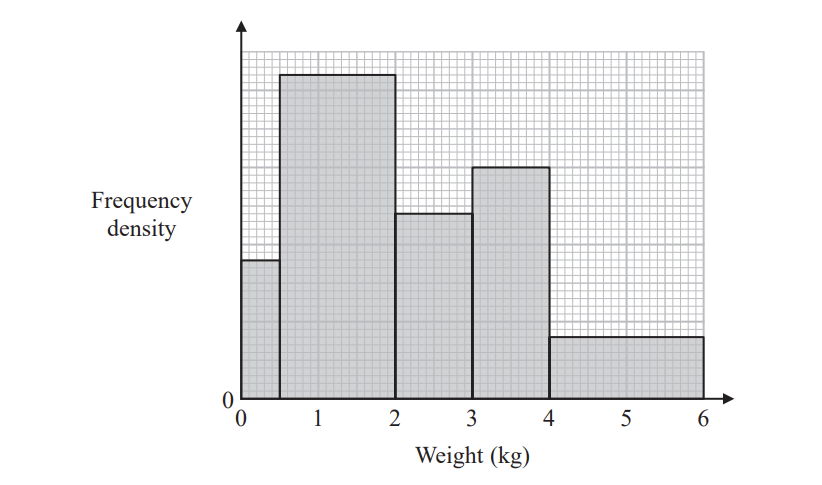
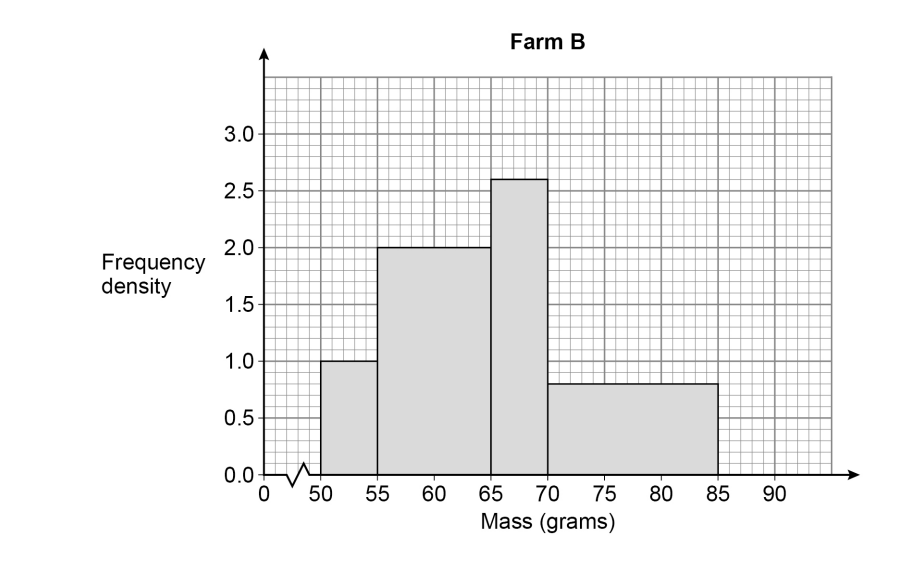
A sample of 50 eggs is taken from Farm B.
The histogram shows information about the masses of the eggs from Farm B.
Farm B
For medium eggs, 53 g < mass < 63 g
The Farm A sample has more medium eggs than the Farm B sample.
Using the table and the histogram, estimate how many more.
You must show your working.