12 markseasy
Suggest one issue resulting from population change.
21 questions · 98 marks · ≈ 2 hours
Suggest one issue resulting from population change.
Study Figure 13a, which shows data for three indicators of human welfare in six London boroughs in 2014.
Which is the most deprived borough?
| Borough | Rank | Average income per person p.a.(£) | Unemployment Rate | Rank | Average life expectancy (years) |
|---|---|---|---|---|---|
| Kensington & Chelsea | 1 | 98 400 | 5.0 | 1 | 84.1 |
| Wandsworth | 2 | 35 600 | 5.2 | 4 | 81.1 |
| Hammersmith & Fulham | 3 | 32 500 | 6.2 | 3 | 81.2 |
| Lambeth | 4 | 28 800 | 8.0 | 5 | 80.3 |
| Croydon | 5 | 26 400 | 8.4 | 2 | 81.4 |
| Barking & Dagenham | 6 | 23 300 | 10.0 | 6 | 79.6 |
Rank is based on average income and unemployment rate only. Rank is based on average life expectancy.
Figure 13a
Give three pieces of evidence that the level of human welfare varies greatly between these London boroughs.
Name the borough whose average life expectancy rank differs most from the rank shown for average income and unemployment rate.
Choose your answer
Wandsworth
Hammersmith & Fulham
Lambeth
Croydon
Identify the meaning of the term inequality.
Choose your answer
poor access to resources and services
good access to resources and services
equal access to resources and services
unequal access to resources and services
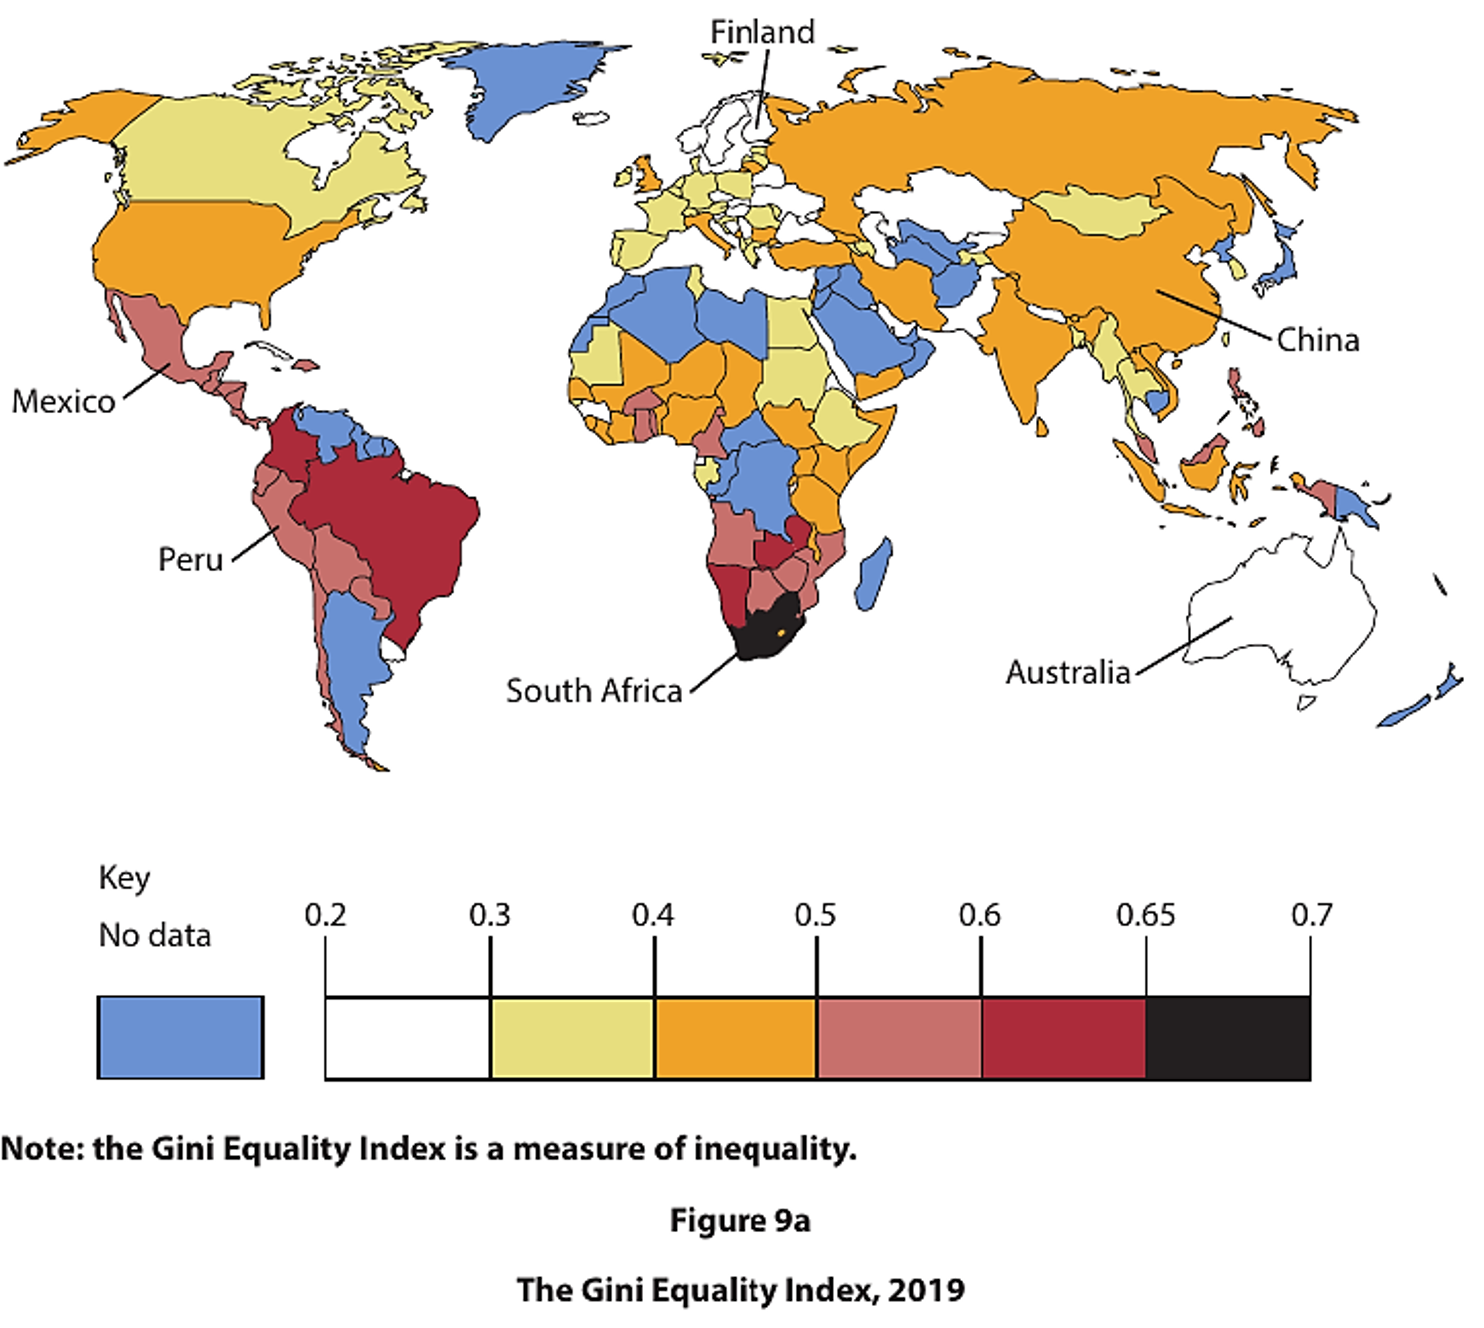
Study Figure 9a.
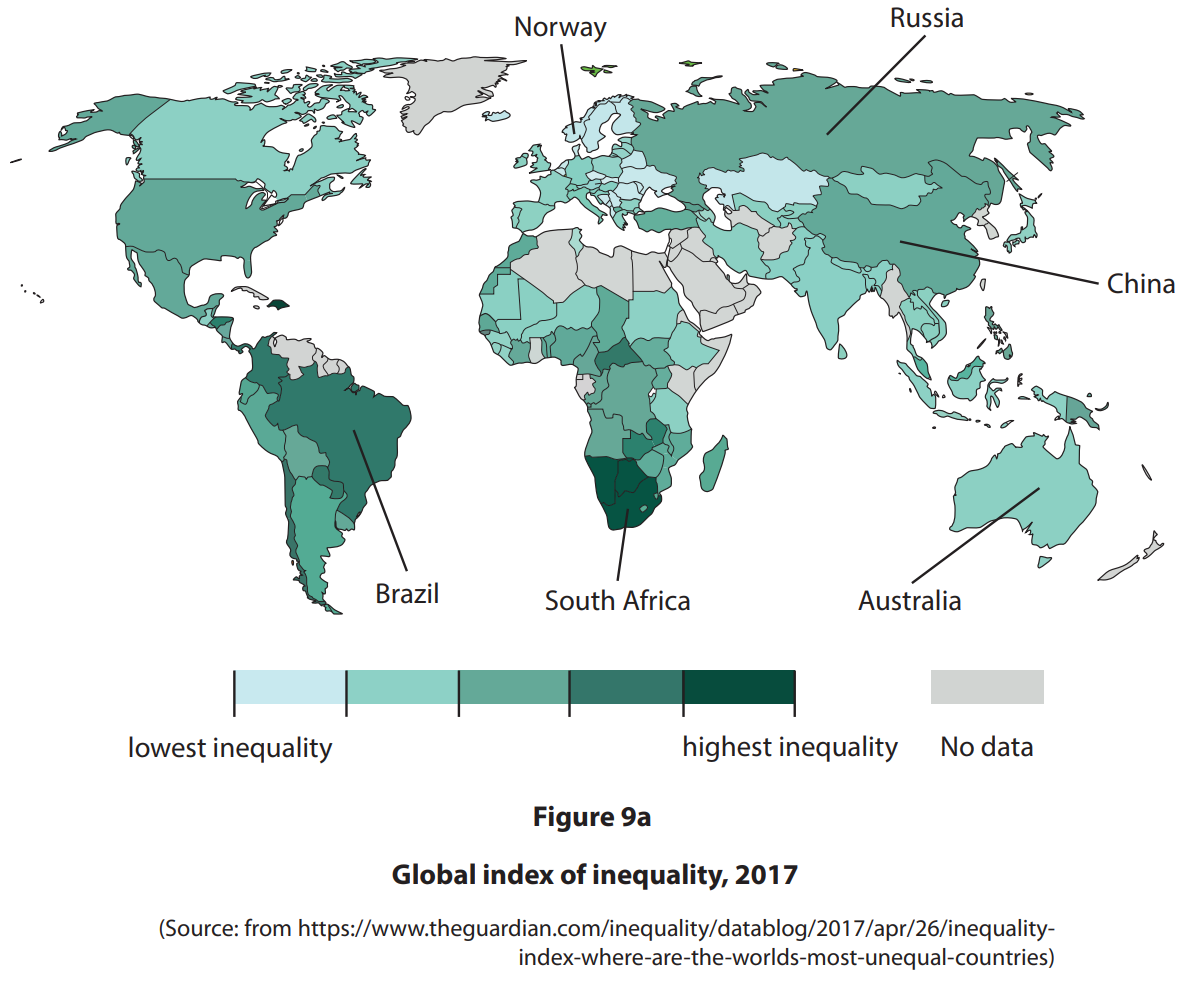
Identify two countries labelled in Figure 9a as having the highest and lowest inequality.
Highest
Lowest
Study Figure 9a.
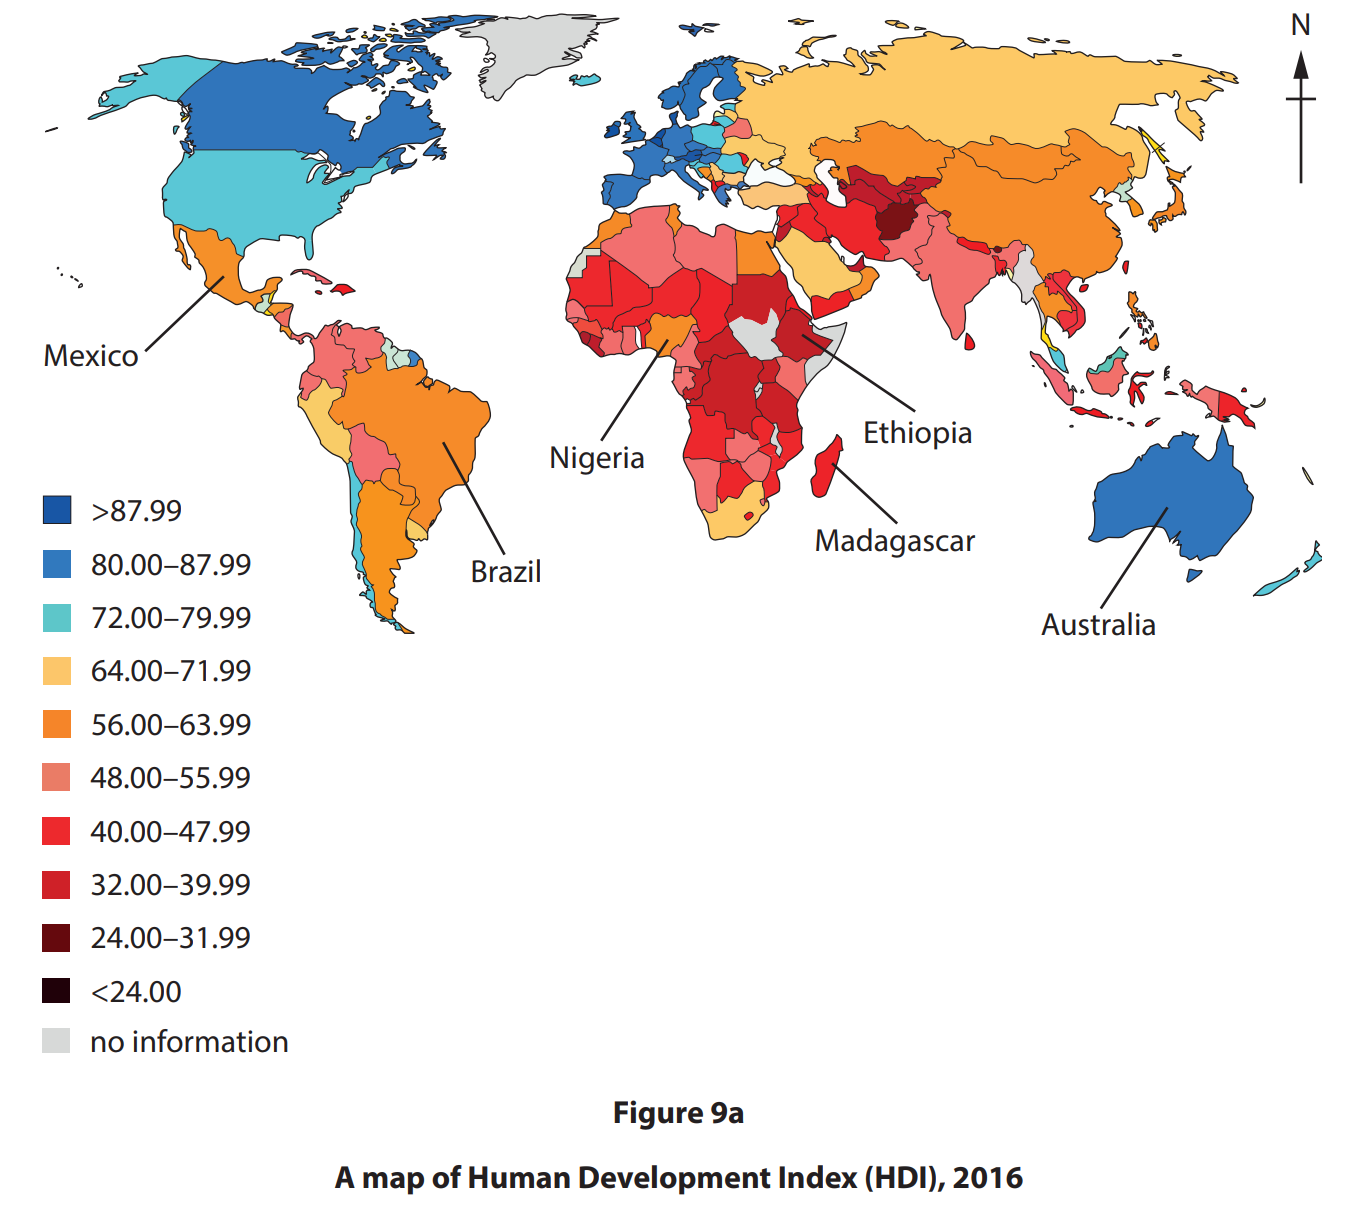
Identify two countries labelled in Figure 9a with an HDI of less than 48.00.
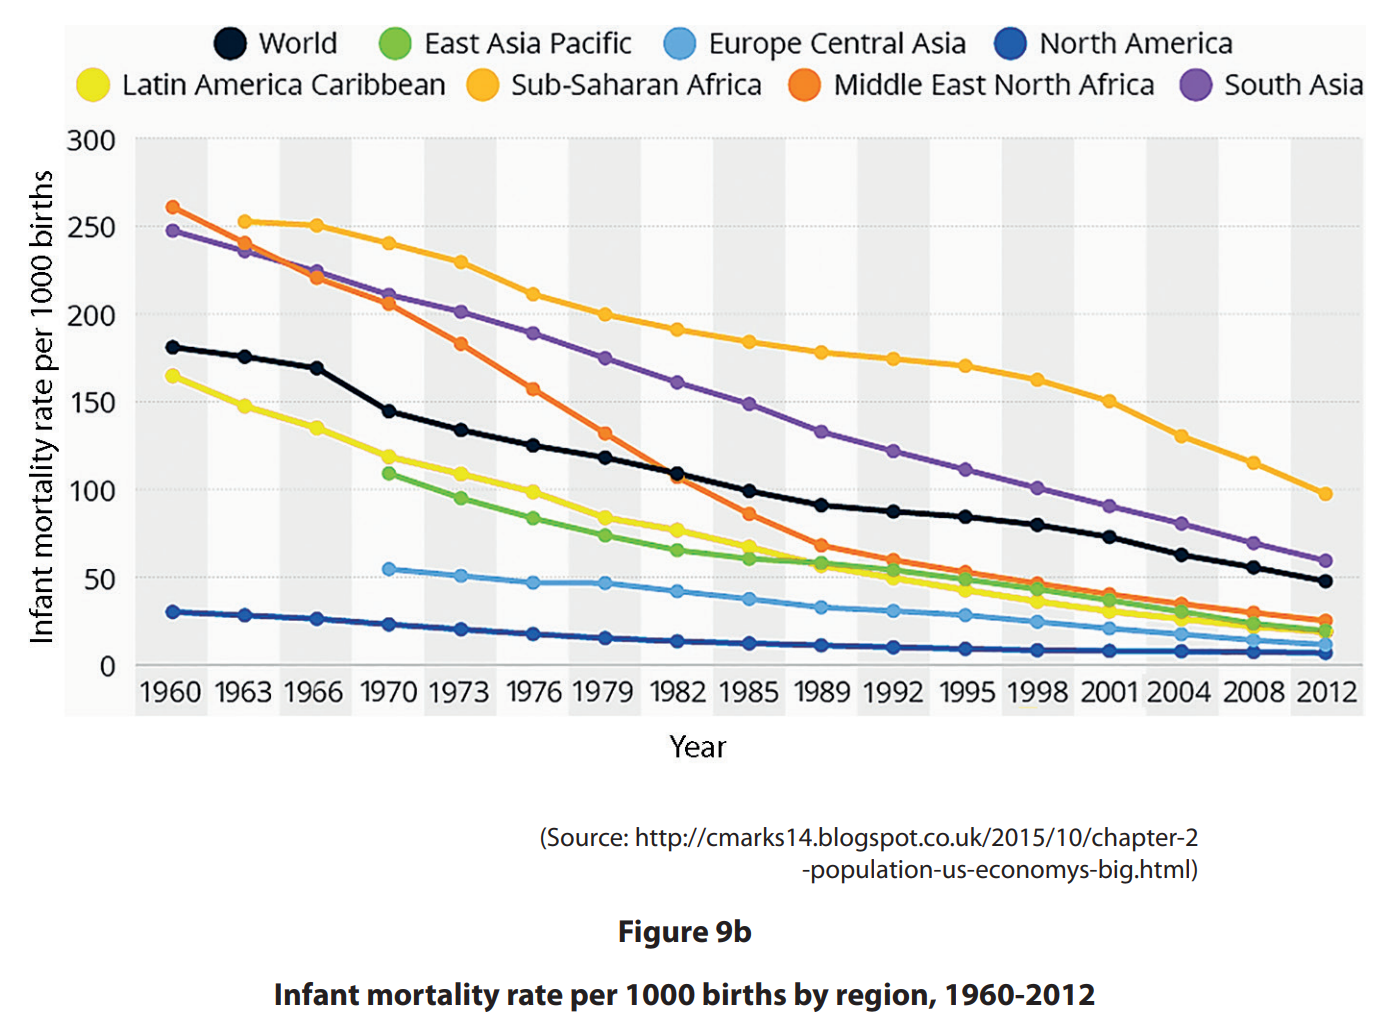
Describe the extent to which infant mortality rates have changed from 1960-2012 in Figure 9b.
State one historic factor that can affect inequality within countries.
Identify one factor that directly affects natural increase in a population.
Choose your answer
birth rate
employment
housing
manufacturing rate
Identify a reason for lower mortality rates in developed countries.
Choose your answer
improved access to retail services
improved access to healthcare services
improved access to airports
improved access to legal services
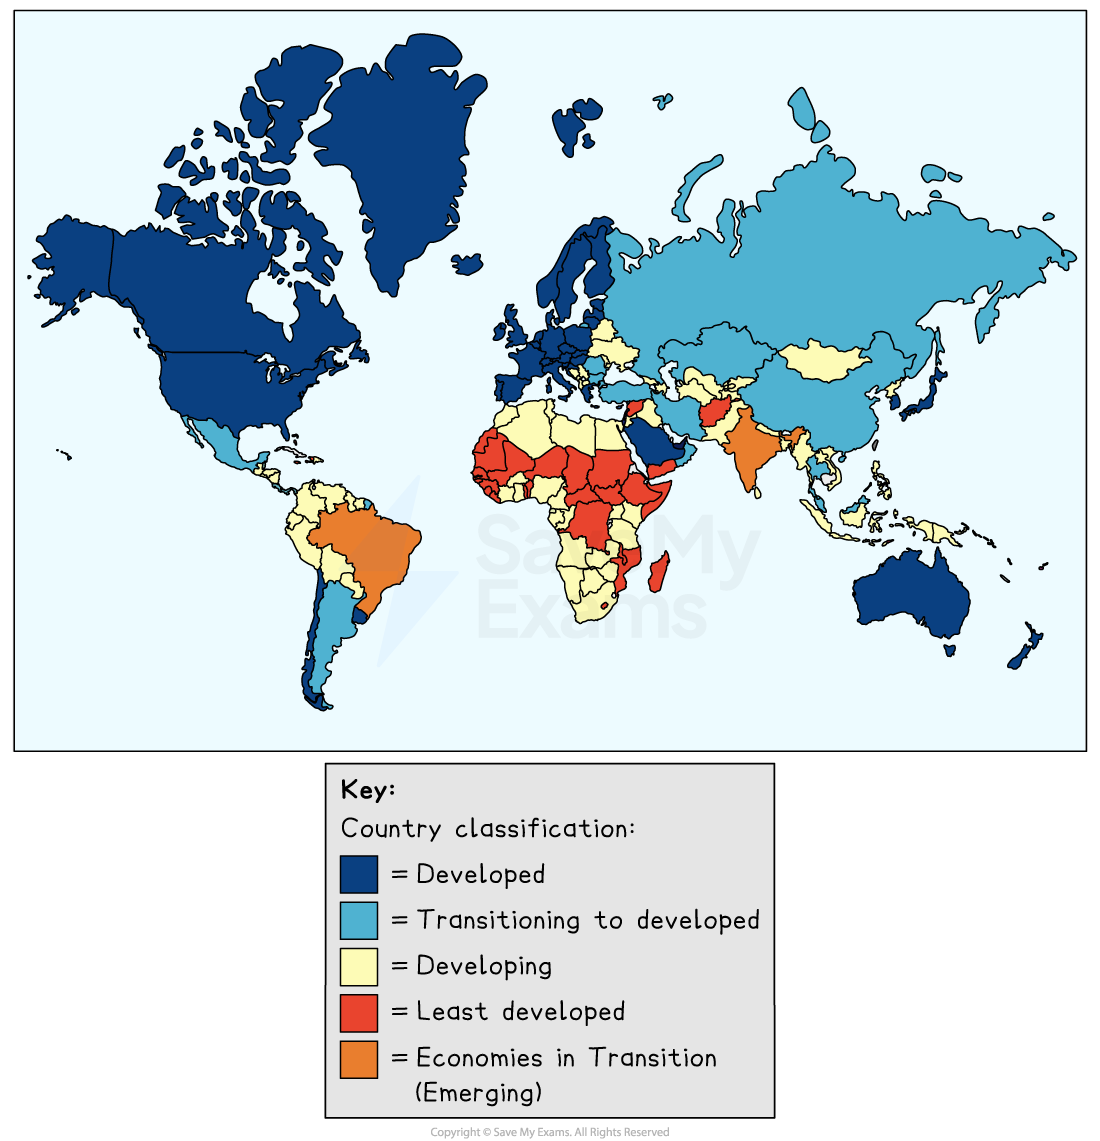
Study Figure 4a.
Describe the global pattern of uneven development.
Suggest two reasons for the pattern shown on Figure 9a.
Study Figure 9a.
Suggest two possible reasons for the pattern shown on Figure 9a.
Study Figure 9a.
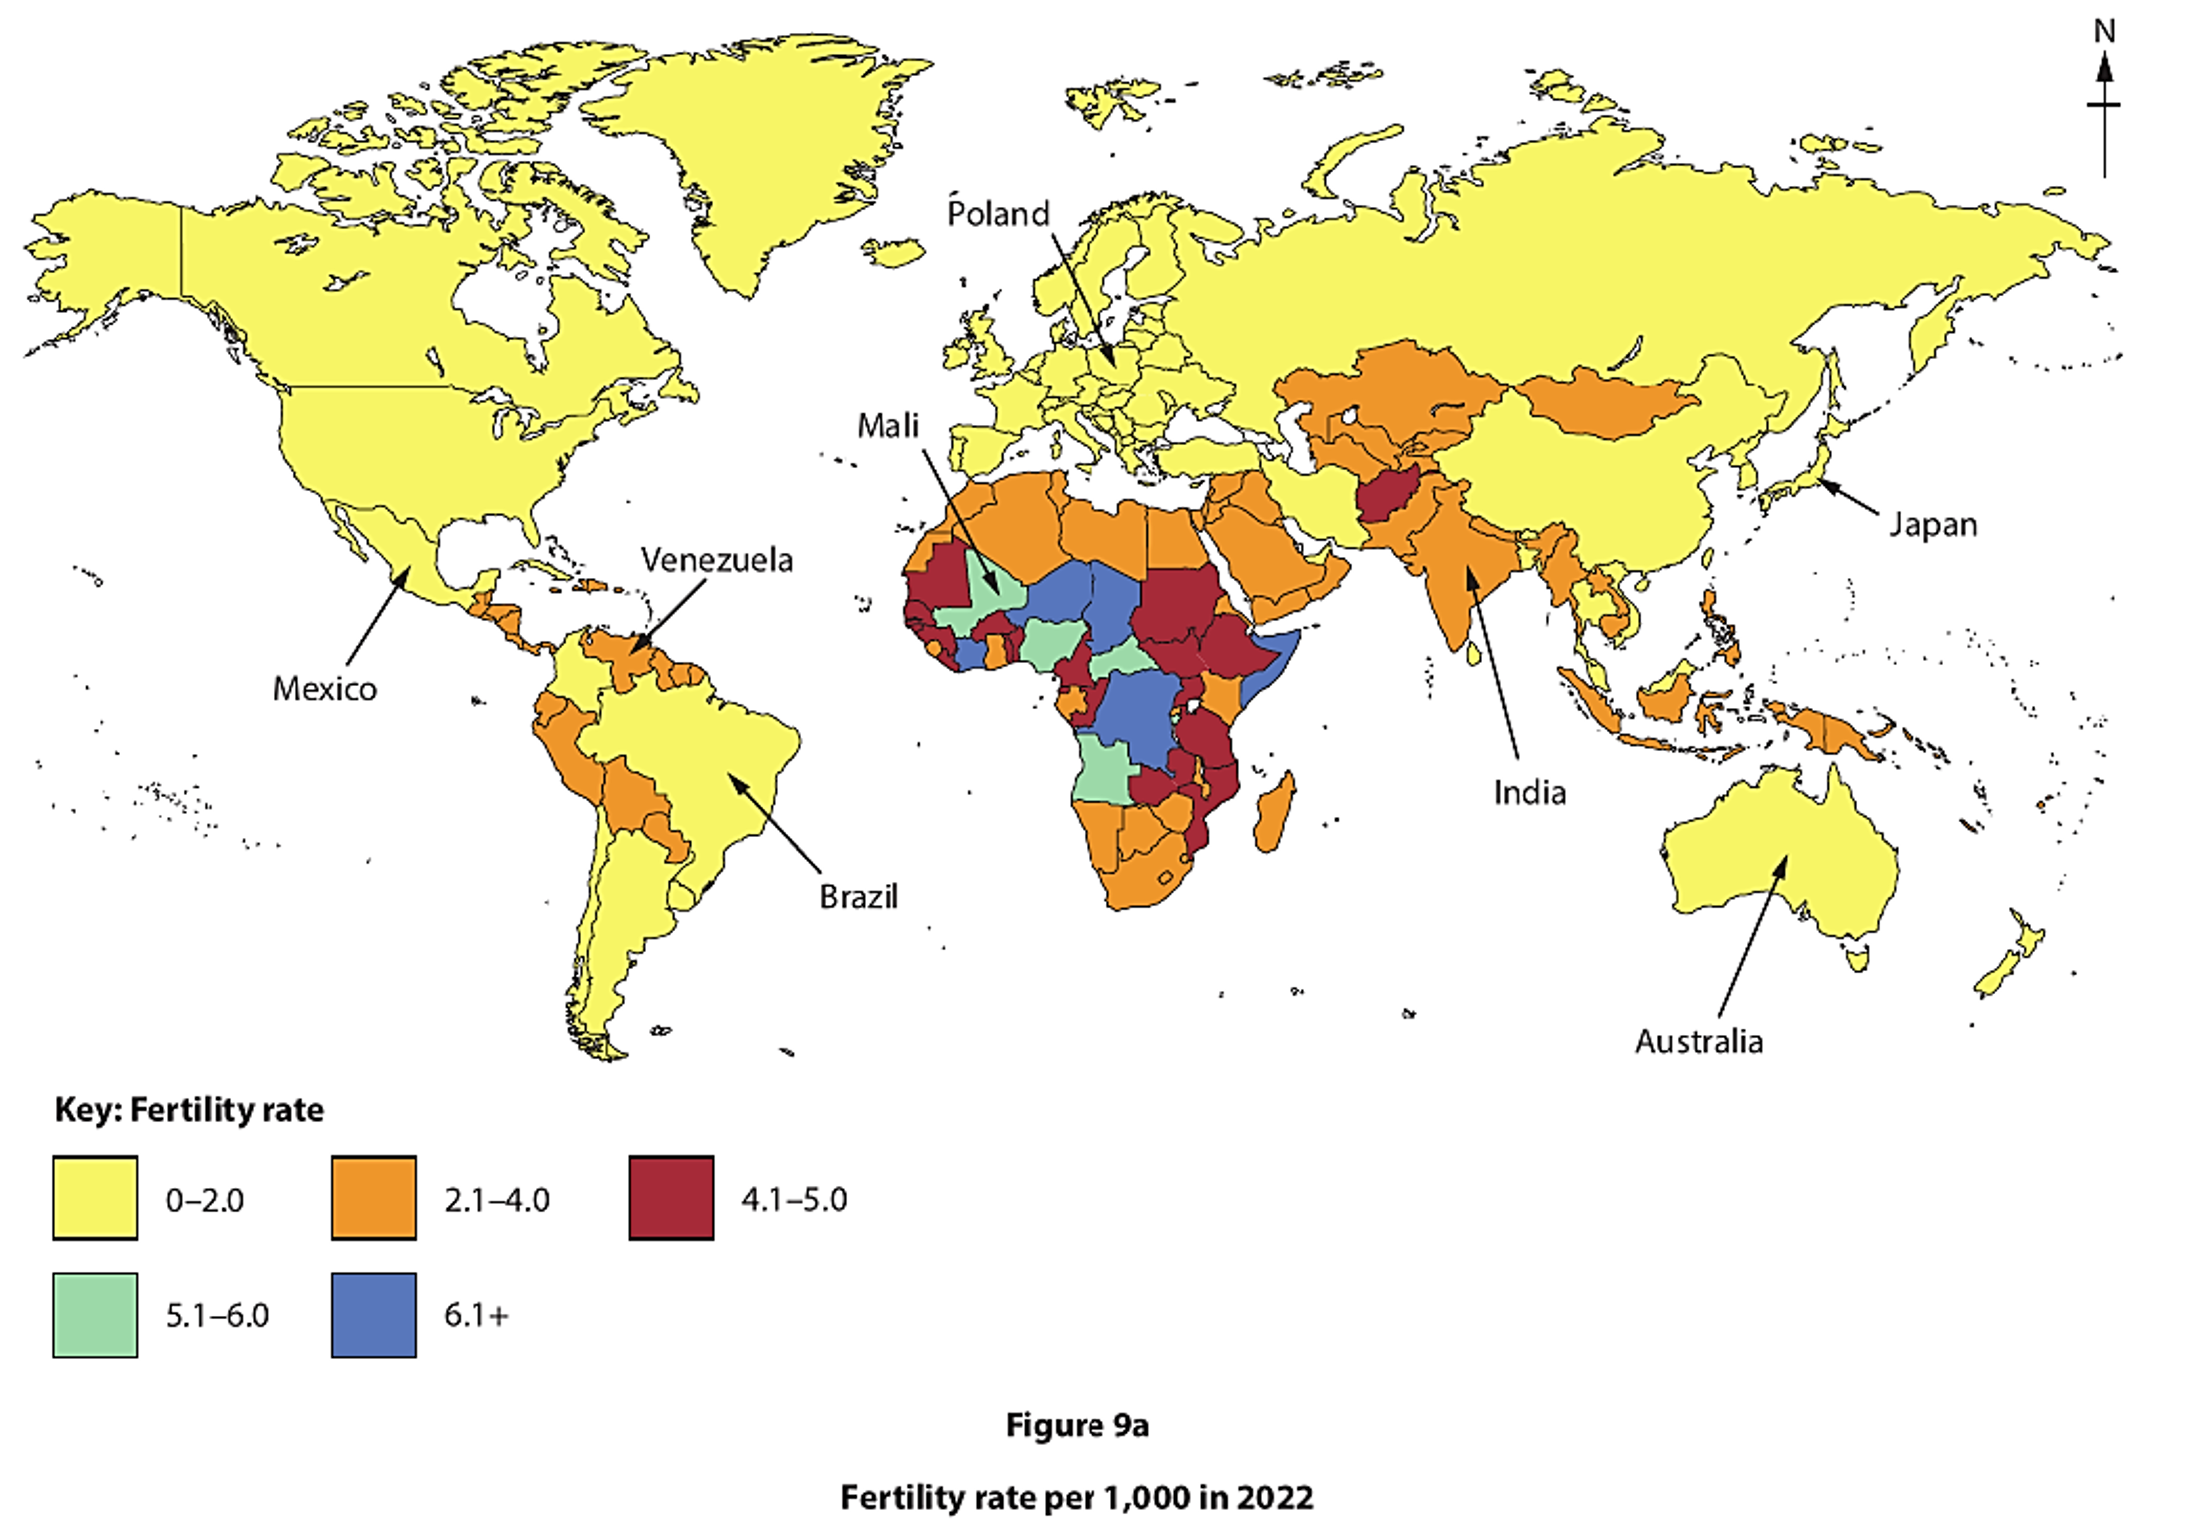
Identify the two labelled countries with a fertility rate of 2.1–4.0 per 1,000.
Suggest two reasons for the pattern shown in Figure 9a.
Explain two ways uneven development within a country can affect human welfare.
Explain two impacts of uneven development within a country.
Explain two impacts of uneven development on the quality of life within a country.
Study Figure 5a.
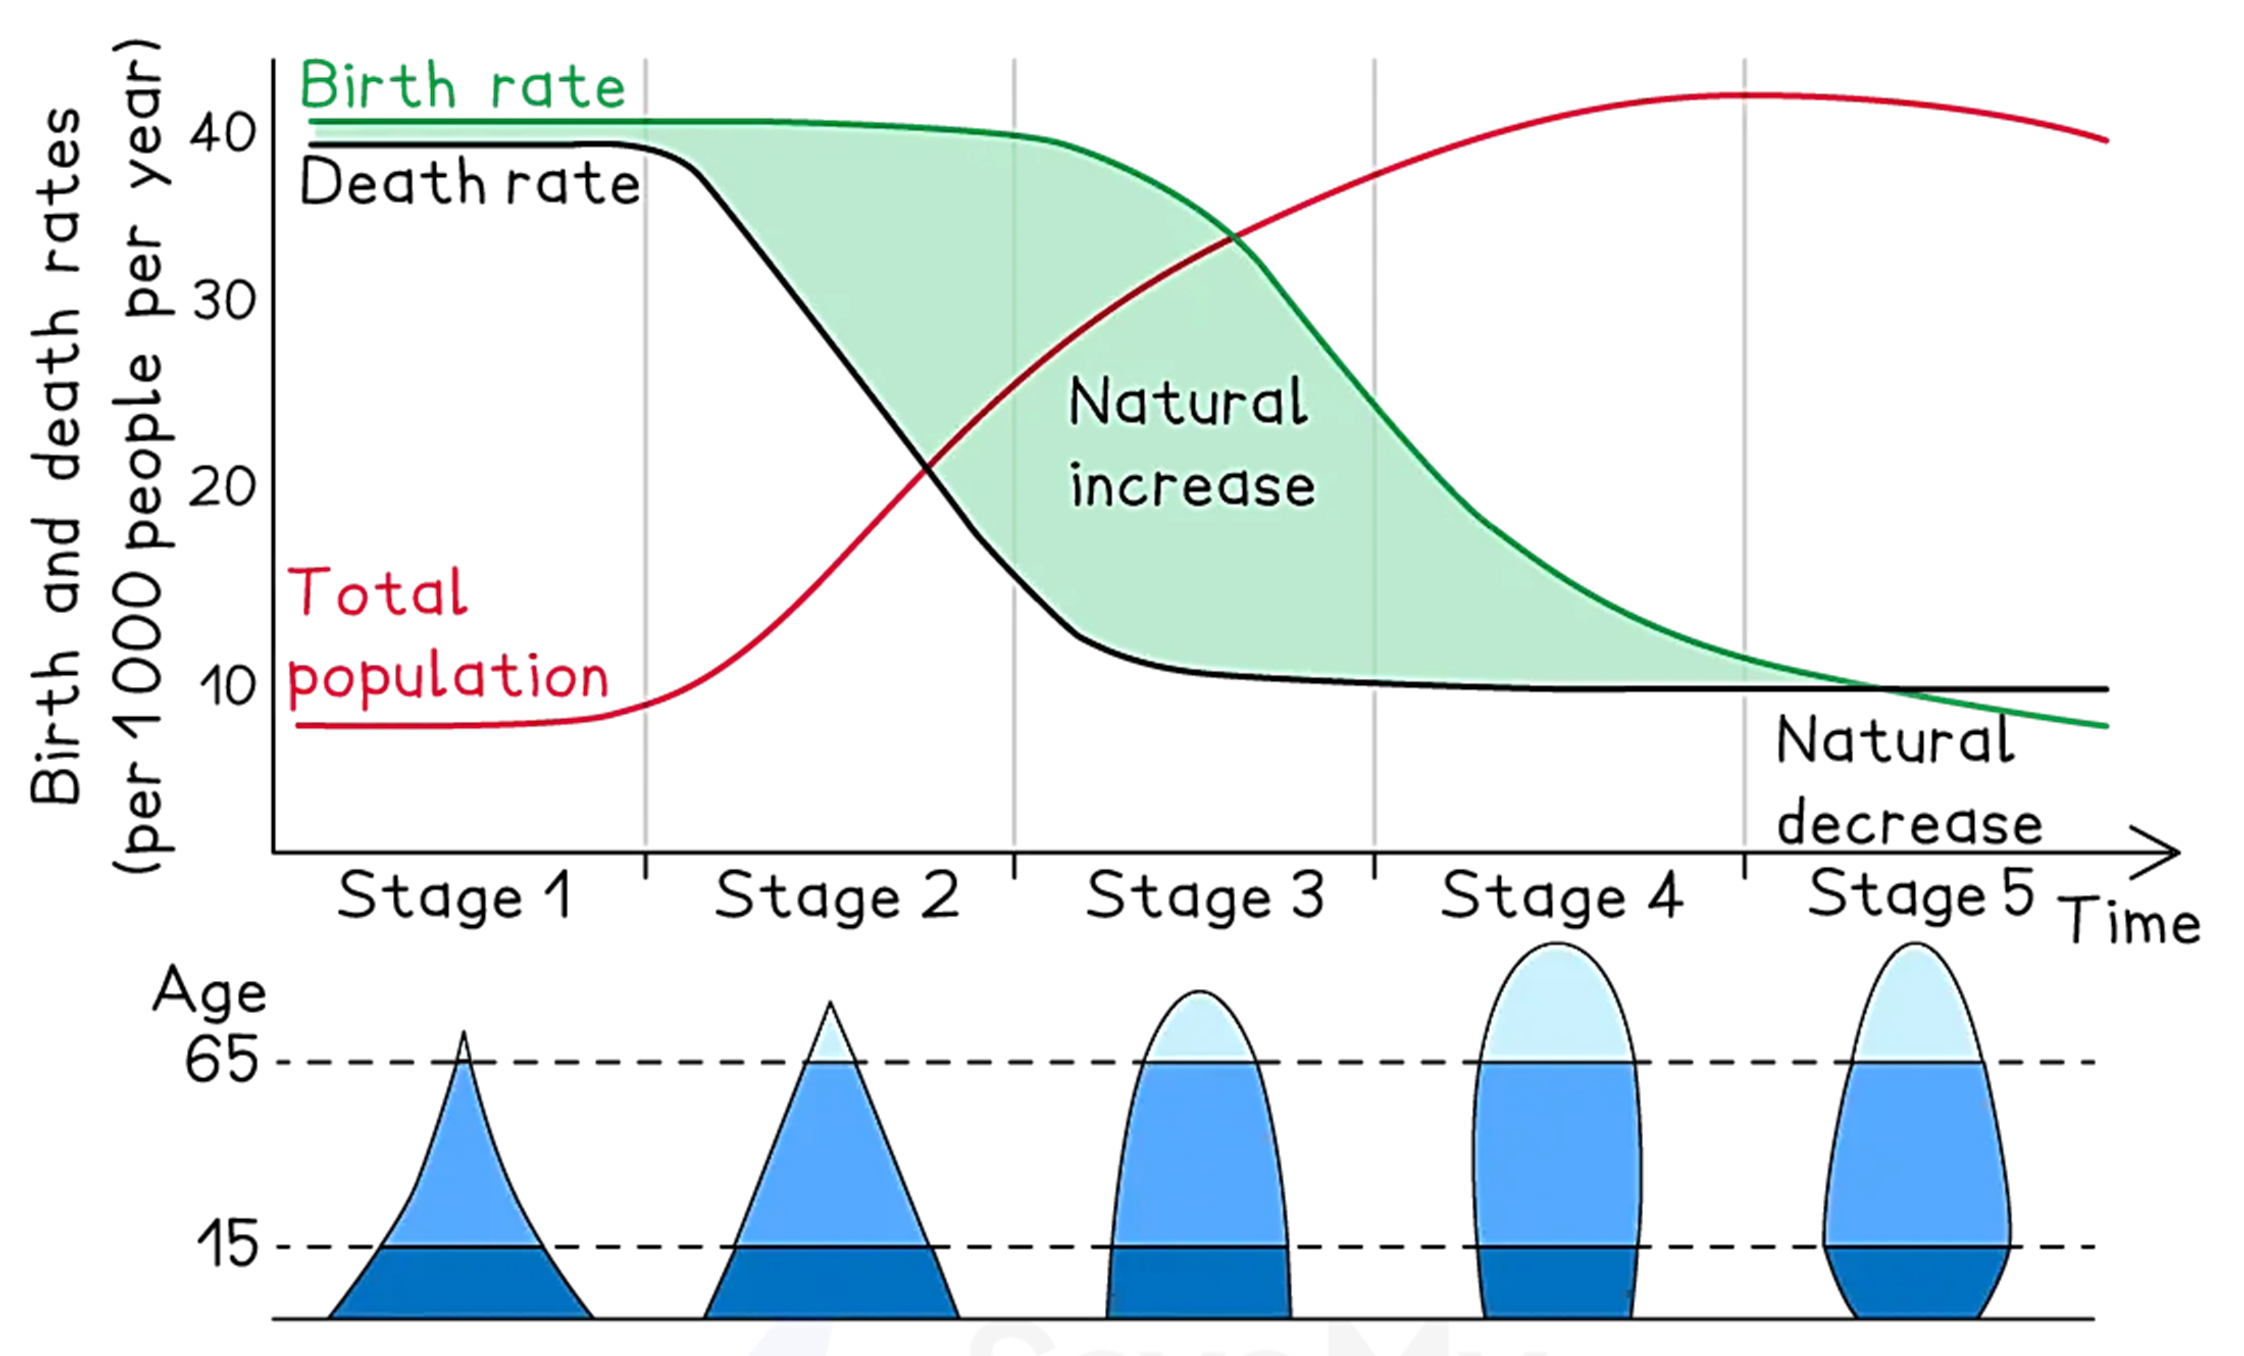
Explain how demographic data differs between countries at different levels of development.
Explain the impacts of uneven development on the quality of life of its people in developing or emerging countries.
Study Figure 9c.
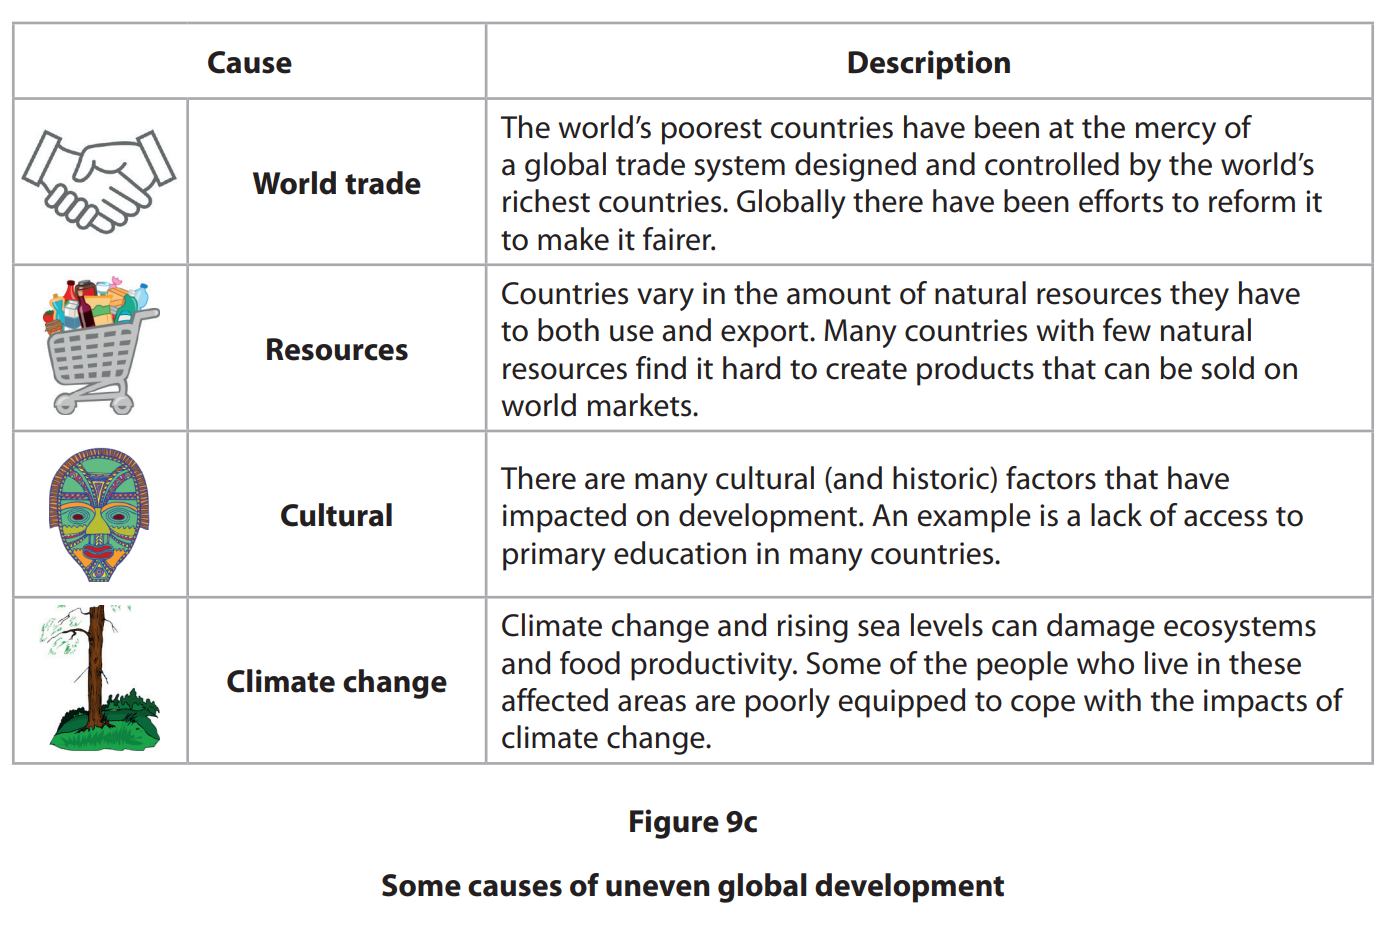
Assess the different factors that have caused uneven global development.
Discuss the view:
Improvements in human welfare are mainly driven by economic development.
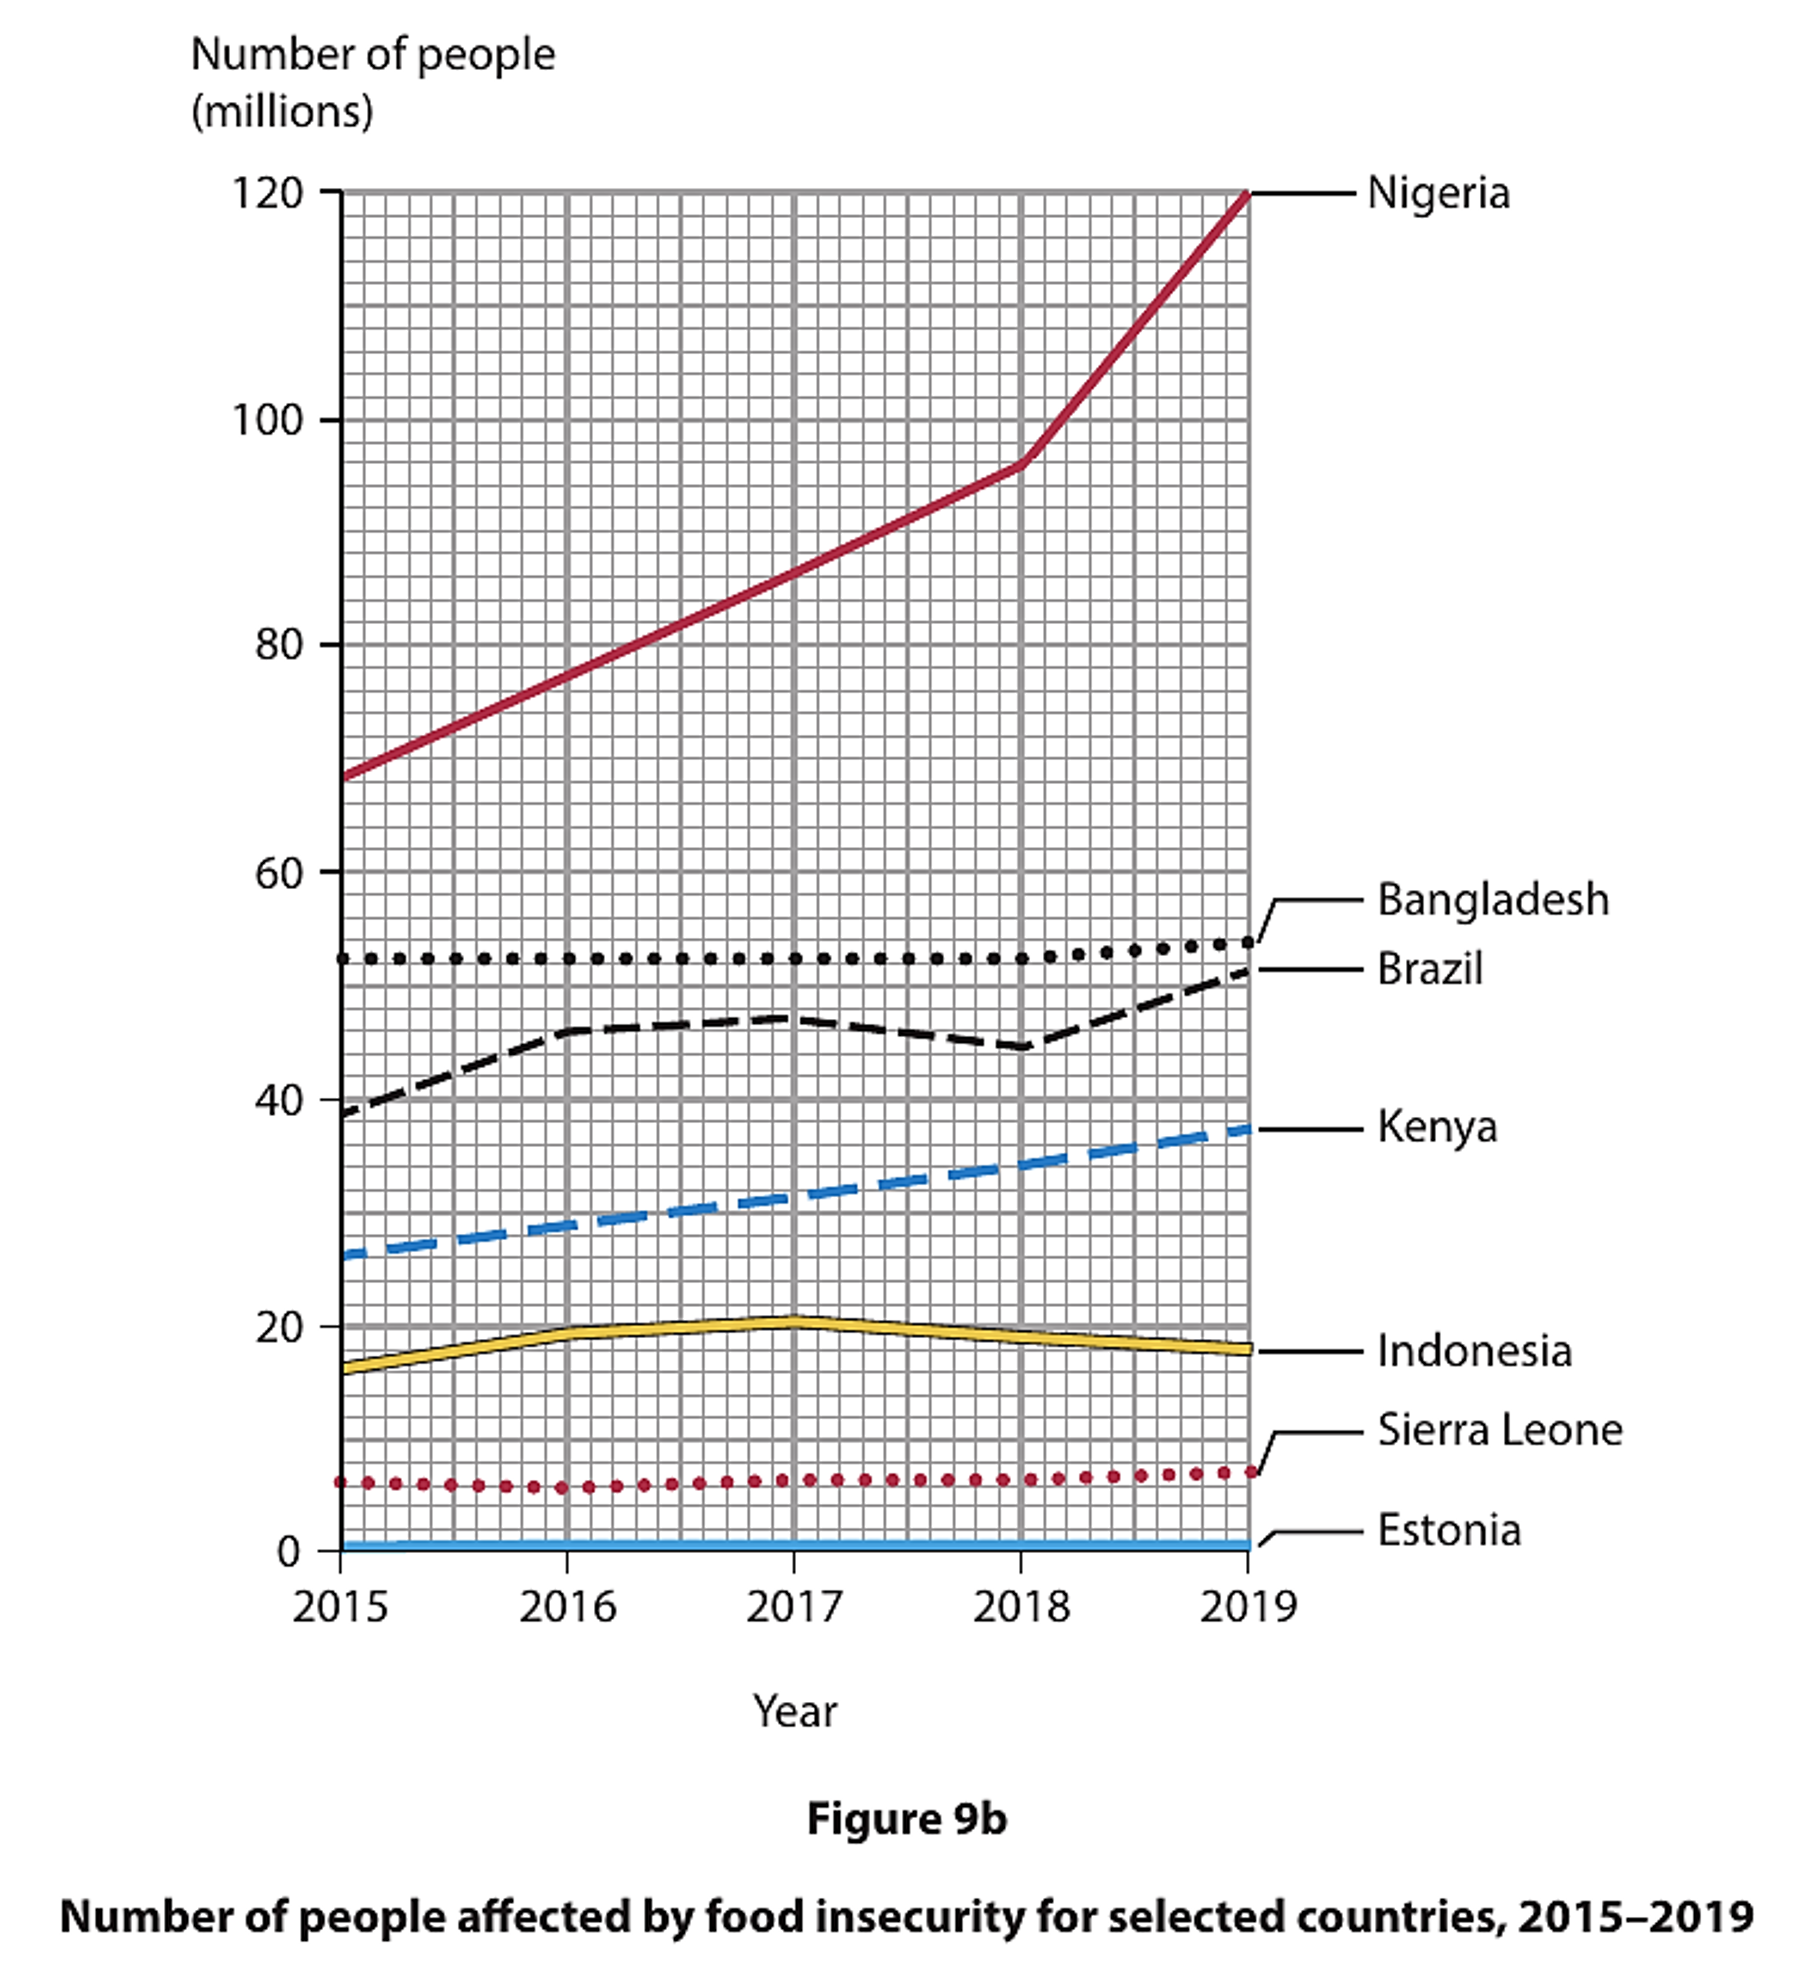
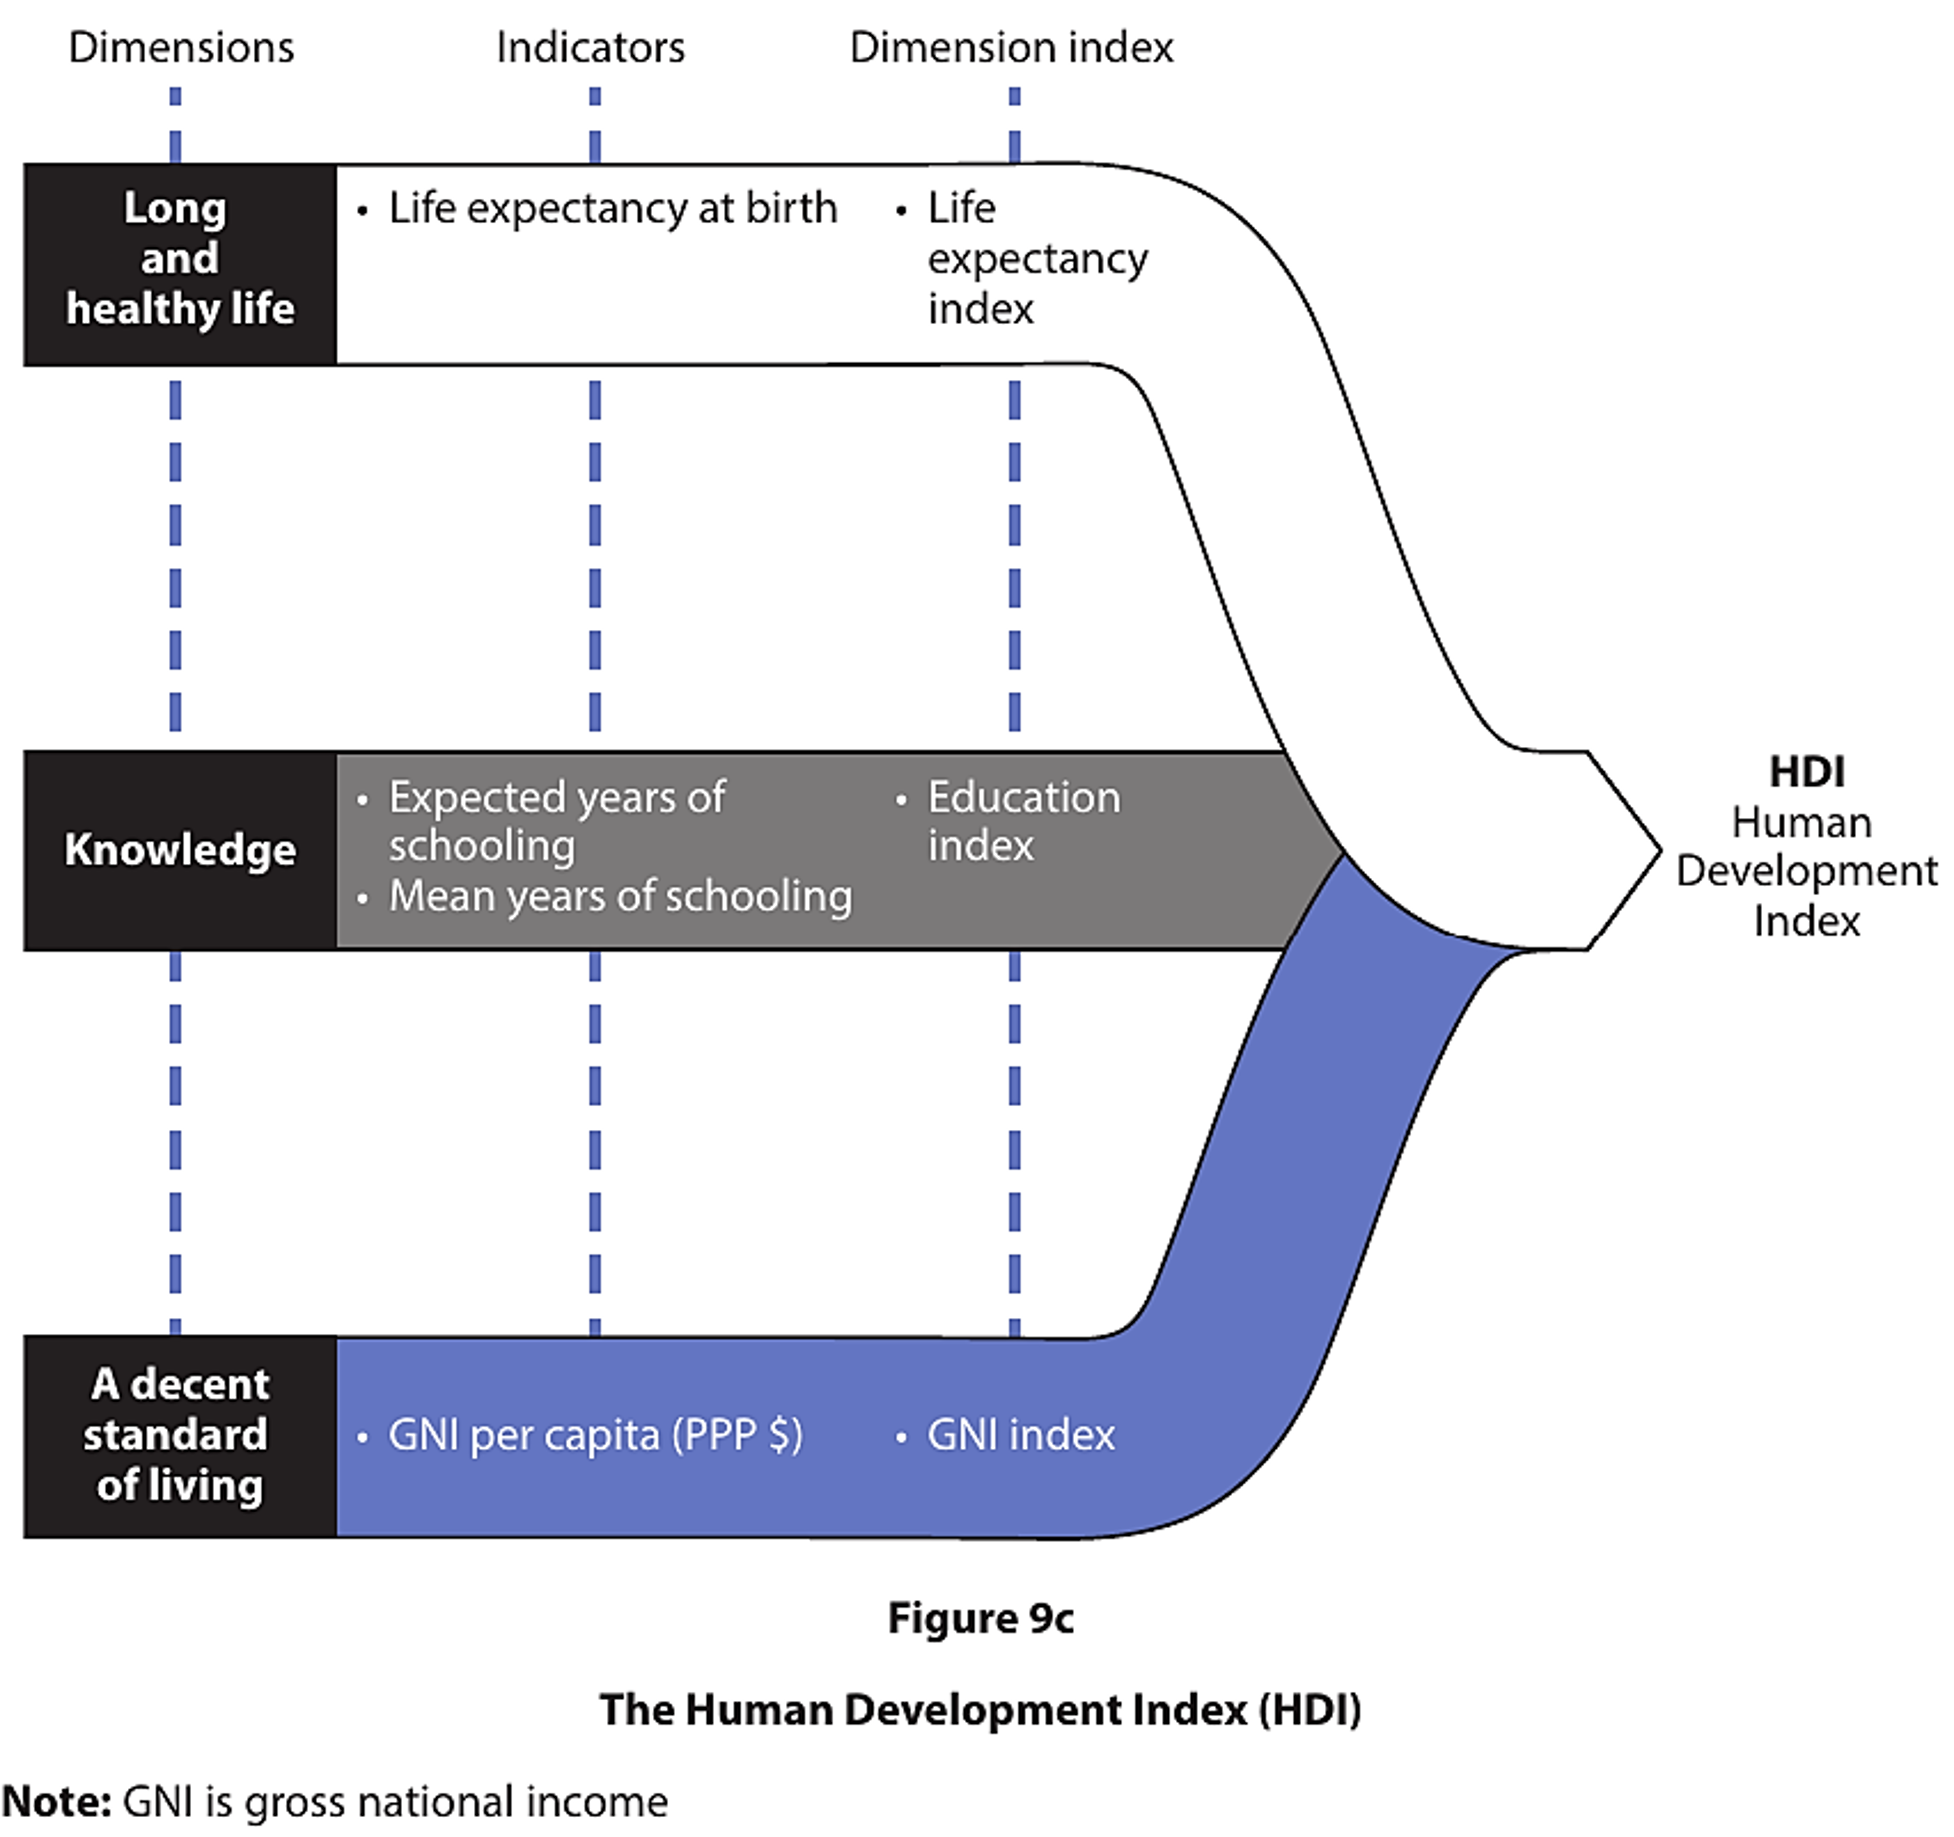
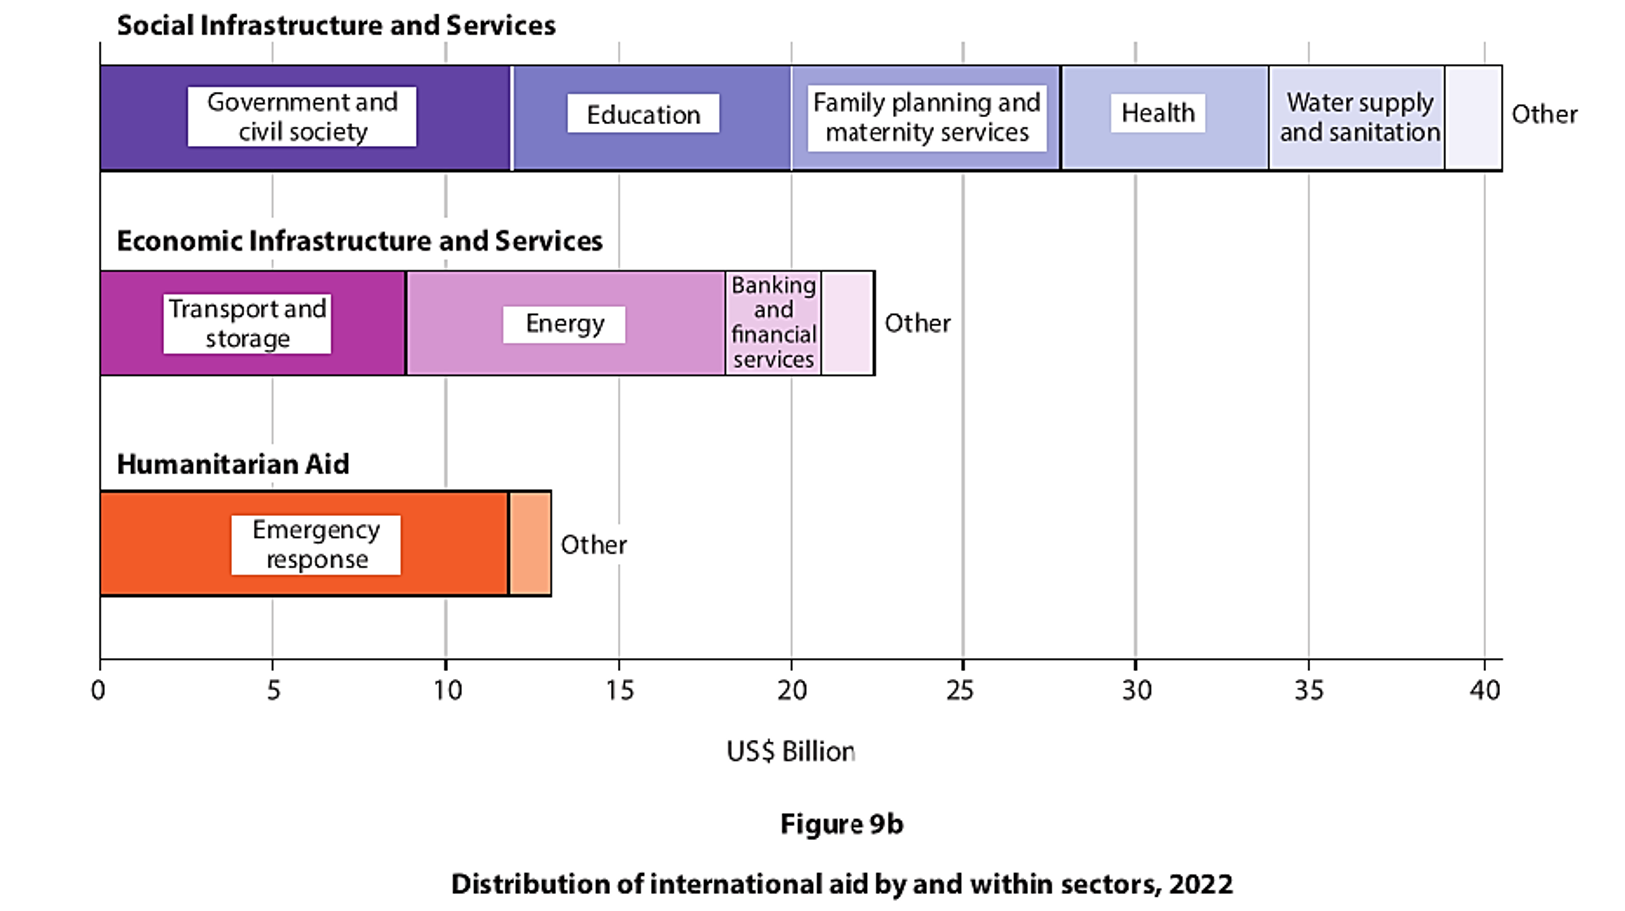
Use Figures 9b and 9c, and your own knowledge and understanding to support your answer.
You must refer to the resources in your answer.
Study Figure 9c.
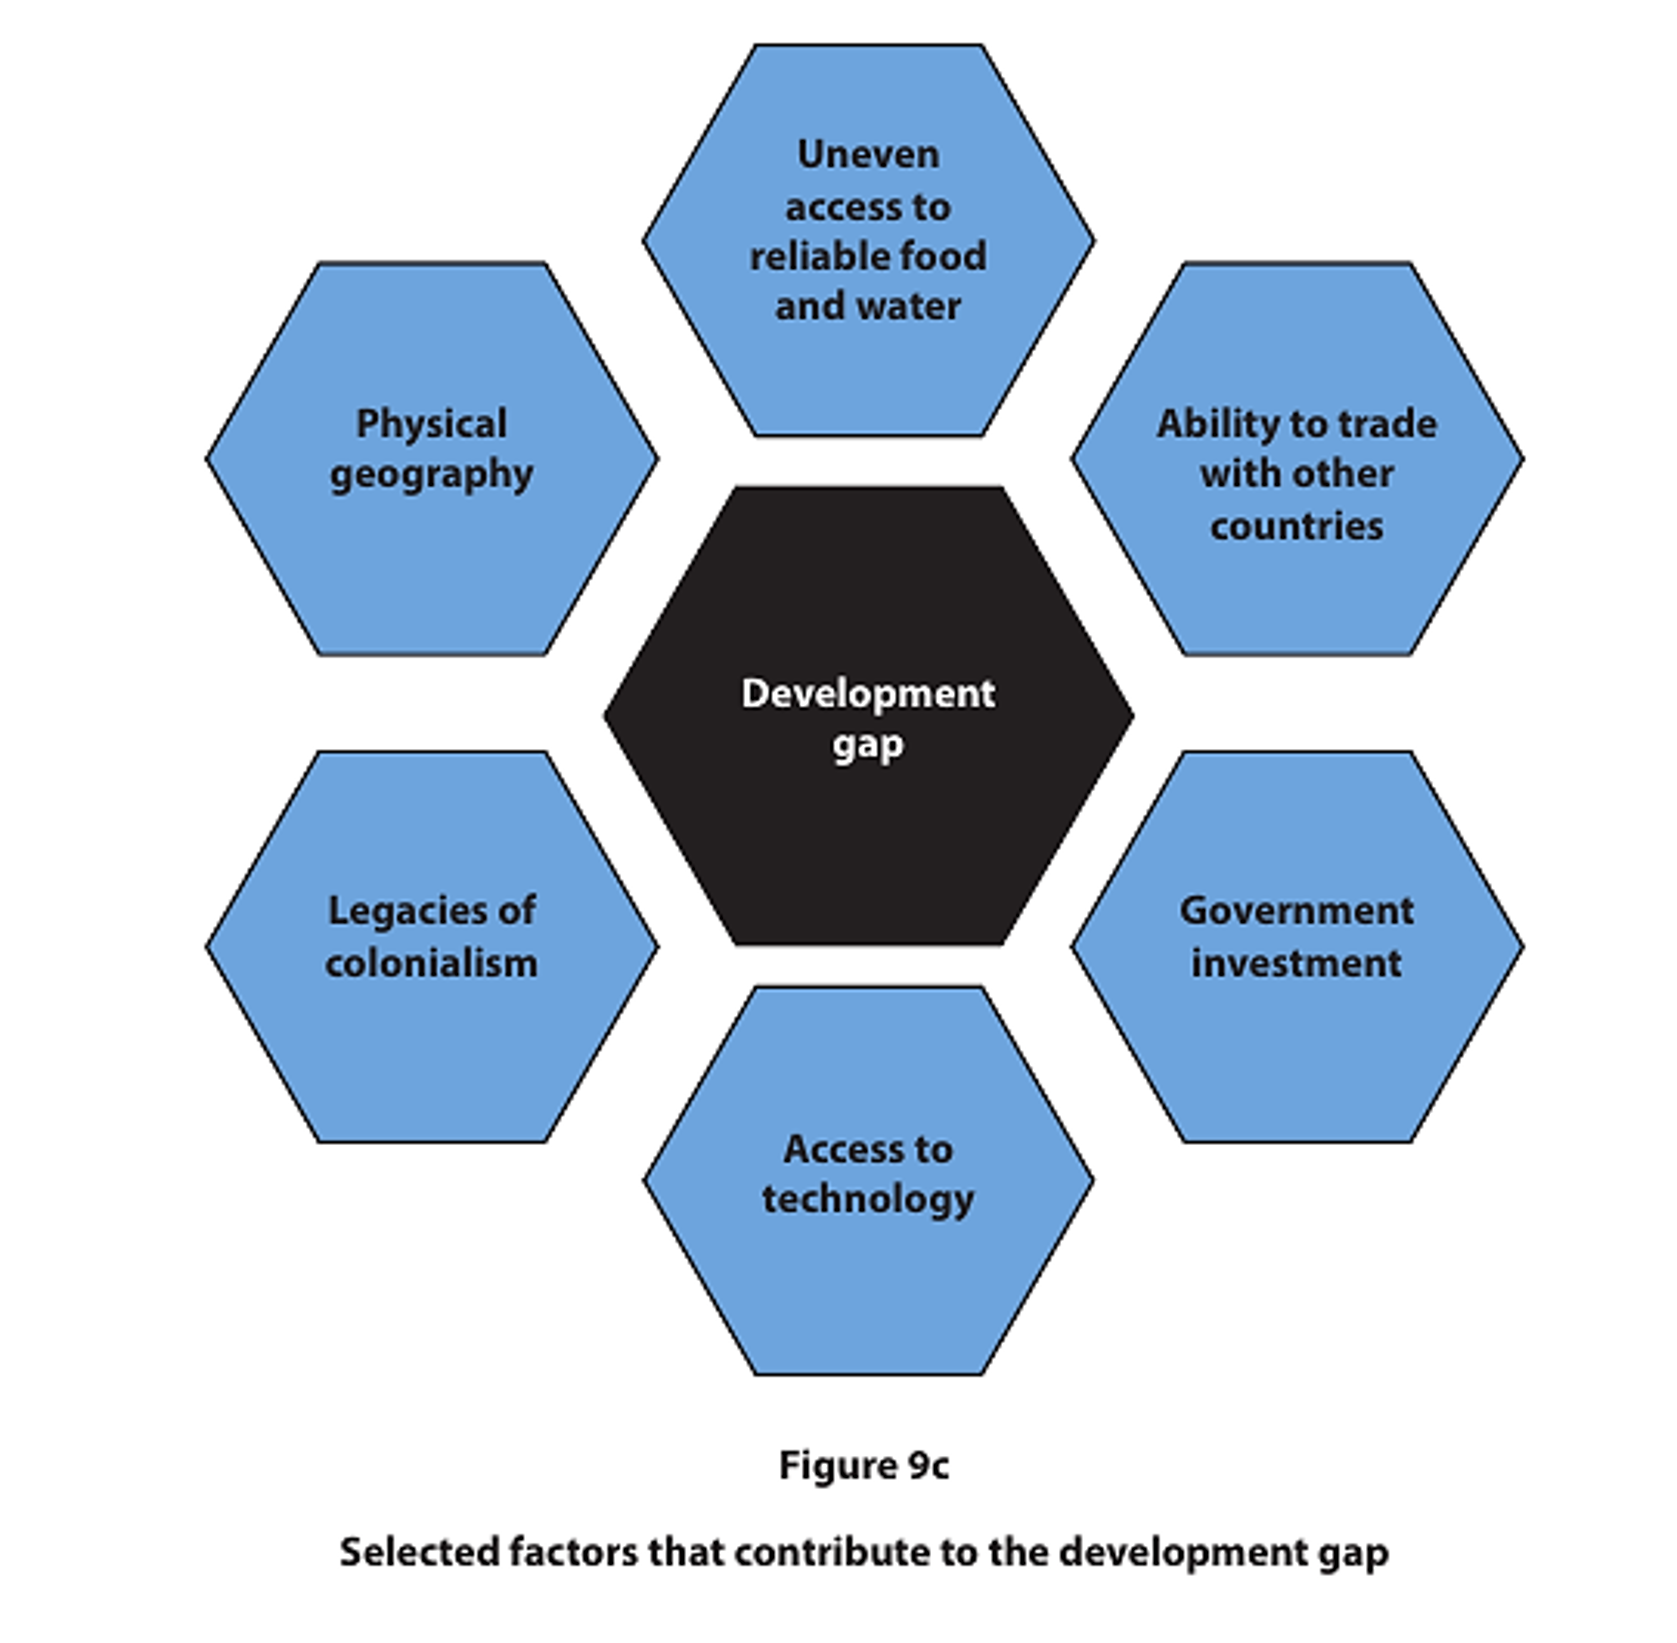
Assess factors that have contributed to the development gap.
You must refer to the resource in your answer.
Discuss the view:
Continuing uneven global development is caused by economic factors.
Use Figures 9a and 9b and your own knowledge and understanding to support your answer.
Refer to the resources in your answer.
Discuss the view:
Economic factors are more important than environmental factors in causing uneven global development.
Use Figure 9c and your own knowledge and understanding to support your answer. Refer to the resources in your answer.