16 markseasy
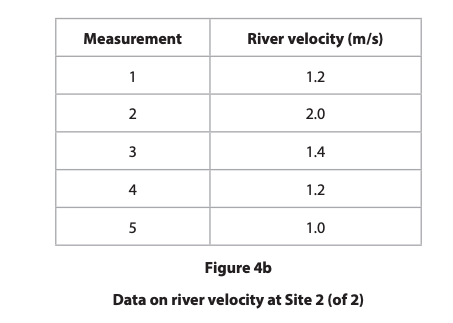
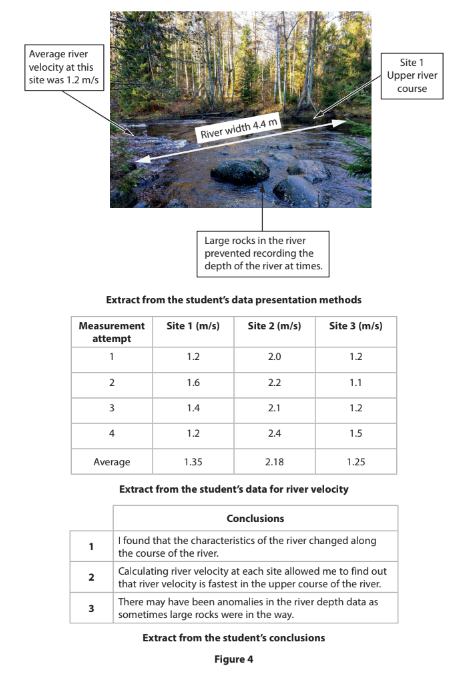
Study Figure 4a . It shows some sample data from one site on a river. A cork float was used to measure the time taken to travel between two points.
| Sample | Time taken (seconds) |
|---|---|
| 1 | 13.1 |
| 2 | 15.4 |
| 3 | 16.8 |
| 4 | 20.0 |
| 5 | 37.0 |
Figure 4a
River data collected by a group of students
(i)
Calculate the mean time taken for the cork float to travel from site A to site B
Give your answer to one decimal place.
(2 marks)
(ii)
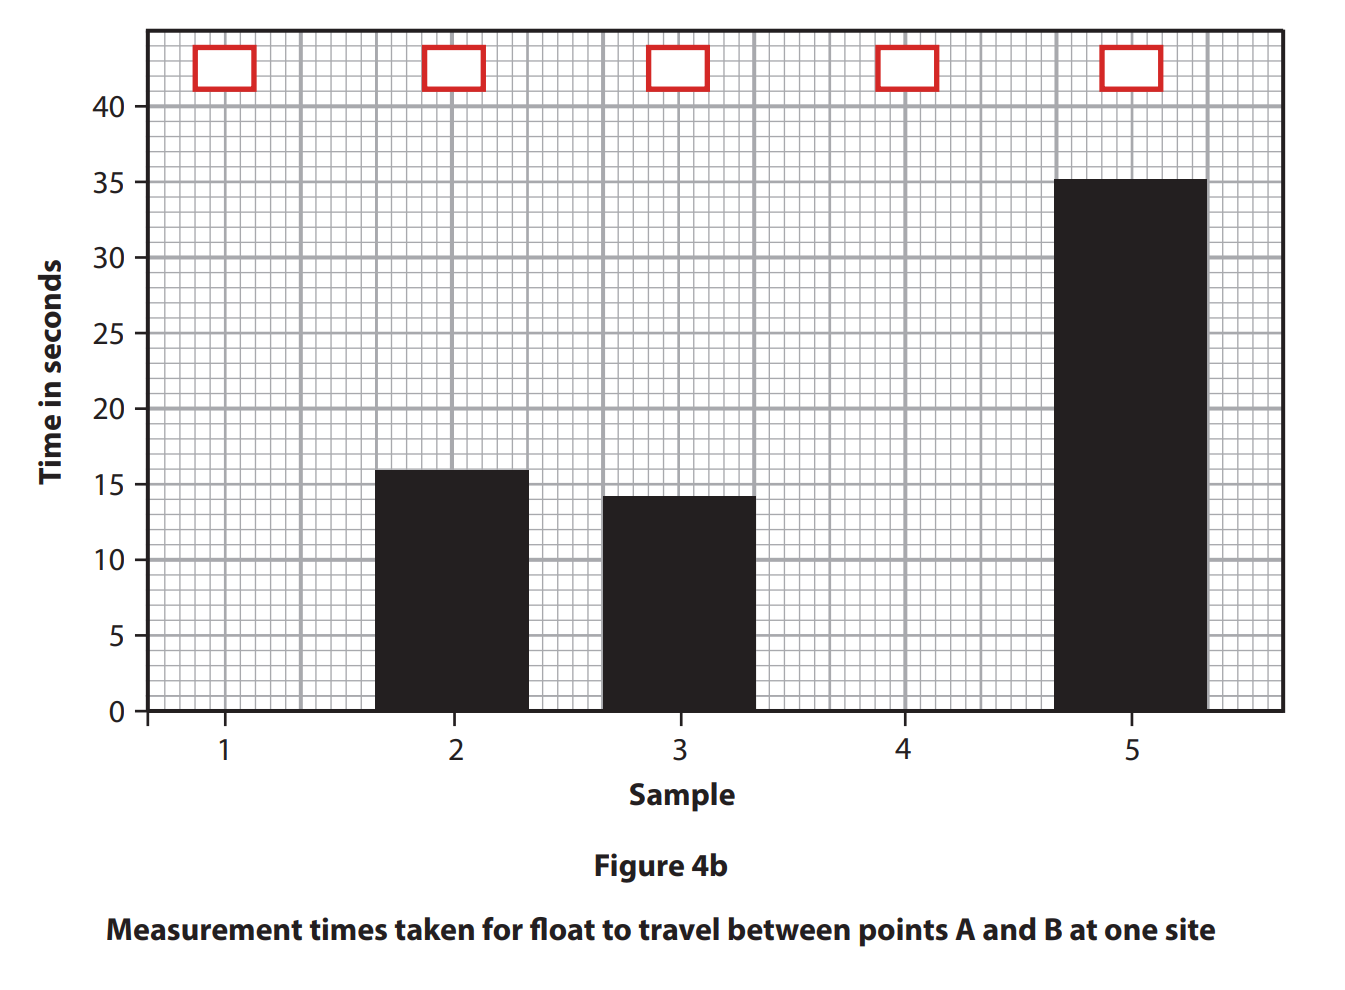
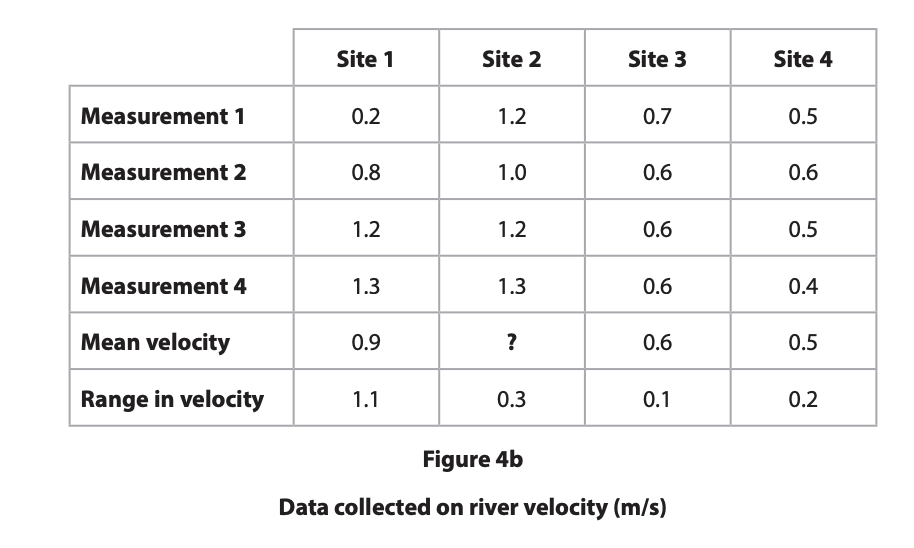
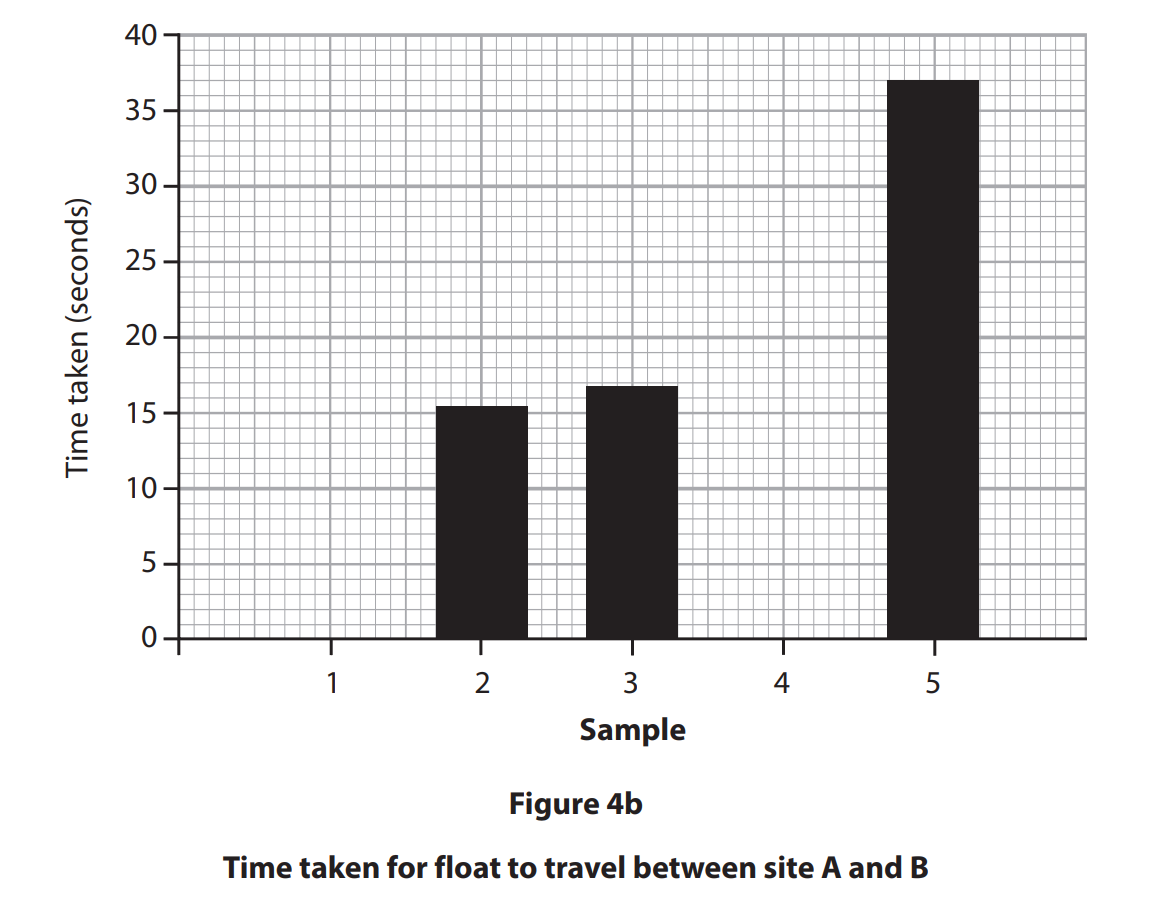
Complete Figure 4b below for samples 1 and 4 using data in Figure 4a.
(2 marks)
(iii)
Sample 5 shows an anomalous result.
Suggest one possible explanation for this
(2 marks)