14 markseasy
Evaluate
[i]
[ii] .
39 questions · 234 marks · ≈ 4 hours
Evaluate
[i]
[ii] .
Evaluate
giving your answer in terms of .
The area bounded by the curve with equation , the -axis and the vertical lines with equations and is to be found.
Write down an integral that would find this area.
Evaluate your integral from part [a] and hence find the area described above.
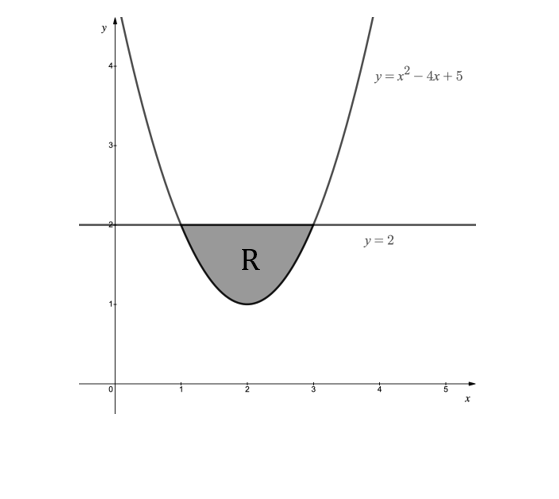
The diagram below shows the graph of
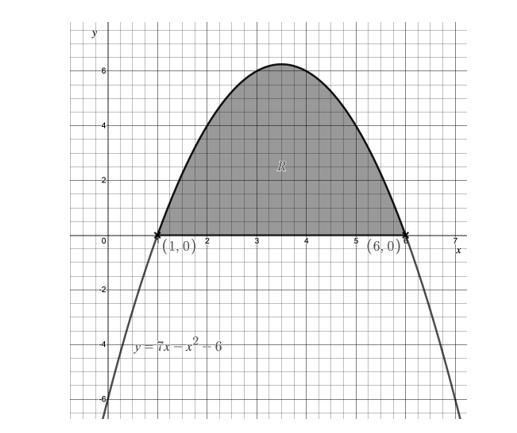
Find the shaded area, giving your answer as a fraction in its simplest terms.
The diagram below shows the graph of
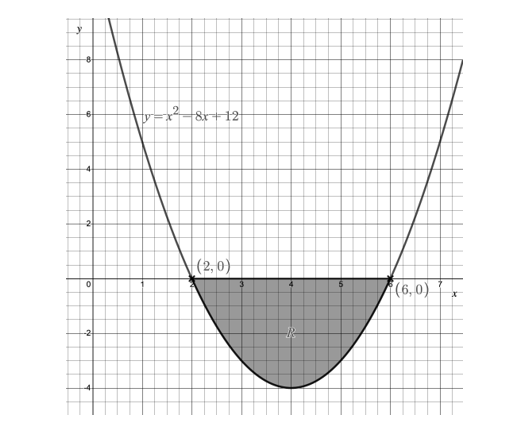
Find the shaded area marked , giving your answer as a fraction in its simplest form.
Simplify .
The diagram below shows the graphs of and .
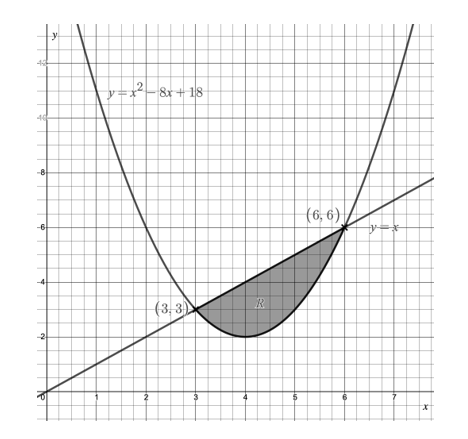
Find the shaded area marked , giving your answer as a fraction in its simplest terms.
A student is estimating the area bounded by the curve , the -axis and the lines .
The student intends to estimate the area by using trapezia of equal width.
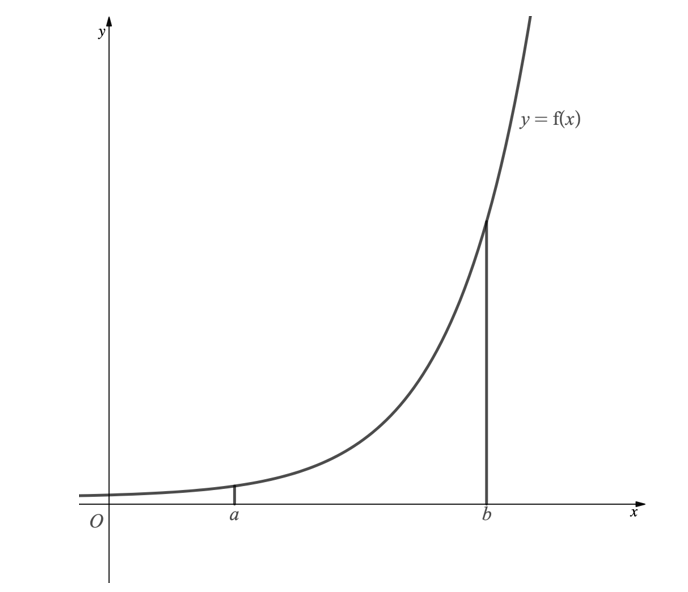
Add to the diagram above to show how the student can use 4 trapezia to estimate the area.
The graph of is shown below.
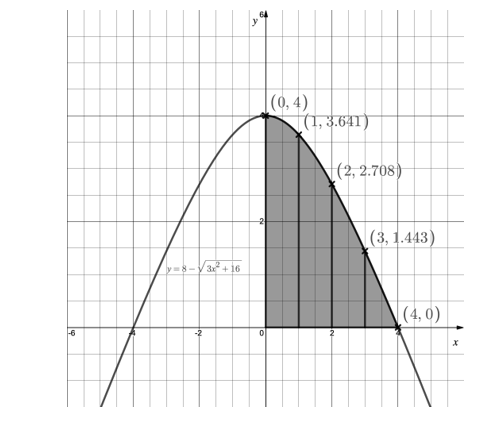
Use the trapezium rule, with four strips (such that , to estimate the shaded area. You may use the values on the graph to help.
State whether the estimate in part [a] is an under-estimate or an over-estimate, giving a reason for your answer.
The diagram below shows part of the graph with equation .
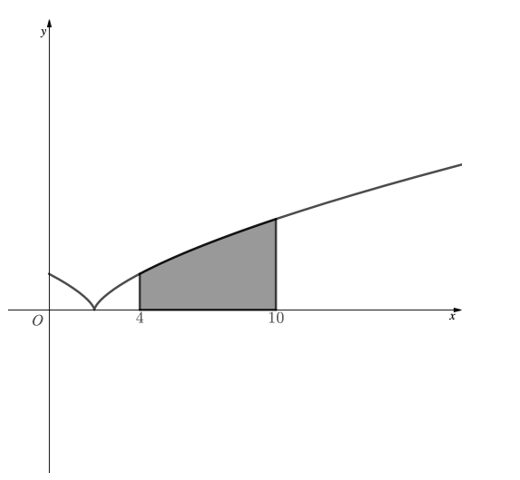
The trapezium rule is to be used to estimate the shaded area of the graph which is given by the integral
[i] All of the values in the table below will be used in the trapezium rule. Write down the number of ordinates that will be used, the number of strips and the width of each strip.
| 4 | 5 | 6 | 7 | 8 | 9 | 10 |
|---|---|---|---|---|---|---|
| 1.59 | 2.08 | 2.52 | 2.92 | 3.30 | 3.70 | 4.00 |
[ii] Apply the trapezium rule, using the values above, to find an estimate of the shaded area.
[iii] State, with a reason, whether your answer to part [ii] is an over-estimate or an under-estimate.
Given
find the value of the positive constant .
Evaluate
The diagram below shows part of the graph of .
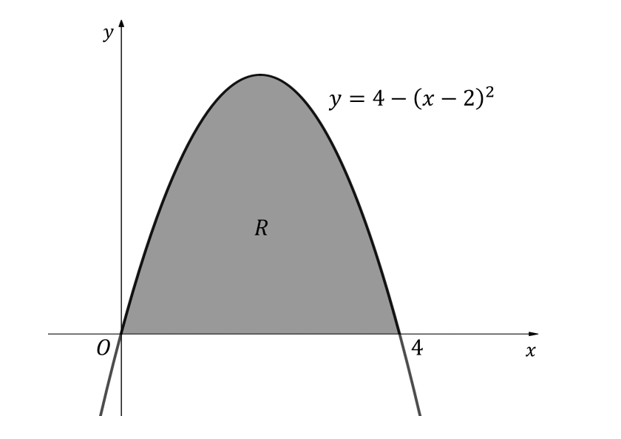
Write down the values of where .
Show that
Evaluate
Write down the area of the region labelled .
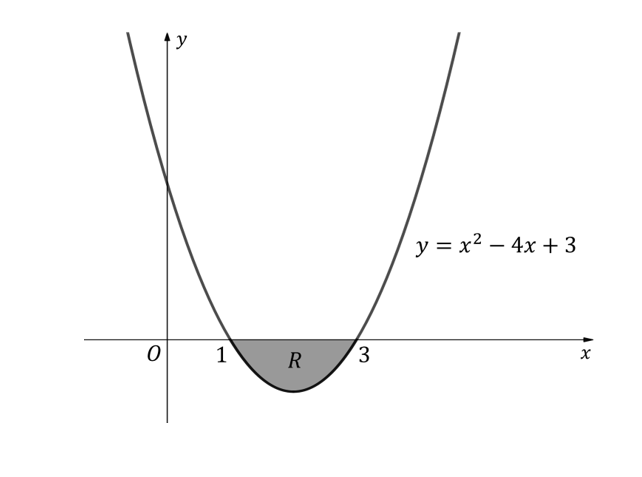
The diagram below shows part of the graph of .
Find the area of the shaded region labelled .
Find the -coordinates of the intercepts of the line with equation and the curve with equation .
Evaluate
The diagram below shows the graphs of and . Find the exact area of the shaded region .
The diagram below shows the graphs of the line and the curve .
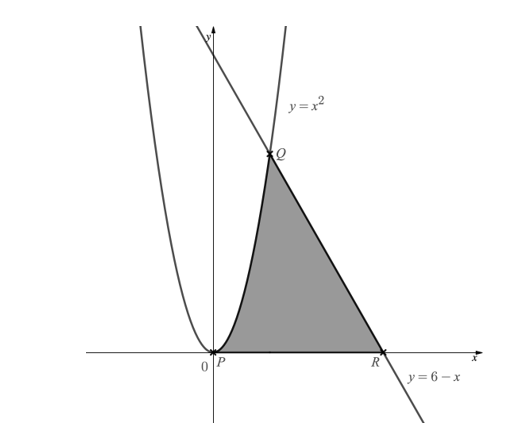
Work out the -coordinates of the points labelled .
Work out the area of the shaded region.
The diagram below shows a sketch of the curves with equations
and
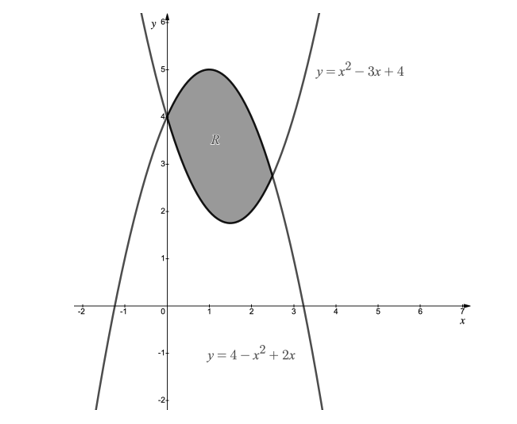
Find the -coordinates of the intersections of the two graphs.
Show that the area of the shaded region labelled is given by
Use calculus to find the area of the shaded region labelled .
Use the two diagrams below to show how rectangles can be used to give an upper and lower bound when estimating the area under a curve using the trapezium rule.
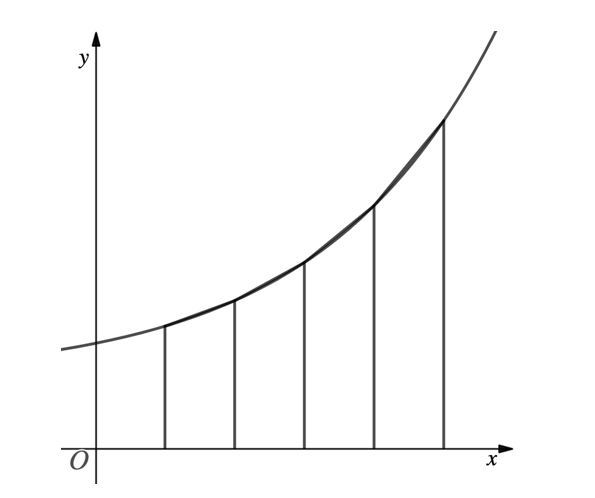
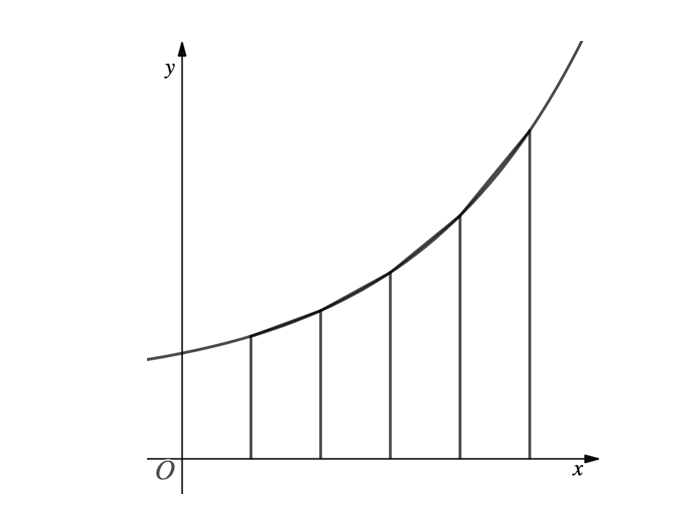
A student is estimating the area bounded by the curve , the -axis and the lines and .
The student intends to find the area of two rectangles of equal width in order to estimate the area as shown in the diagram below.
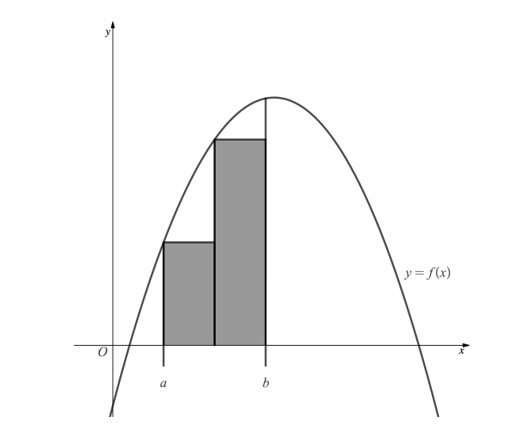
By drawing a sketch, show how the student’s estimate of the area can be improved while still using rectangles of equal width.
The diagram below shows the graph with equation .
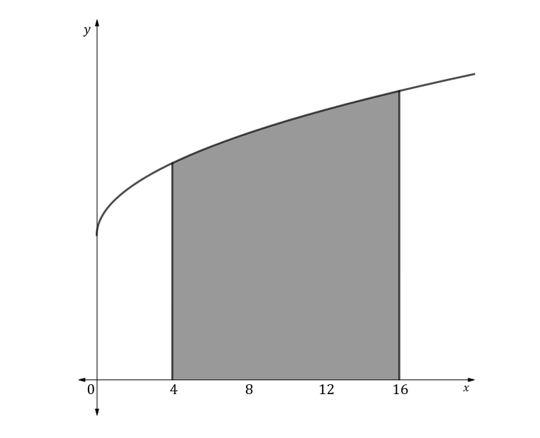
The shaded area is to be estimated using the trapezium rule where .
[i]
Write down the number of strips to be used.
[ii]
Write down the number of ordinates to be used.
[iii]
Complete the table of values for , giving values to three significant figures where appropriate.
| 4 | |||||||
|---|---|---|---|---|---|---|---|
Use the trapezium rule with all the values from the table above to find an estimate of the integral
giving your answer to three significant figures.
State, with a reason, whether your answer to part [b] is an overestimate or an underestimate.
The trapezium rule is to be used to estimate the integral
By completing the table of values below, use the trapezium rule to estimate the integral given above.
| -2 | -1.5 | -1 | -0.5 | 0 | |
|---|---|---|---|---|---|
i] By finding the exact value of the integral above, find the percentage error of your estimate from part [a].
ii] Explain how you could increase the accuracy of your trapezium rule estimate.
Use calculus to find the value of
Given
( )
find the value of the constant , where .
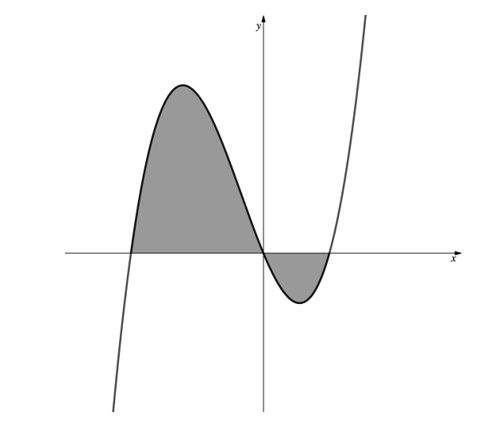
The diagram below shows part of the graph of .
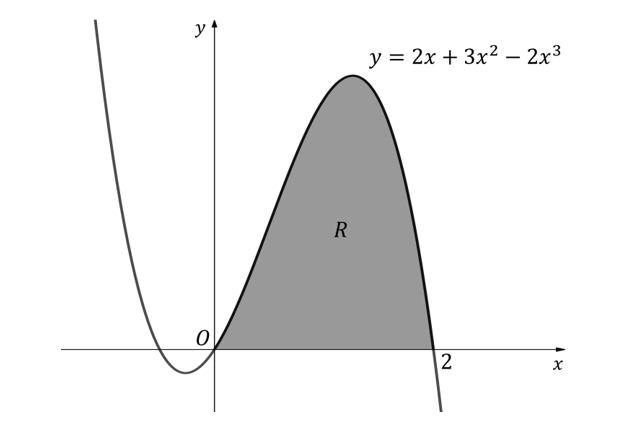
Find the area of the shaded region labelled .
The diagram below shows part of the graph of .
Find the total area of the two shaded regions.
The line with equation cuts the curve with equation at the points and , as shown.
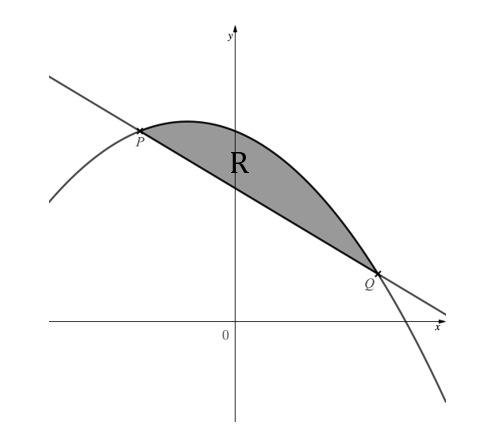
Find the - and -coordinates of the points and .
Find the exact area of the region labelled , giving your answer in the form , where and are integers to be found.
The diagram below shows the graphs of and .
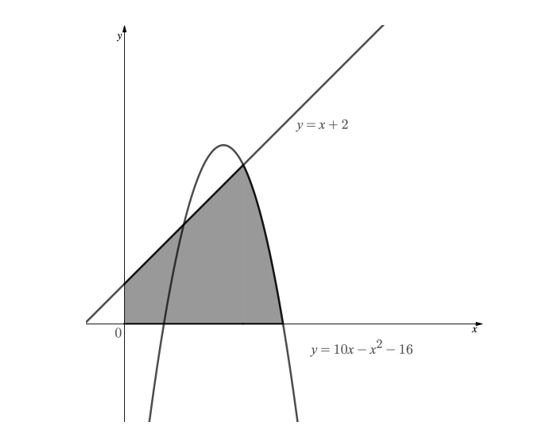
Find the exact area of the shaded region.
The diagram below shows a sketch of the curves with equations
and
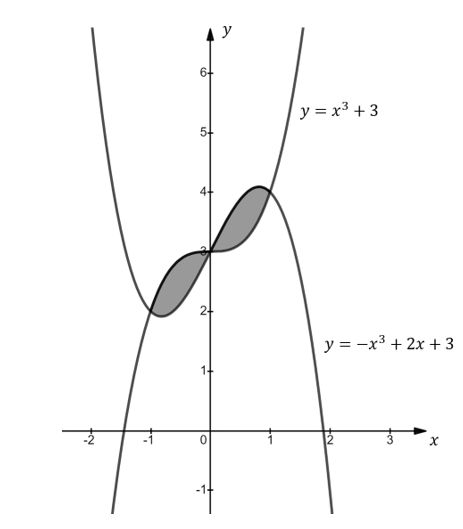
Find the -coordinates of the points of intersection of the two graphs.
Use calculus to find the total shaded area enclosed by the two graphs.
The trapezium rule is to be used to find an estimate for the integral
The table below shows values for and , rounded to three significant figures where appropriate.
| 4 | 4.5 | 5 | 5.5 | 6 | 6.5 | 7 | 7.5 | 8 | |
|---|---|---|---|---|---|---|---|---|---|
| 3.16 | 3.39 | 3.61 | 3.81 | 4 | 4.18 | 4.36 | 4.53 | 4.69 |
Using the values in the table find
[i]
an estimate for the integral using 2 strips,
[ii]
an estimate for the integral using 4 strips,
[iii]
an estimate for the integral using 8 strips.
Justify which of the estimates from part [a] will be the most accurate estimate for the integral.
The diagram below shows part of the graph with equation
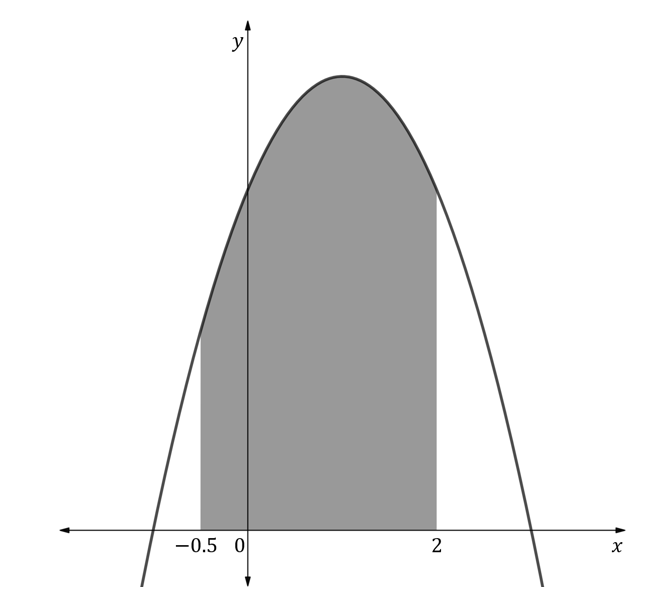
Use the trapezium rule with 5 strips to find an estimate for the shaded area, giving your answer to three significant figures.
Use the trapezium rule with to find an estimate for the area bounded by the curve with equation , the -axis and lines with equations . Give your answer to five significant figures.
The integral
can be evaluated as 3.8854 to five significant figures. Using this as its exact value, calculate the percentage error of your estimate from part [a].
Use calculus to find the value of
giving your answer correct to 3 significant figures.
Given
find the value of the constant .
The diagram below shows part of the graph of .
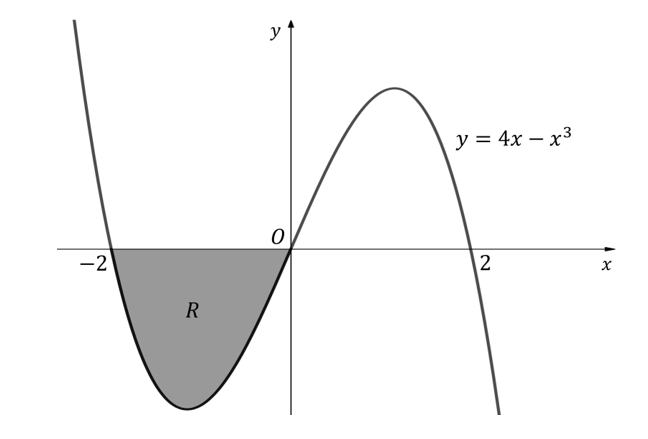
Find the area of the shaded region labelled .
Without doing any additional calculation, explain why must be equal to zero.
The diagram below shows part of the graph of .
Find the total area of the two shaded regions.
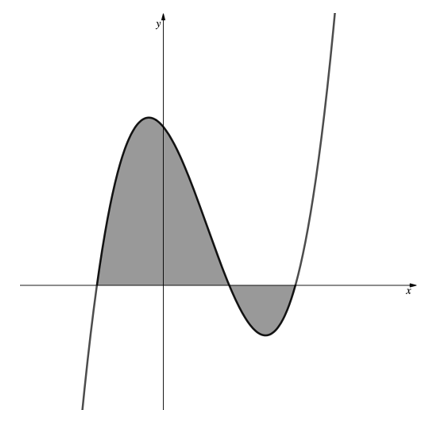
The diagram below shows the graphs of and .
Find the exact area of the shaded region.
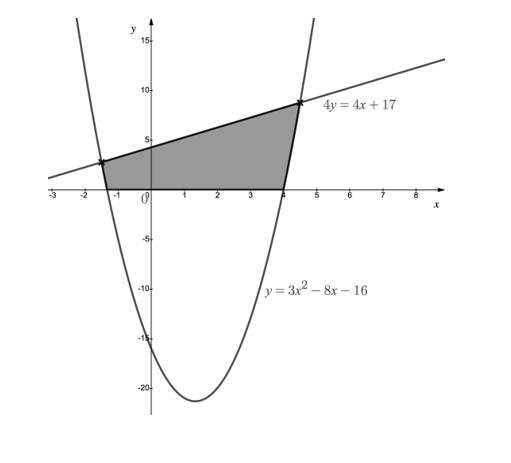
The diagram below shows the graphs of and .
Find the total area of the shaded regions.
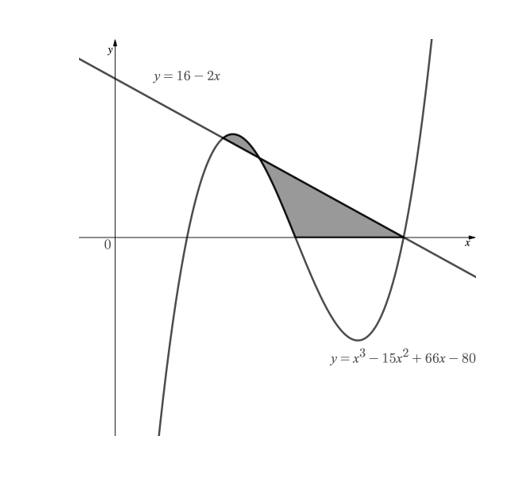
The diagram below shows the graphs of and .
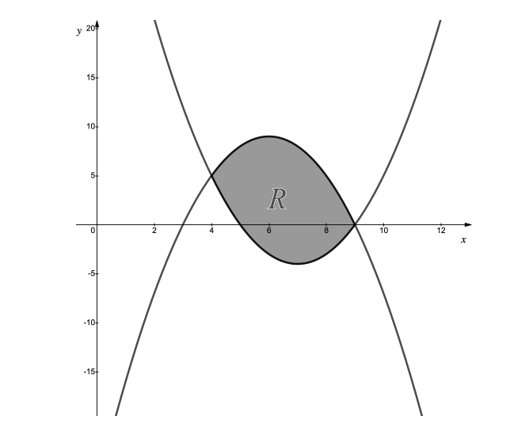
Find the area of the shaded region, .
The diagram below shows a sketch of the graph of
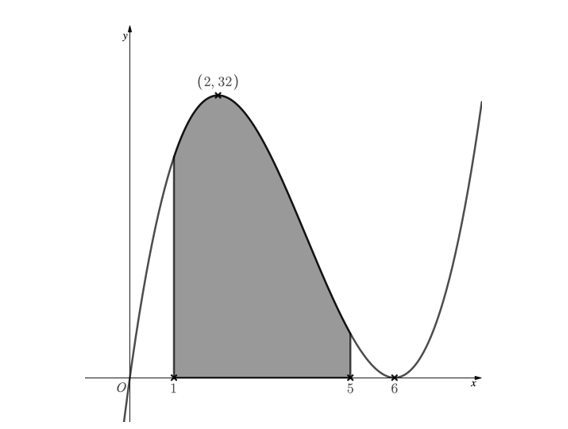
The graph has a local maximum point at as indicated on the diagram.
Use the trapezium rule with 5 ordinate values to estimate the area shaded.
Using the appropriate working values from part [a], find an upper and lower bound for the area shaded.
Suggest a reason why using the trapezium rule in this case is not appropriate.
The diagram below shows the graph of
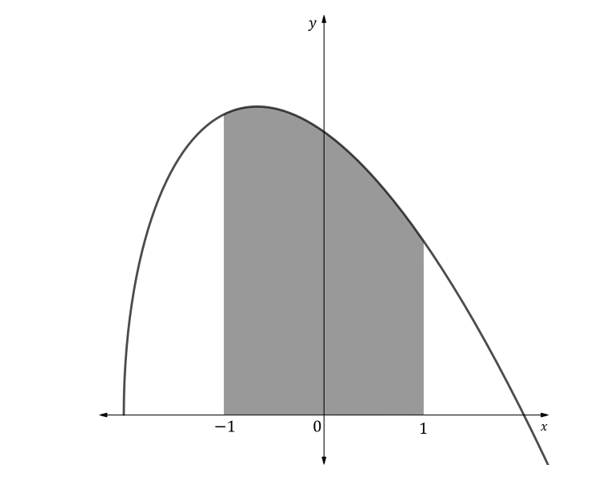
Use the trapezium rule with six strips to find an estimate of the integral
to five significant figures.
By using your calculator to find the exact value of the integral to five significant figures, find the percentage error of your estimate from part [a].