Charts (Cambridge International IGCSE Geography)
Bar chart
Spec point — "Candidates should be able to: • select, present, construct and communicate data through appropriate graphs, charts and diagrams using relevant scales and annotations to present information • extract, interpret, analyse and evaluate information presented on graphs, charts and diagrams • identify and evaluate variations, trends and patterns from data provided."
Bar Chart
-
A bar chart is the simplest form of displaying data
-
Each bar is the same width but can have varying lengths
-
Each bar is drawn an equal distance apart (equidistant)
-
The data is discrete data
-
Bar graphs are useful for:
- Comparing classes or groups of data
- Changes over time
| Strengths | - Summarises a large set of data - Easy to interpret and construct - Shows trends clearly |
|---|---|
| Limitations | - Requires additional information - Does not show causes, effects or patterns; can be too simplistic - Can only be used with discrete data |
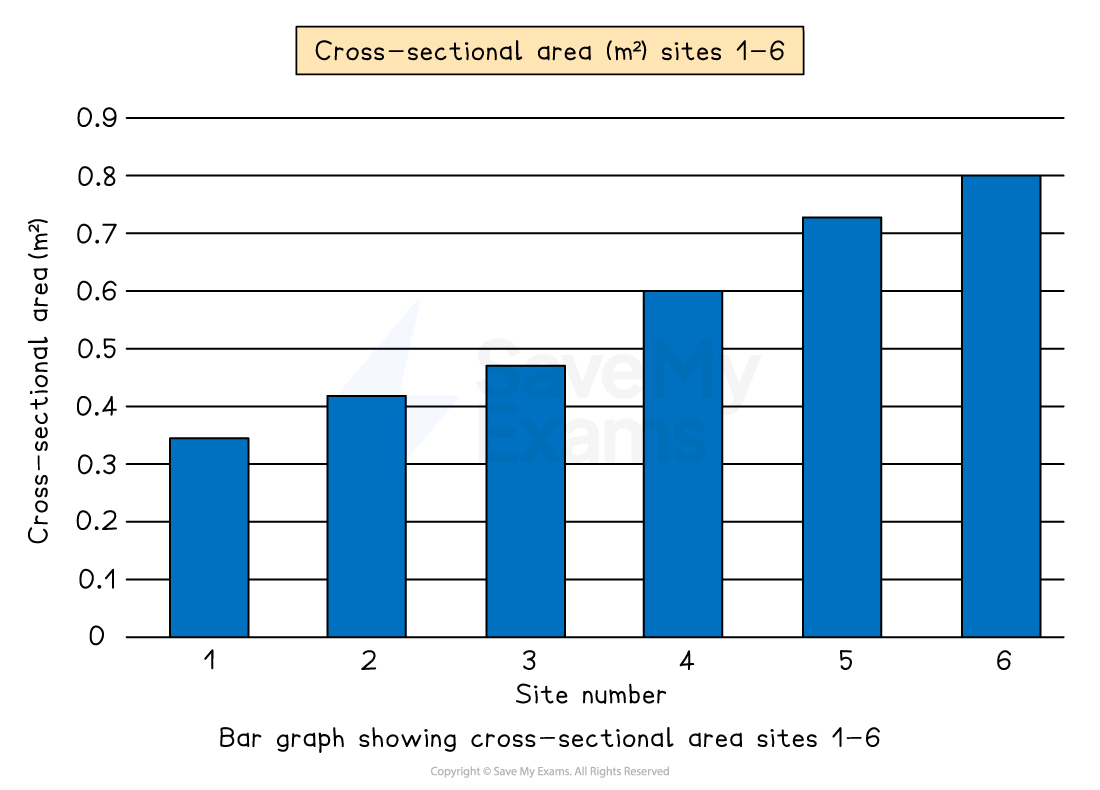
Example of a bar graph
Compound or divided bar chart
Spec point — "Candidates should be able to: • select, present, construct and communicate data through appropriate graphs, charts and diagrams using relevant scales and annotations to present information • extract, interpret, analyse and evaluate information presented on graphs, charts and diagrams • identify and evaluate variations, trends and patterns from data provided."
Compound or Divided Bar Chart
- The bars are subdivided to show the information, with all bars totalling 100%
- Divided bar charts show a variety of categories
- They can show percentages and frequencies
| Strengths | - A large amount of data can be shown on one graph. - Percentages and frequencies can be displayed on divided bar charts |
|---|---|
| Limitations | - A divided bar chart can be difficult to read if there are multiple segments - It can be difficult to compare data sometimes |
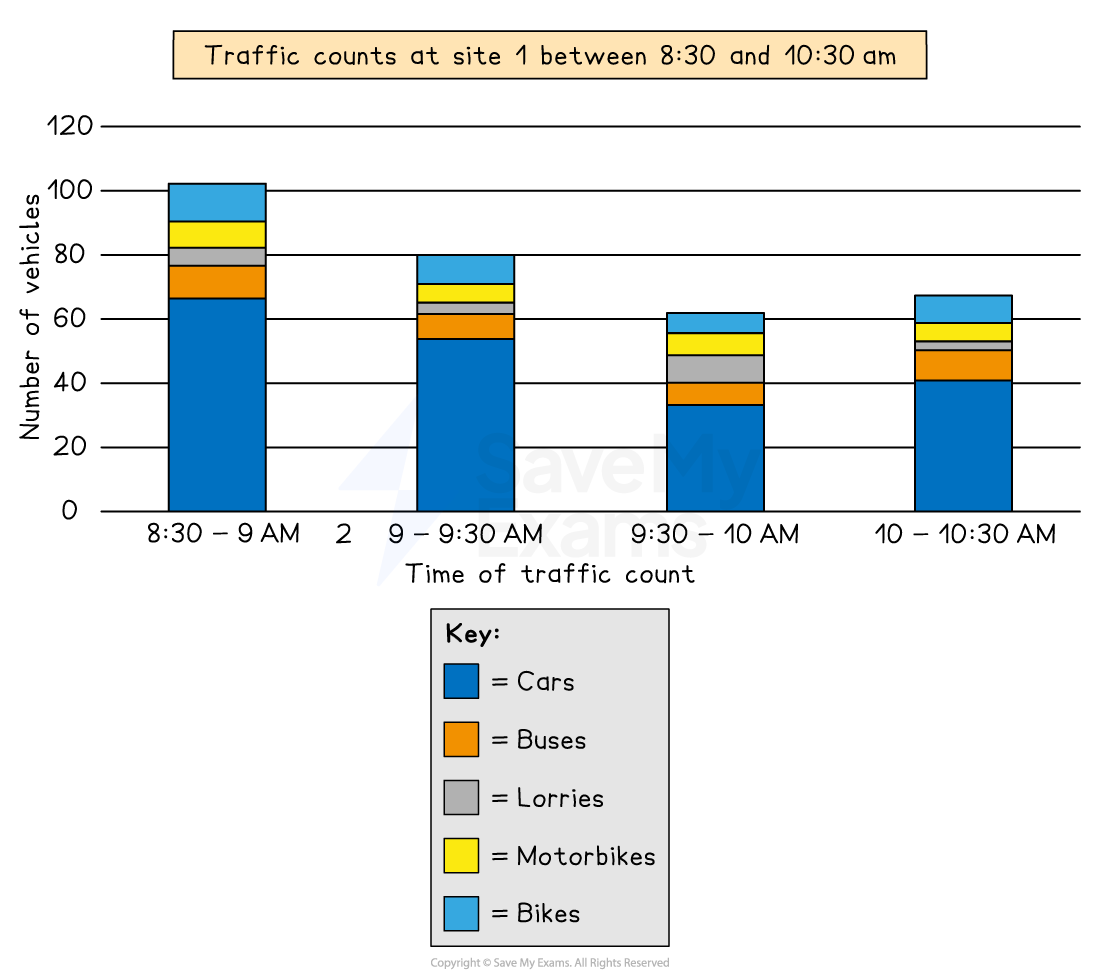
A compound or divided bar chart
Population pyramid
Spec point — Factors influencing population structures: natural increase and net migration.
-
The characteristics of a population—the distribution of age, sex, ethnicity, religion, etc.—are known as the population structure
-
The two main components of age and sex can be shown on a population pyramid
-
This is a graphical illustration of the distribution of a given population, grouped by age and gender
-
It can be used to represent a population of any region, city, country or even the world
-
As the population grows the shape of the pyramid changes
-
The population pyramid can be used to identify the following groups:
- Young dependants
- Old dependents
- Economically active(working population)
- Dependency ratio
| Strengths | - Easy to compare age and sex data - Easy to read and annotate |
|---|---|
| Limitations | - Can take a long time to construct - Detail can be lost in the data (figures just show age groups there can be variation within the groups); additional annotations may be necessary |
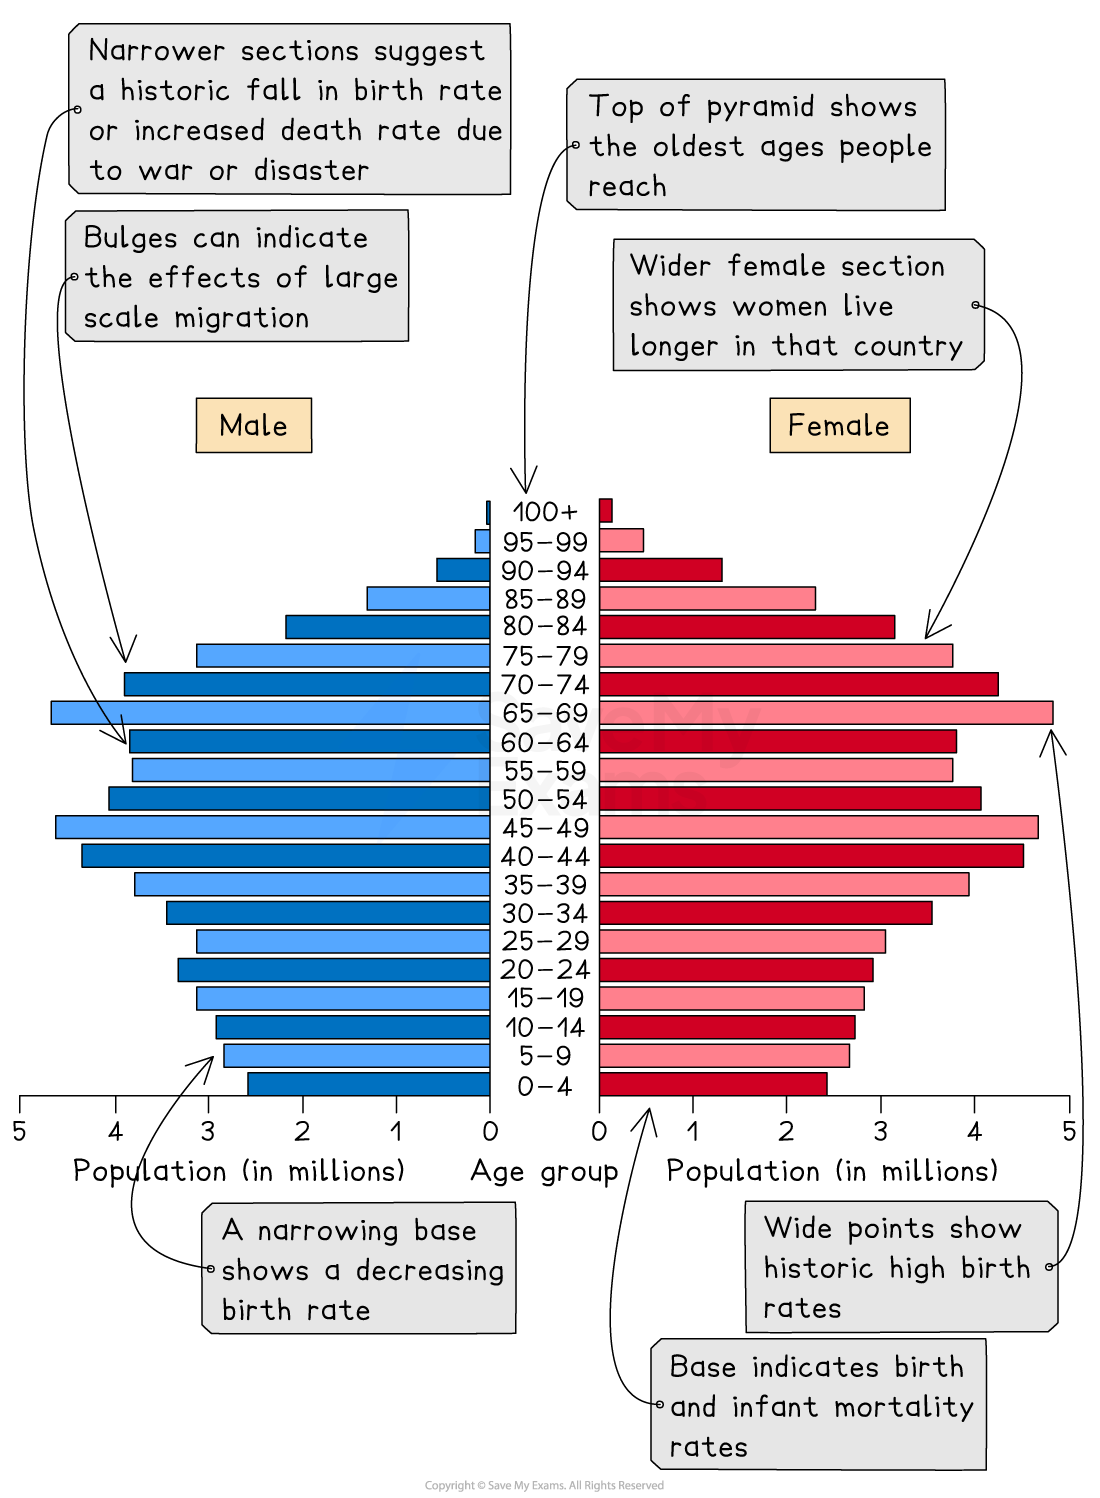
Population pyramid
Pie Chart
Spec point — "Candidates should be able to: • select, present, construct and communicate data through appropriate graphs, charts and diagrams using relevant scales and annotations to present information • extract, interpret, analyse and evaluate information presented on graphs, charts and diagrams • identify and evaluate variations, trends and patterns from data provided."
Pie Chart
- Used to show proportions, the area of the circle segment represents the proportion
- A pie chart can also be drawn as a proportional circle
- Pie charts can be located on maps to show variations at different sample sites
- The percentage of the pie chart must add up to 100%
- To calculate degrees of the pie chart (which totals 360°), divide the percentage by 100 and then multiply by 360
- Each segment should be a different colour
| Strengths | - Clearly shows the proportion of the whole - Easy to compare different components - Easy to label - Information can be highlighted by separating segments |
|---|---|
| Limitations | - Does not show changes over time; hard to compare two sets of data - Difficult to understand without clear labelling - Calculating the size of each section can be difficult - Can only be used for a small number of categories; otherwise, lots of segments become confusing |
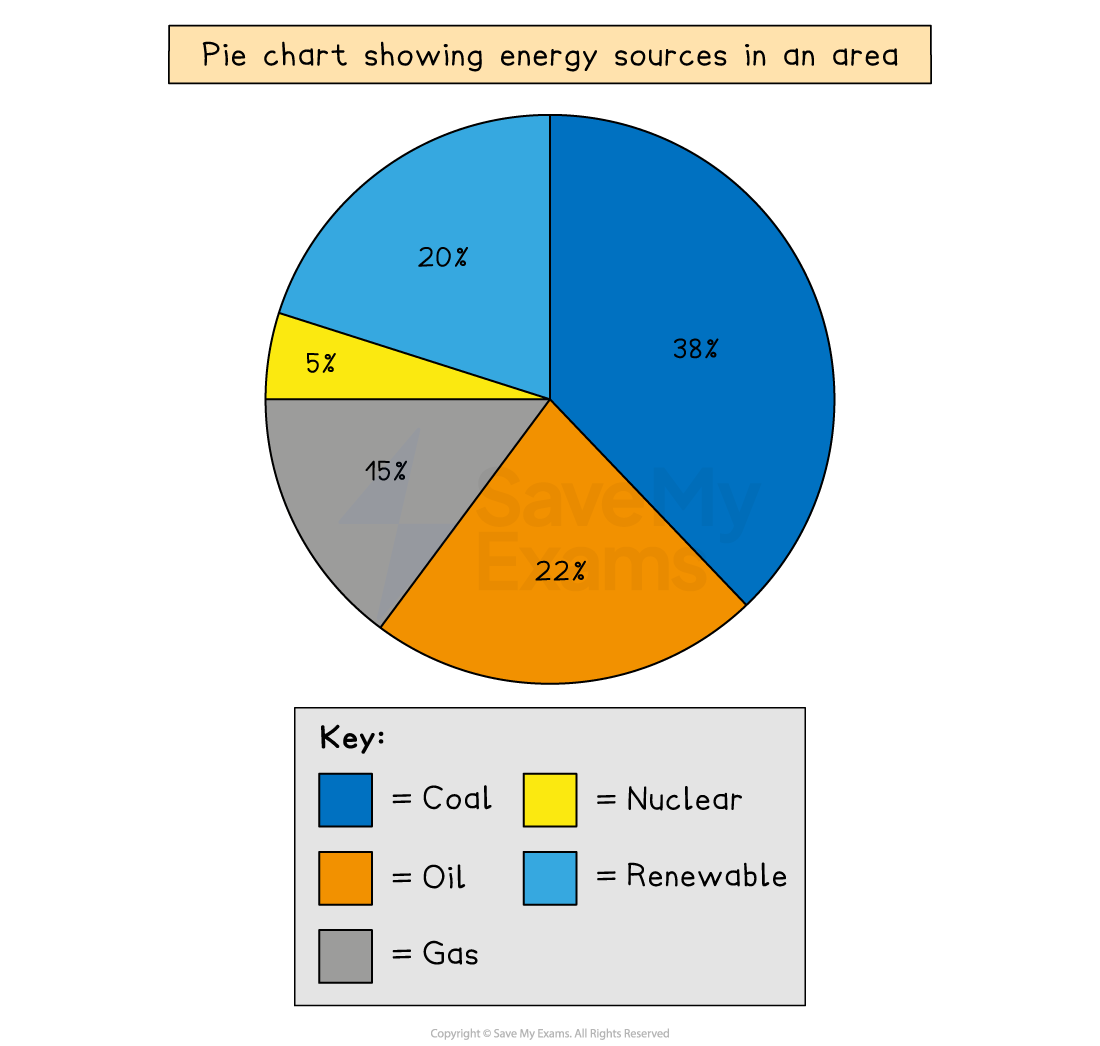
Example of a pie chart
Rose diagram
Spec point — "Candidates should be able to: • select, present, construct and communicate data through appropriate graphs, charts and diagrams using relevant scales and annotations to present information • extract, interpret, analyse and evaluate information presented on graphs, charts and diagrams • identify and evaluate variations, trends and patterns from data provided."
Rose diagram
A rose diagram is a type of radial graph
- It uses compass points for the axis directions
- Can be used for data such as wind direction, noise or light levels
| Strengths | - Clearly show patterns - Multiple sets of data can be compared |
|---|---|
| Limitations | - Can be difficult to plot - Can only be used for certain types of data - Hard to identify anomalies |
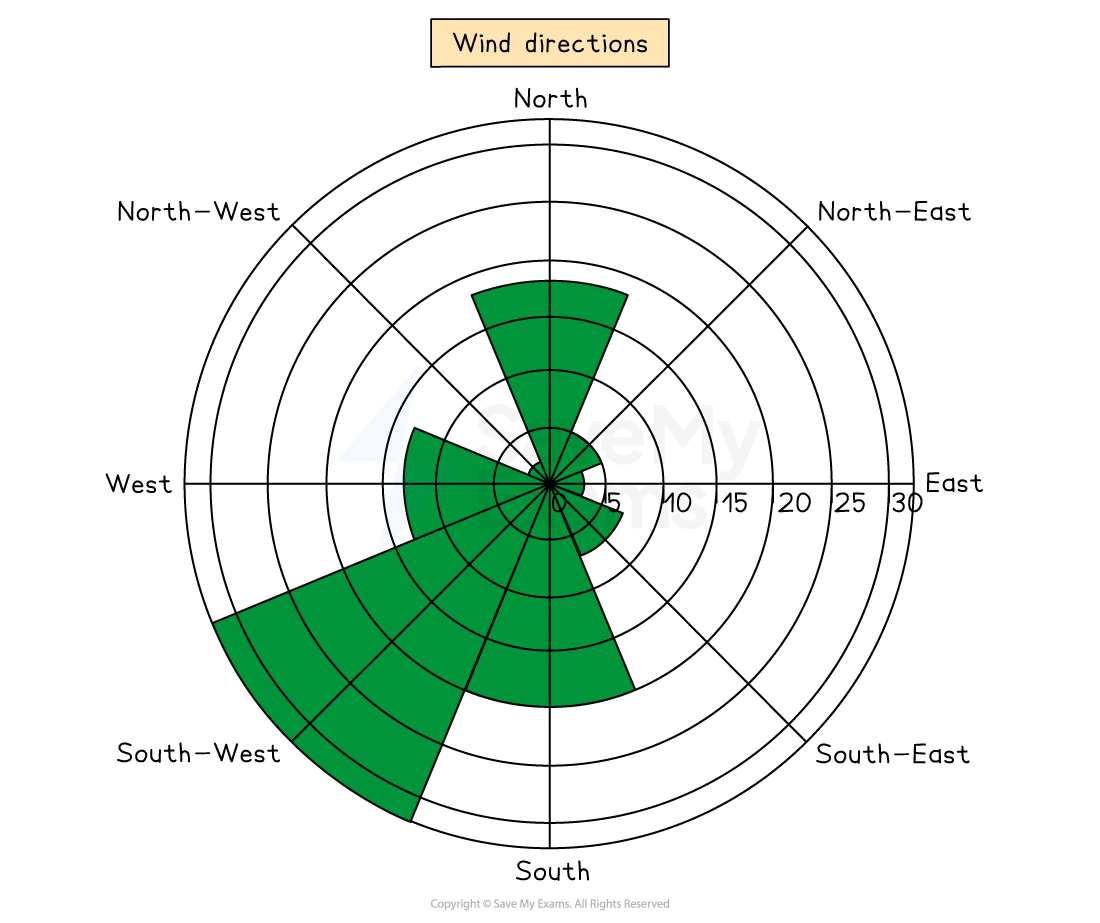
Rose diagram showing wind direction
Histograms
Spec point — "Candidates should be able to: • select, present, construct and communicate data through appropriate graphs, charts and diagrams using relevant scales and annotations to present information • extract, interpret, analyse and evaluate information presented on graphs, charts and diagrams • identify and evaluate variations, trends and patterns from data provided."
Histograms
- Histograms show continuous data
- Always use a ruler to draw the bars
- All bars should be the same width
- The top of the bar should reach the number on the side of the graph that is being represented
- There should be no gaps; all bars should be touching
- Ensure all axes are labelled and that the graph has a title
| Strengths | - Large data sets can be graphed easily - Data can be compared |
|---|---|
| Limitations | - Can be difficult to pinpoint exact data values - They can only be used for numerical data |
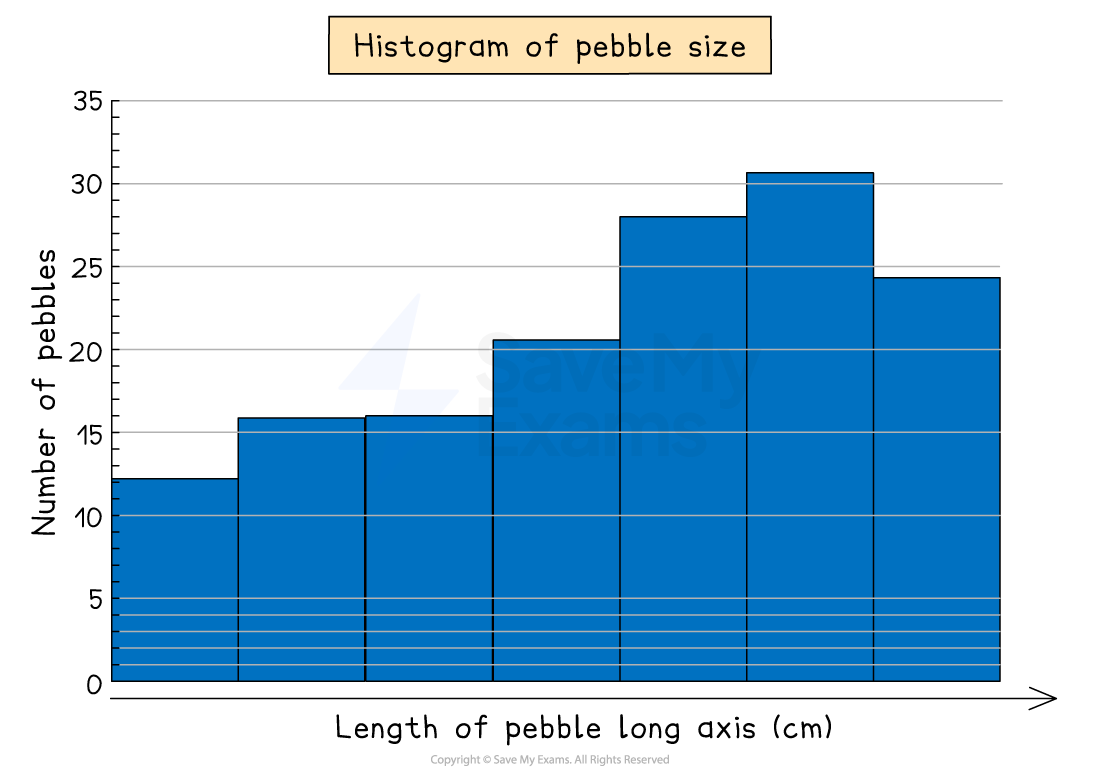
Example of a histogram
Was this revision note helpful?