Graphs (Cambridge International IGCSE Geography)
Key terminology
Spec point — "Candidates should be able to: • select, present, construct and communicate data through appropriate graphs, charts and diagrams using relevant scales and annotations to present information • extract, interpret, analyse and evaluate information presented on graphs, charts and diagrams • identify and evaluate variations, trends and patterns from data provided."
Key terminology
Types of data
- Continuous data is numerical data that can take any value within a given range, e.g. heights and weights
- Discrete data is numerical data that can only take certain values, e.g. shoe size
- Quantitative data is where the results can be expressed using numerical values
- Qualitative data is where the results can’t be expressed as numbers, e.g. opinions
Line graphs
Spec point — "Candidates should be able to: • select, present, construct and communicate data through appropriate graphs, charts and diagrams using relevant scales and annotations to present information • extract, interpret, analyse and evaluate information presented on graphs, charts and diagrams • identify and evaluate variations, trends and patterns from data provided."
Line graphs
- One of the simplest ways to display continuous data
- Both axes are numerical and continuous
- Used to show changes over time or space
| Strengths | - Shows trends and patterns clearly - Quicker and easier to construct than a bar graph - Easy to interpret - Requires little written explanation |
|---|---|
| Limitations | - Does not show causes or effects - Can be misleading if the scales on the axis are altered - If there are multiple lines on a graph it can be confusing |
Example
- A river cross-section is a particular form of line graph because it is not continuous data, but the plots can be joined to show the shape of the river channel
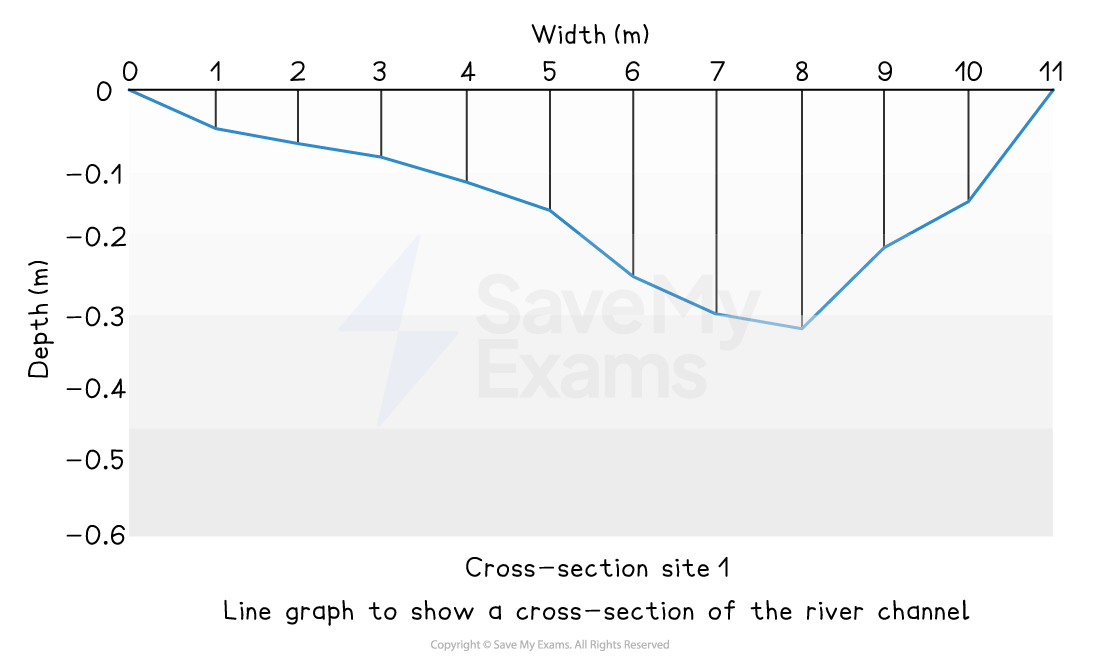
Line graph showing a river cross-section
Radial graphs
Spec point — "Candidates should be able to: • select, present, construct and communicate data through appropriate graphs, charts and diagrams using relevant scales and annotations to present information • extract, interpret, analyse and evaluate information presented on graphs, charts and diagrams • identify and evaluate variations, trends and patterns from data provided."
Radial graphs
- Use multidirectional axes to plot data with bars or lines
| Strengths | - Clearly show patterns - Multiple sets of data can be compared |
|---|---|
| Limitations | - Can be difficult to plot - Can only be used for certain types of data - Hard to identify anomalies |
Climate graphs
Spec point — "Candidates should be able to: • select, present, construct and communicate data through appropriate graphs, charts and diagrams using relevant scales and annotations to present information • extract, interpret, analyse and evaluate information presented on graphs, charts and diagrams • identify and evaluate variations, trends and patterns from data provided."
Climate graphs
- A climate graph shows mean monthly temperatures and precipitation rates over 30 years
- They can be local, national, or global
- Precipitation is always shown as a bar graph and temperature as a line graph
| Strengths | - Clearly show trends and patterns - Allow for easy comparison of climates between places - Easy to understand and interpret |
|---|---|
| Limitations | - Don't show variations of precipitation and temperature within the month - Does not show extreme weather events within the month - Use of averages means that identifying anomalies |
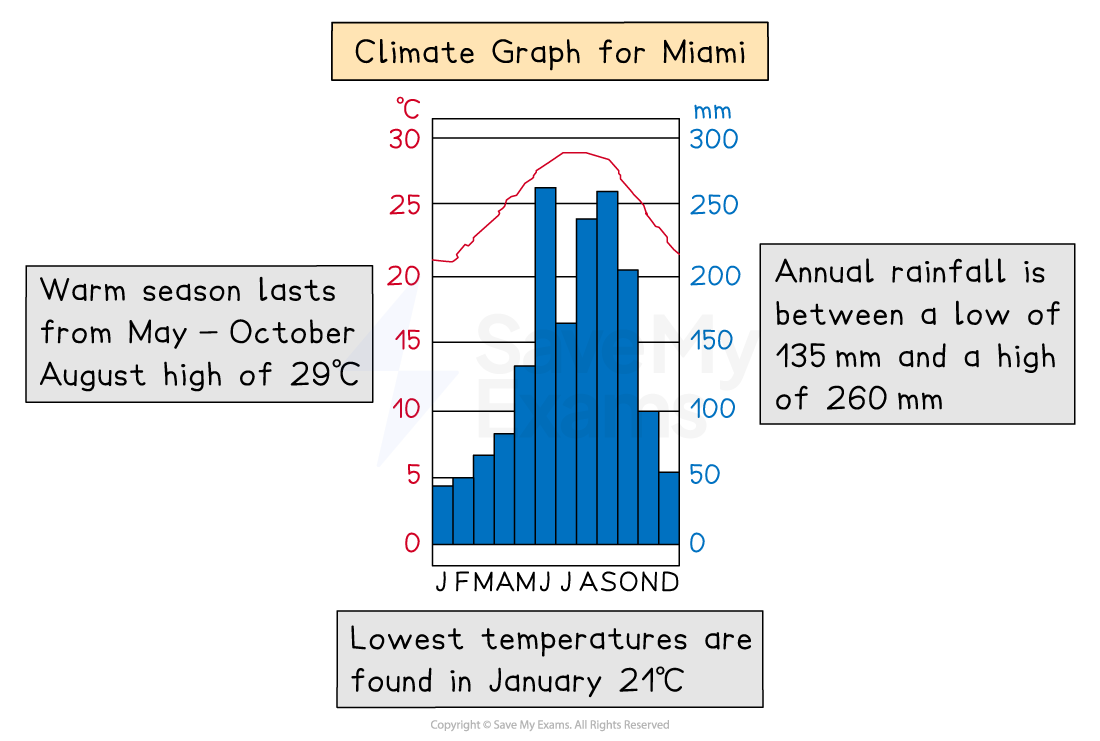
Climate graph
Dispersion graphs
Spec point — "Candidates should be able to: • select, present, construct and communicate data through appropriate graphs, charts and diagrams using relevant scales and annotations to present information • extract, interpret, analyse and evaluate information presented on graphs, charts and diagrams • identify and evaluate variations, trends and patterns from data provided."
Dispersion graphs
- Dispersion graphs are used to compare sets of data
- They also illustrate whether the data forms groups or is dispersed (spread)
- Values are shown on the vertical axis
- Can also be used to present the upper and lower values along with the mean, median, mode and extreme values
| Strengths | - Clearly show the range of values and potential anomalies - Useful for comparison of the spread and central tendencies of multiple sets of data - The spread gives an indication of reliability |
|---|---|
| Limitations | - Don't show variations of precipitation and temperature within the month - Does not show extreme weather events within the month - Use of averages means that identifying anomalies |
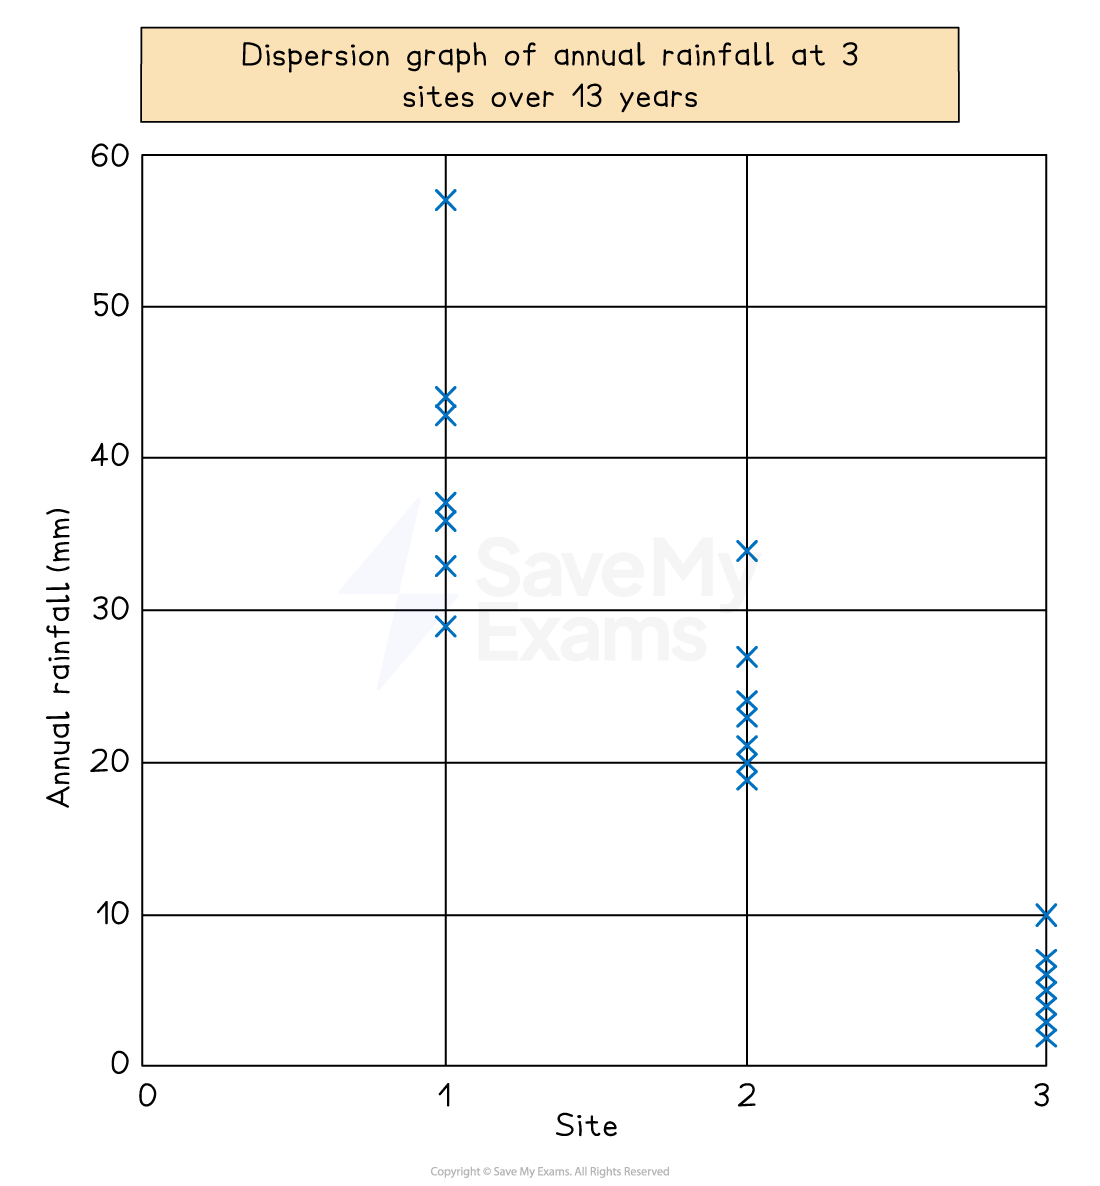
Illustration of a dispersion graph
Doughnut graphs
Spec point — "Candidates should be able to: • select, present, construct and communicate data through appropriate graphs, charts and diagrams using relevant scales and annotations to present information • extract, interpret, analyse and evaluate information presented on graphs, charts and diagrams • identify and evaluate variations, trends and patterns from data provided."
Doughnut graphs
- Doughnut graphs visually represent proportions as part of a whole
- They are similar to a pie chart but with no centre
| Strengths | - Clear and easy to interpret - Allows comparison between the proportions for different categories - Well suited to presenting percentages |
|---|---|
| Limitations | - Not suitable to display many categories - Cannot show changes over time - Small sections can be hard to interpret |
Kite graphs
Spec point — "Candidates should be able to: • select, present, construct and communicate data through appropriate graphs, charts and diagrams using relevant scales and annotations to present information • extract, interpret, analyse and evaluate information presented on graphs, charts and diagrams • identify and evaluate variations, trends and patterns from data provided."
Kite graphs
-
Kite diagrams can show both distribution and amounts
-
The distribution along a transect is shown by its position along a line in each section of a kite diagram
- Each section represents a different species
- The distance along the transect is given on the x-axis
-
The numbers are shown by the width of the 'kite' around the central horizontal line
- The shape is referred to as a kite because it extends an equal distance on each side of the central horizontal line
-
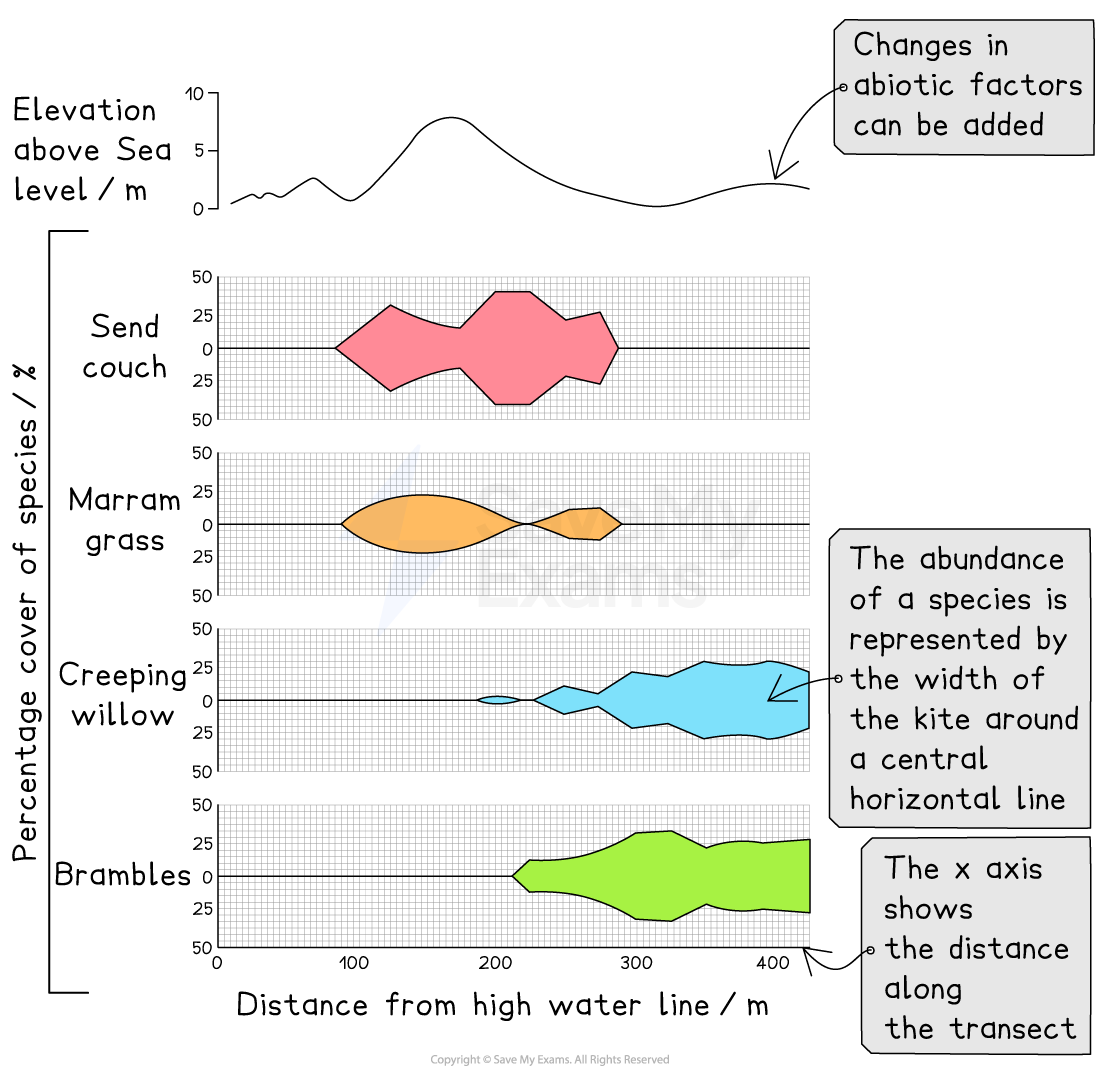
Kite diagram
| Strengths | - Useful for displaying changes over distance - Clear and easy to interpret - Easy to use to compare one set of data to another |
|---|---|
| Limitations | - Time consuming to draw - Can only be used with specific types of data |
Triangular graphs
Spec point — "Candidates should be able to: • select, present, construct and communicate data through appropriate graphs, charts and diagrams using relevant scales and annotations to present information • extract, interpret, analyse and evaluate information presented on graphs, charts and diagrams • identify and evaluate variations, trends and patterns from data provided."
Triangular graphs
- Triangular graphs have axes on three sides, all of which go from 0 to 100
- Used to display data which can be divided into three
- The data must be in percentages
- Can be used to plot data such as soil content, employment in economic activities
| Strengths | - Clearly shows relationships between data - Makes it easy to identify anomalies |
|---|---|
| Limitations | - Too many data points can make it difficult to read - Can only display three sets of data |
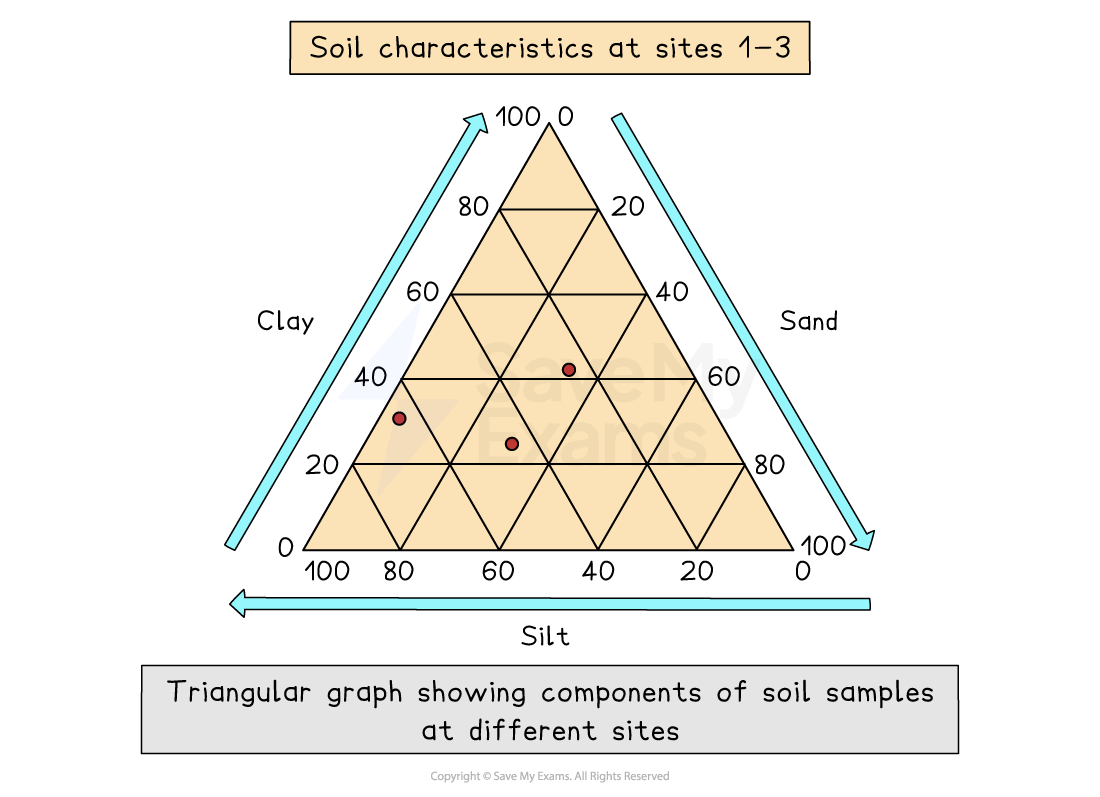
Example of a triangular graph showing soil samples
Scatter graphs
Spec point —
3.7.13· "Candidates should be able to: • select, present, construct and communicate data through appropriate graphs, charts and diagrams using relevant scales and annotations to present information • extract, interpret, analyse and evaluate information presented on graphs, charts and diagrams • identify and evaluate variations, trends and patterns from data provided."
Scatter graphs
-
Used to show the relationship between two variables
- In a river study, they are used to show the relationship between different river characteristics such as the relationship between the width and depth of the river channel
-
The points on a scatter graph should not be connected
-
The best-fit line can be added to show the relationship
| Strengths | - Clearly shows data correlation - Shows the spread of data - Makes it easy to identify anomalies and outliers |
|---|---|
| Limitations | - Data points cannot be labelled - Too many data points can make it difficult to read - Can only show the relationship between two sets of data |
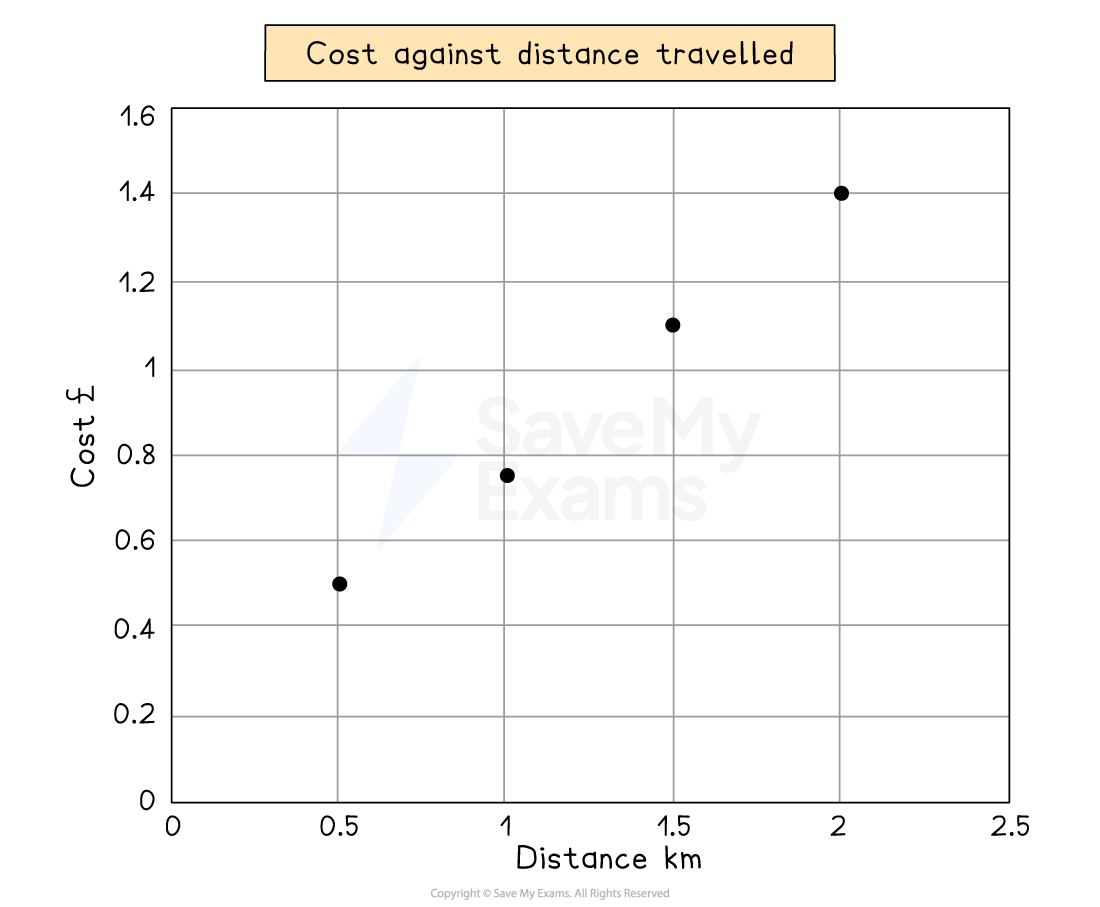
Example of a scatter graph showing the relationship between cost and distance
Exam Hint Many graphs and diagrams are available for data presentation. It is important for the exam that you are able to:
- Extract information from graphs
- Analyse and evaluate the information on a graph
- Identify and evaluate variations, trends and patterns from the data
Make sure you are familiar with the different types of graphs and that you are confident with using them.
Flood hydrographs
-
Used to show the impact of a storm event on river discharge
- The bar chart shows the precipitation total (mm)
- The line graph shows the river discharge (cumecs)
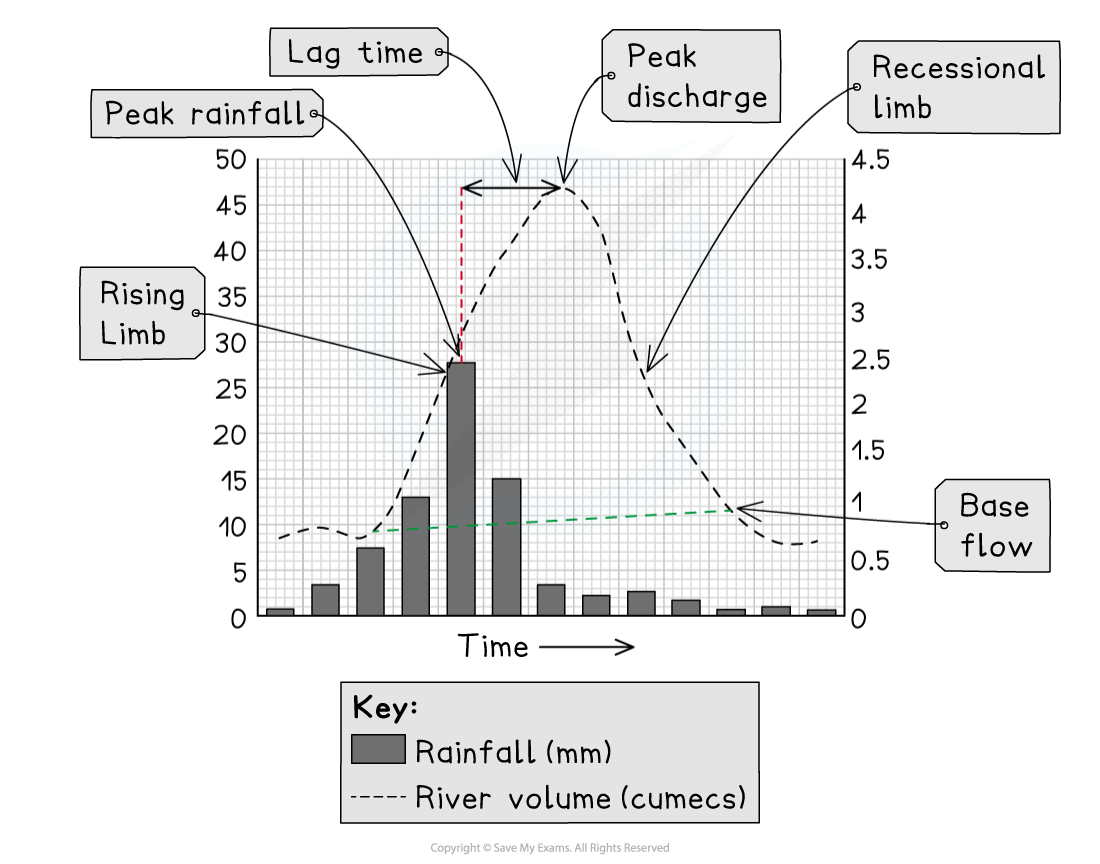
Flood hydrograph
-
The graph shows a short period, usually 24 hours
-
The storm hydrograph has several features:
-
Base flow, which is the 'normal' level of river discharge
- The water mainly comes from groundwater flow
-
Peak rainfall is the highest rainfall level during the storm
- The time of the peak rainfall is taken from the centre of the bar
-
The rising limb shows the increase in the river discharge
- The steeper the limb, the faster the river discharge has increased
-
Peak discharge is the highest level of discharge in the river
-
Lag time is the time difference between the peak rainfall and the peak discharge
- The shorter the lag time, the higher the risk of flooding because the river may not have the capacity to contain the increase in discharge
- Where there is more overland flow (surface runoff), the lag time will be shorter
-
The recessional limb shows the river discharge returning to normal flow
- The steeper the recessional limb is, the faster the river returns to normal flow
-
-
The shape of the flood hydrograph indicates some of the factors that may affect the discharge
-
A hydrograph with a steep rising limb and short lag time is likely to be in an area with one or more of the following:
- Impermeable surfaces (urban areas)
- Heavy precipitation
- Snow melt
- Steep slopes
- Impermeable soil (saturated or frozen)
-
A hydrograph with a gentle rising limb and long lag time is likely to be in an area with one or more of the following:
- Rural area with trees
- Permeable surfaces
- Gentle slopes
-
Was this revision note helpful?