15 marksmedium
(b)
Some parts of Tanzania are over-populated. Describe the problems faced by people living in areas which are over-populated.
12 questions · 61 marks · ≈ 61 min · spans 12 of 21 topics
Assembled from the topic question banks — not an official Cambridge International paperSome parts of Tanzania are over-populated. Describe the problems faced by people living in areas which are over-populated.
For an example of international migration you have studied, describe the positive and negative impacts on the country of origin.
Name of origin country .........................
Study Fig. 1, which shows the age structure of a number of countries.
| Age Group | Percentage of Population (%) | |||||
|---|---|---|---|---|---|---|
| Country A | Country B | Country C | Country D | Country E | Country F | |
| 65 and over | 18.3 | 4.1 | 5.5 | 13.2 | 3.1 | 17.3 |
| 15-64 | 63.0 | 59.1 | 61.6 | 70.3 | 69.3 | 67.6 |
| 0-14 | 18.7 | 36.8 | 32.9 | 16.5 | 27.6 | 15.1 |
Fig 1
a) Identify the country with the highest percentage of population aged 65 and over [1]
Identify the country with the lowest percentage of dependent population [1]
For a named country or area you have studied, explain why it is sparsely populated.
Name of country or area ..............................
For a named area you have studied, describe the hierarchy of service provision. Name of area ..............................
Increased urbanisation can cause problems in cities. Explain two problems that can occur.
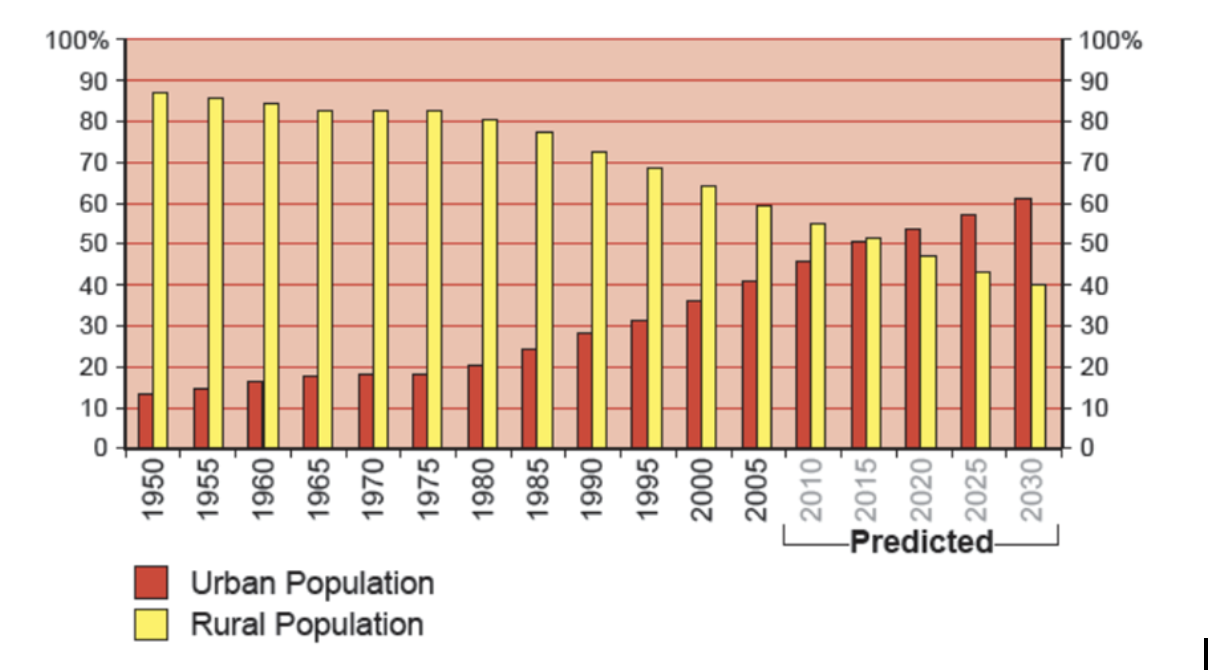
Fig 1 - Percentage of China’s population living in urban and rural areas
Study Fig 1, which shows China’s urban and rural population
(i)
What percentage of the population lived in urban areas in 1985?
(1 mark)
(ii)
By how much is China’s urban population predicted to grow between 2020 and 2030?
(1 mark)
For a named area which you have studied, explain the causes of an earthquake.
Name of area ..............................
Describe the changes which occur along a river and its valley from its source to its mouth. You should refer to processes and landforms.
Study Fig. 3.2, which is a photograph showing an area of coastline in the northwest of England.
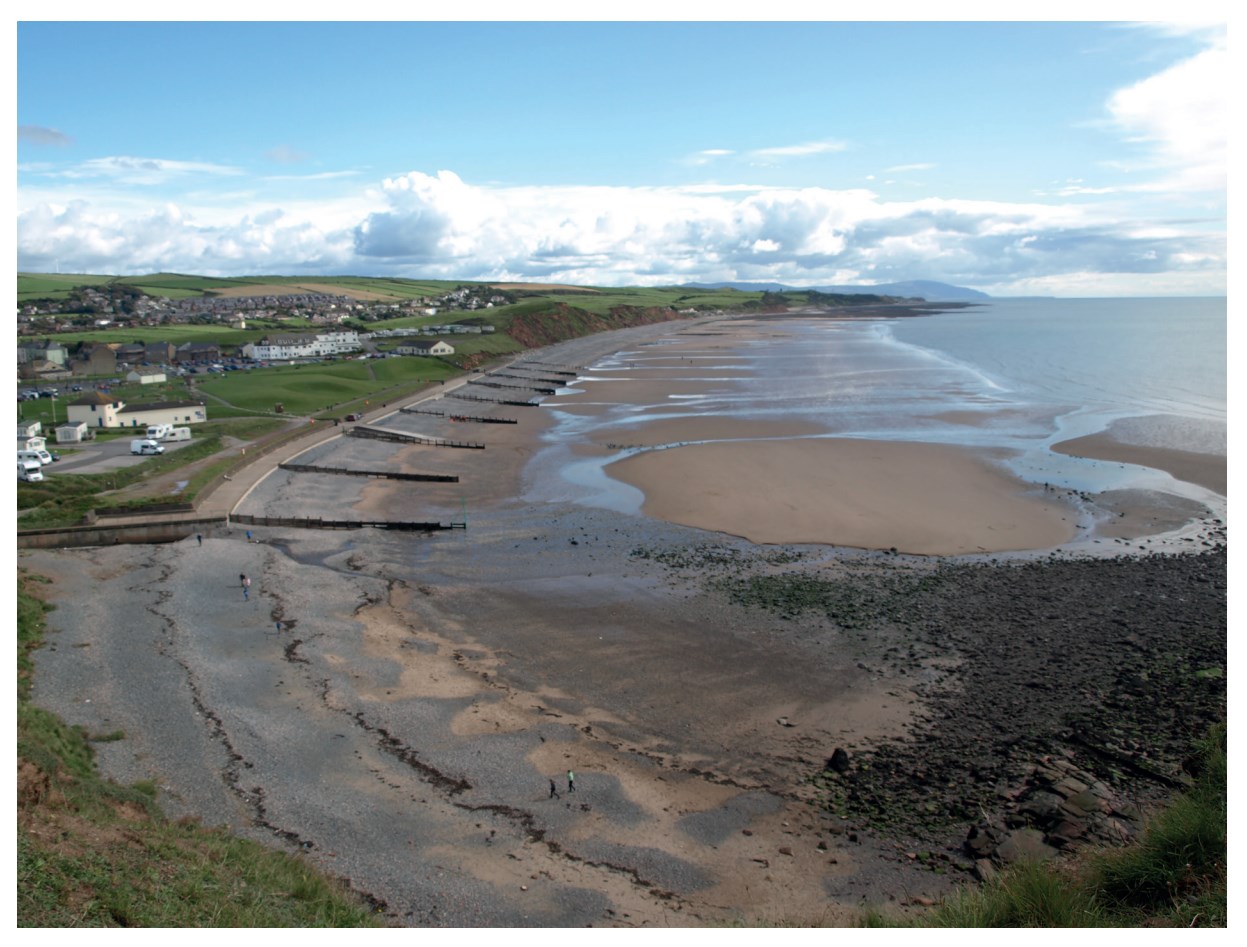
Using evidence from Fig. 3.2, explain how coastal erosion has been managed.
Some weather instruments are kept in a Stevenson screen.
Explain how the features of the Stevenson screen ensure that the information collected by these instruments is accurate.
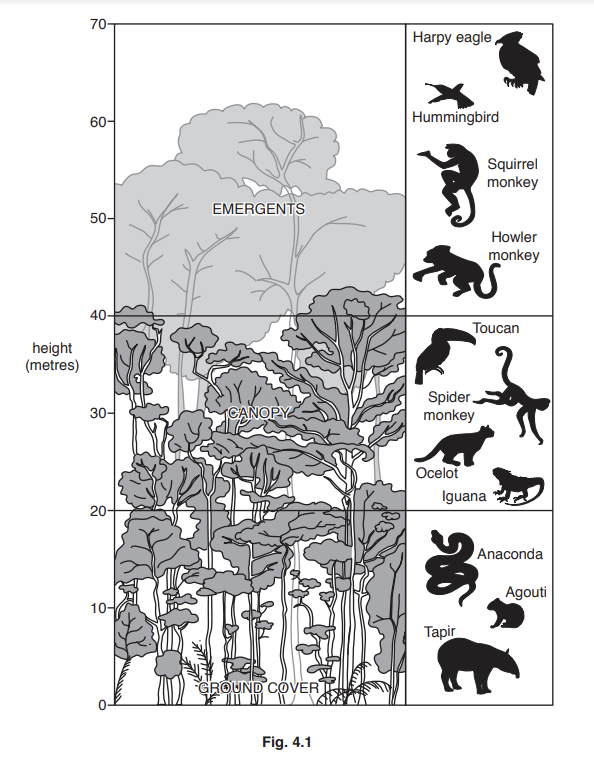
Study Fig. 4.1, which is a diagram showing information about a tropical rainforest ecosystem in an area of equatorial climate.
Explain why the equatorial climate is hot and wet.