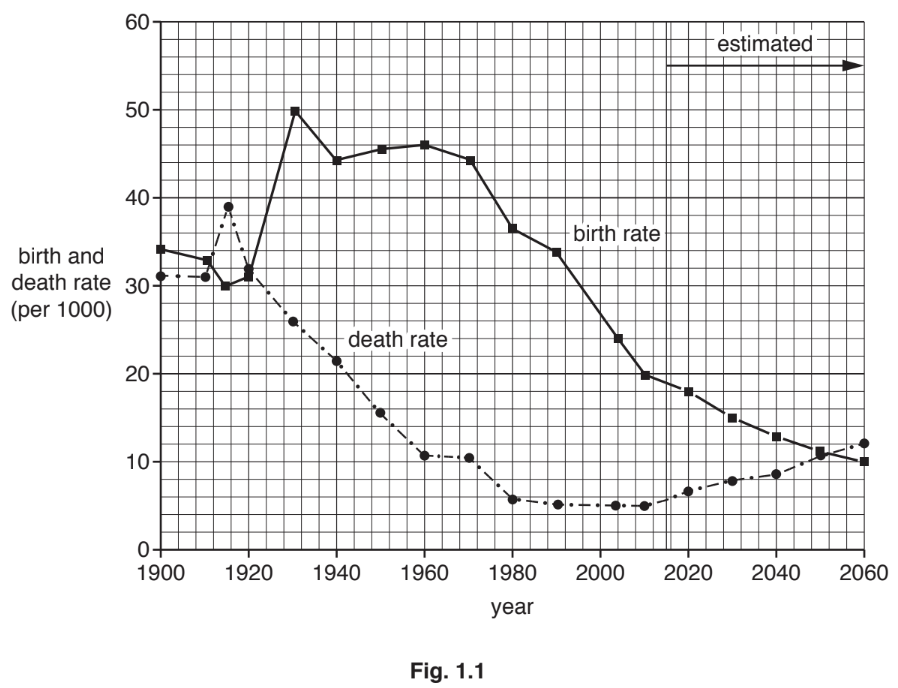
Study Fig. 1.1, which shows information about the Demographic Transition Model.
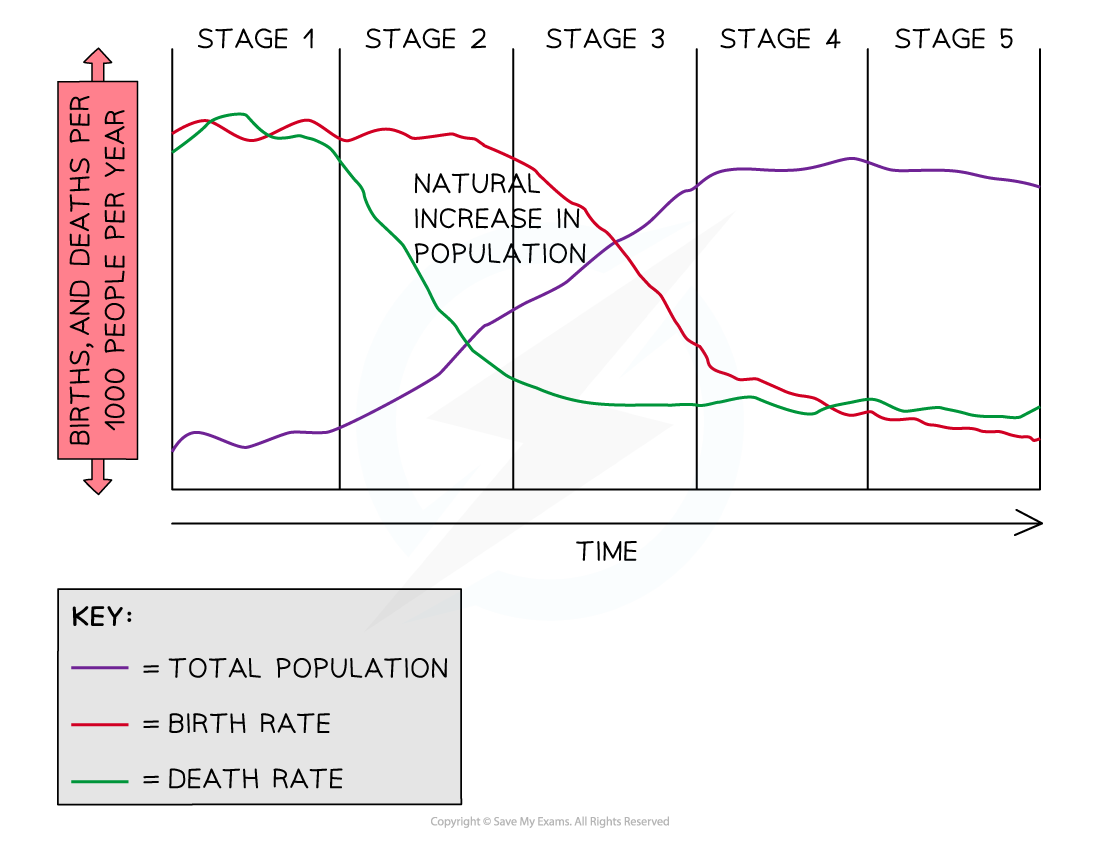
Fig. 1.1
(i)
Identify the stage when population is growing most rapidly. .........................................
(1 mark)
Using Fig. 1.1 only, compare: the birth rates in Stage 2 and Stage 3 .............................................. ........................................................................................................... ........................................................................................................... the death rates in Stage 1 and Stage 2 ............................................. ............................................................................................................ ..........................................................................................................
(2 marks)