Study Fig. 6.1, which shows a map of the Nujiang River in Yunnan Province, China, showing the location of four dams built to generate hydro-electric power (HEP).
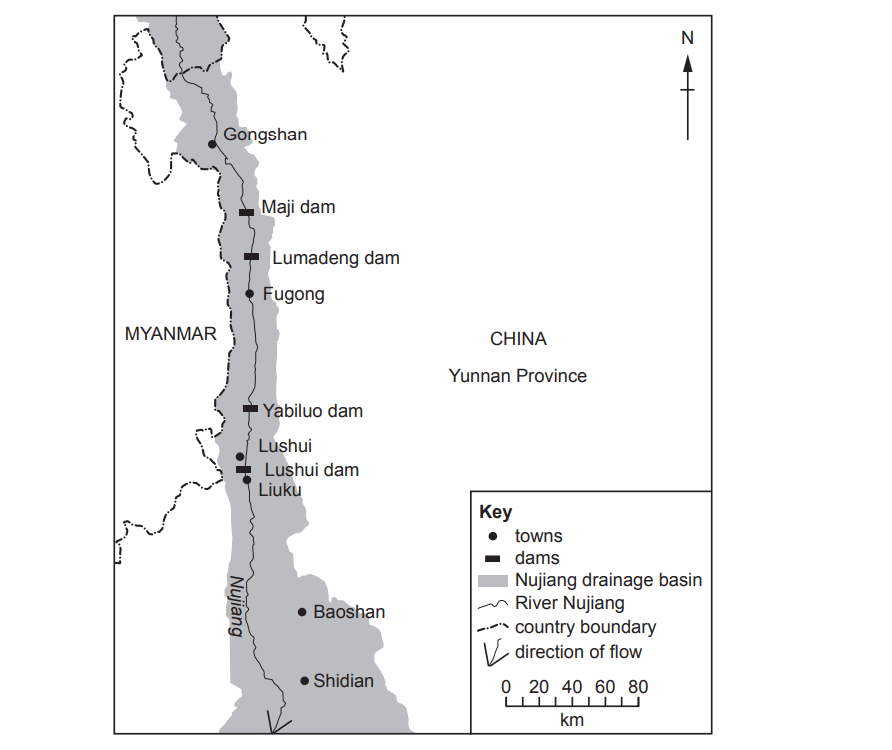
Fig. 6.1
(i)
Tick (✓) the one statement in the table below which describes how HEP is generated.
| Tick (✓) |
|---|
| Atoms of uranium are split to create electricity. | |
| Coal is burnt to produce steam which is used in the power station. | |
| Running water turns a turbine to generate power. | |
| Strong winds blow turbines to produce electricity. | |
| Turbines are turned when the tide goes in and out. | |
(1 mark)
(ii)
Identify the following dams shown in Fig. 6.1: – the dam which is nearest to the source of the river ..............................................................................
– the dam which is 100km north-north west (NNW) of Baoshan. ..............................................................................
(2 marks)
(iii)
Give three different reasons why some countries generate a greater proportion of their energy from HEP than other countries.
1 ..............................................................................
2 ..............................................................................
3 ..............................................................................
(3 marks)