Sketching Travel Graphs (Cambridge International IGCSE Further Maths)
Sketching travel graphs
How are s-t, v-t, and a-t graphs related?
-
Recall that:
-
Velocity, v, is the rate of change of displacement, s, with respect to time
-
Acceleration, a, is the rate of change of velocity, v, with respect to time
-
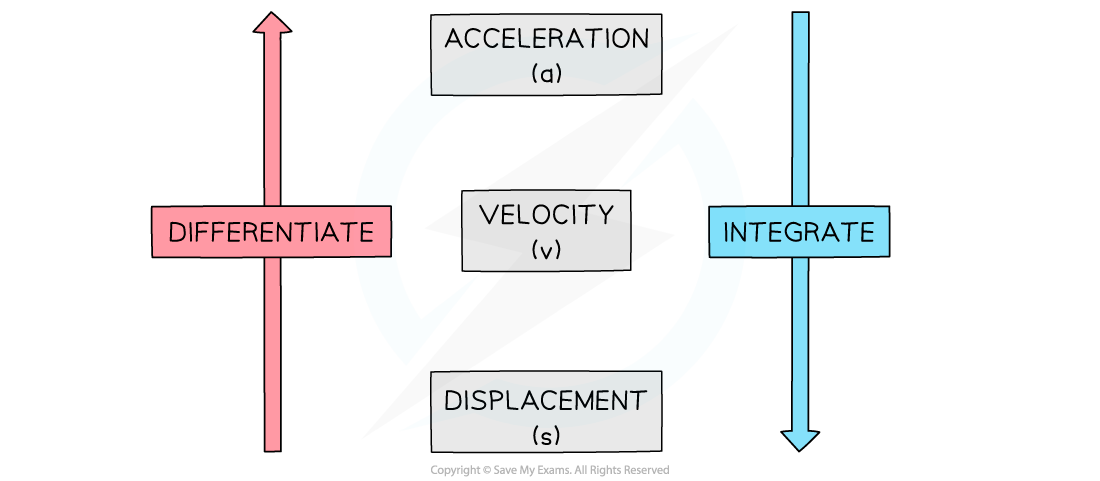
Differentiate to go from s to v and from v to a
-
Integrate to go from a to v and from v to s
- There will be a constant of integration, c, each time you integrate
-
-
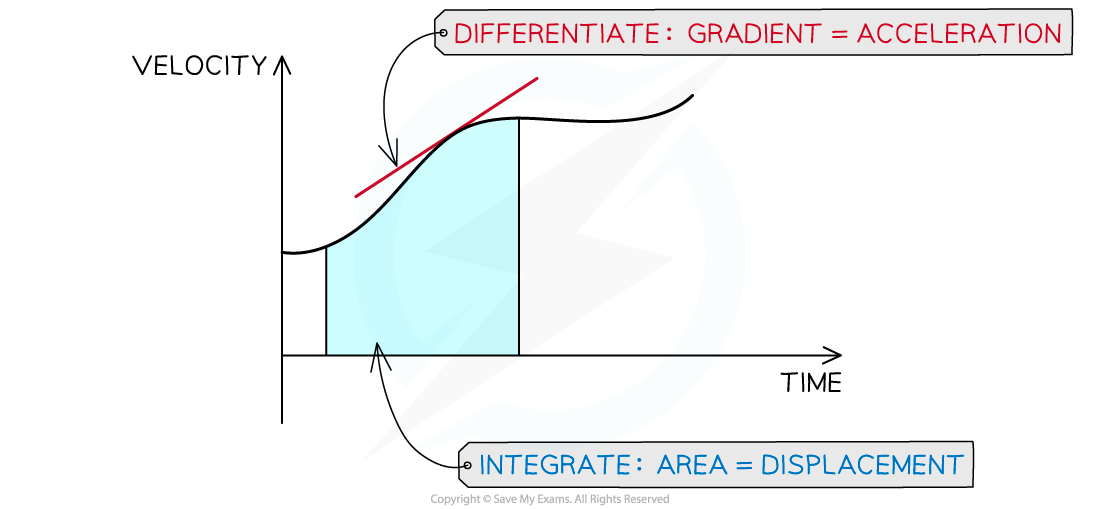
On a velocity-time graph:
- Acceleration is the gradient which is found using differentiation
- Displacement is the area under the graph which is found using integration
-
This can also be seen from the units:
-
On a displacement-time graph:
- Velocity is the gradient which is found using differentiation
- The area has no significant meaning
-
This can also be seen from the units:
-
On an acceleration-time graph:
-
Velocity is the area under the graph which is found using integration
-
The gradient is generally not used
- It is a measure called 'jolt' but this is beyond the scope of this course
-
-
This can also be seen from the units:
How can I use one travel graph to draw another?
-
Using the relations stated above, we can inspect either the graph or the equation of the graph, in order to sketch a related travel graph
-
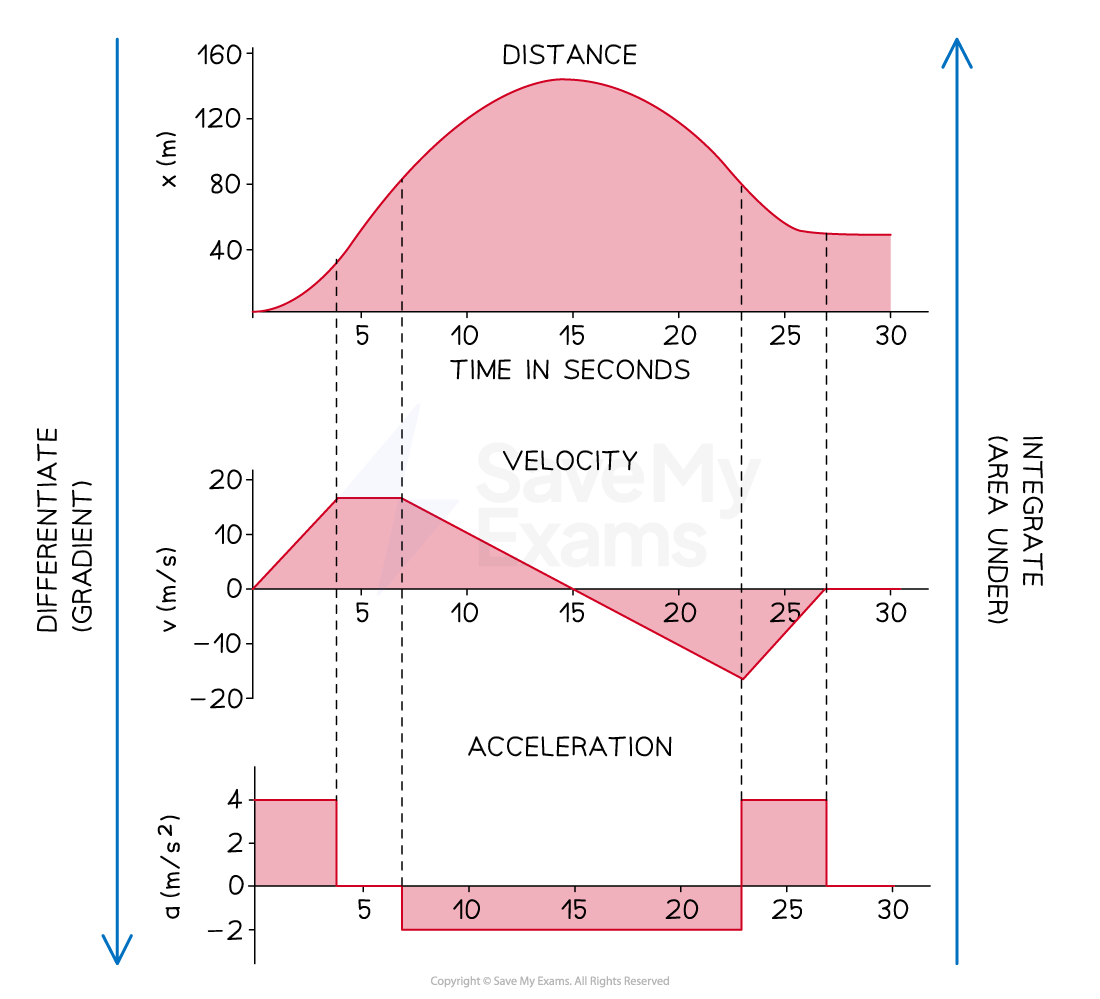
For example, if a velocity-time graph is a series of sections, with mostly straight lines:
-
Find the gradient of each section to plot the acceleration-time graph
- Remember if the gradient is negative, the acceleration-time graph will be below the x-axis
-
Find the area underneath each section to help plot the displacement-time graph
- Remember that if the velocity is a positive constant (a horizontal line above the x-axis), the displacement will be increasing (a line with positive gradient)
- If the velocity is a negative constant (a horizontal line below the x-axis), the displacement will be decreasing (a line with negative gradient)
-
-
If a graph is a curve with a known equation, we can use calculus to find the equations of the other related functions
-
Remember you may need extra information about the velocity or displacement at a point in time when integrating
-
Once the equations of the other functions are found, they can be sketched
-
For example if the graph of the displacement-time graph is a cubic
- the velocity-time graph will be a quadratic graph
- and the acceleration-time graph will be a linear graph
-
Corresponding s-t, v-t, and a-t graphs for the same journey
Exam Hint
Questions may involve both differentiation and integration (or finding gradients and areas)
- take a moment to double check you have selected the correct method!
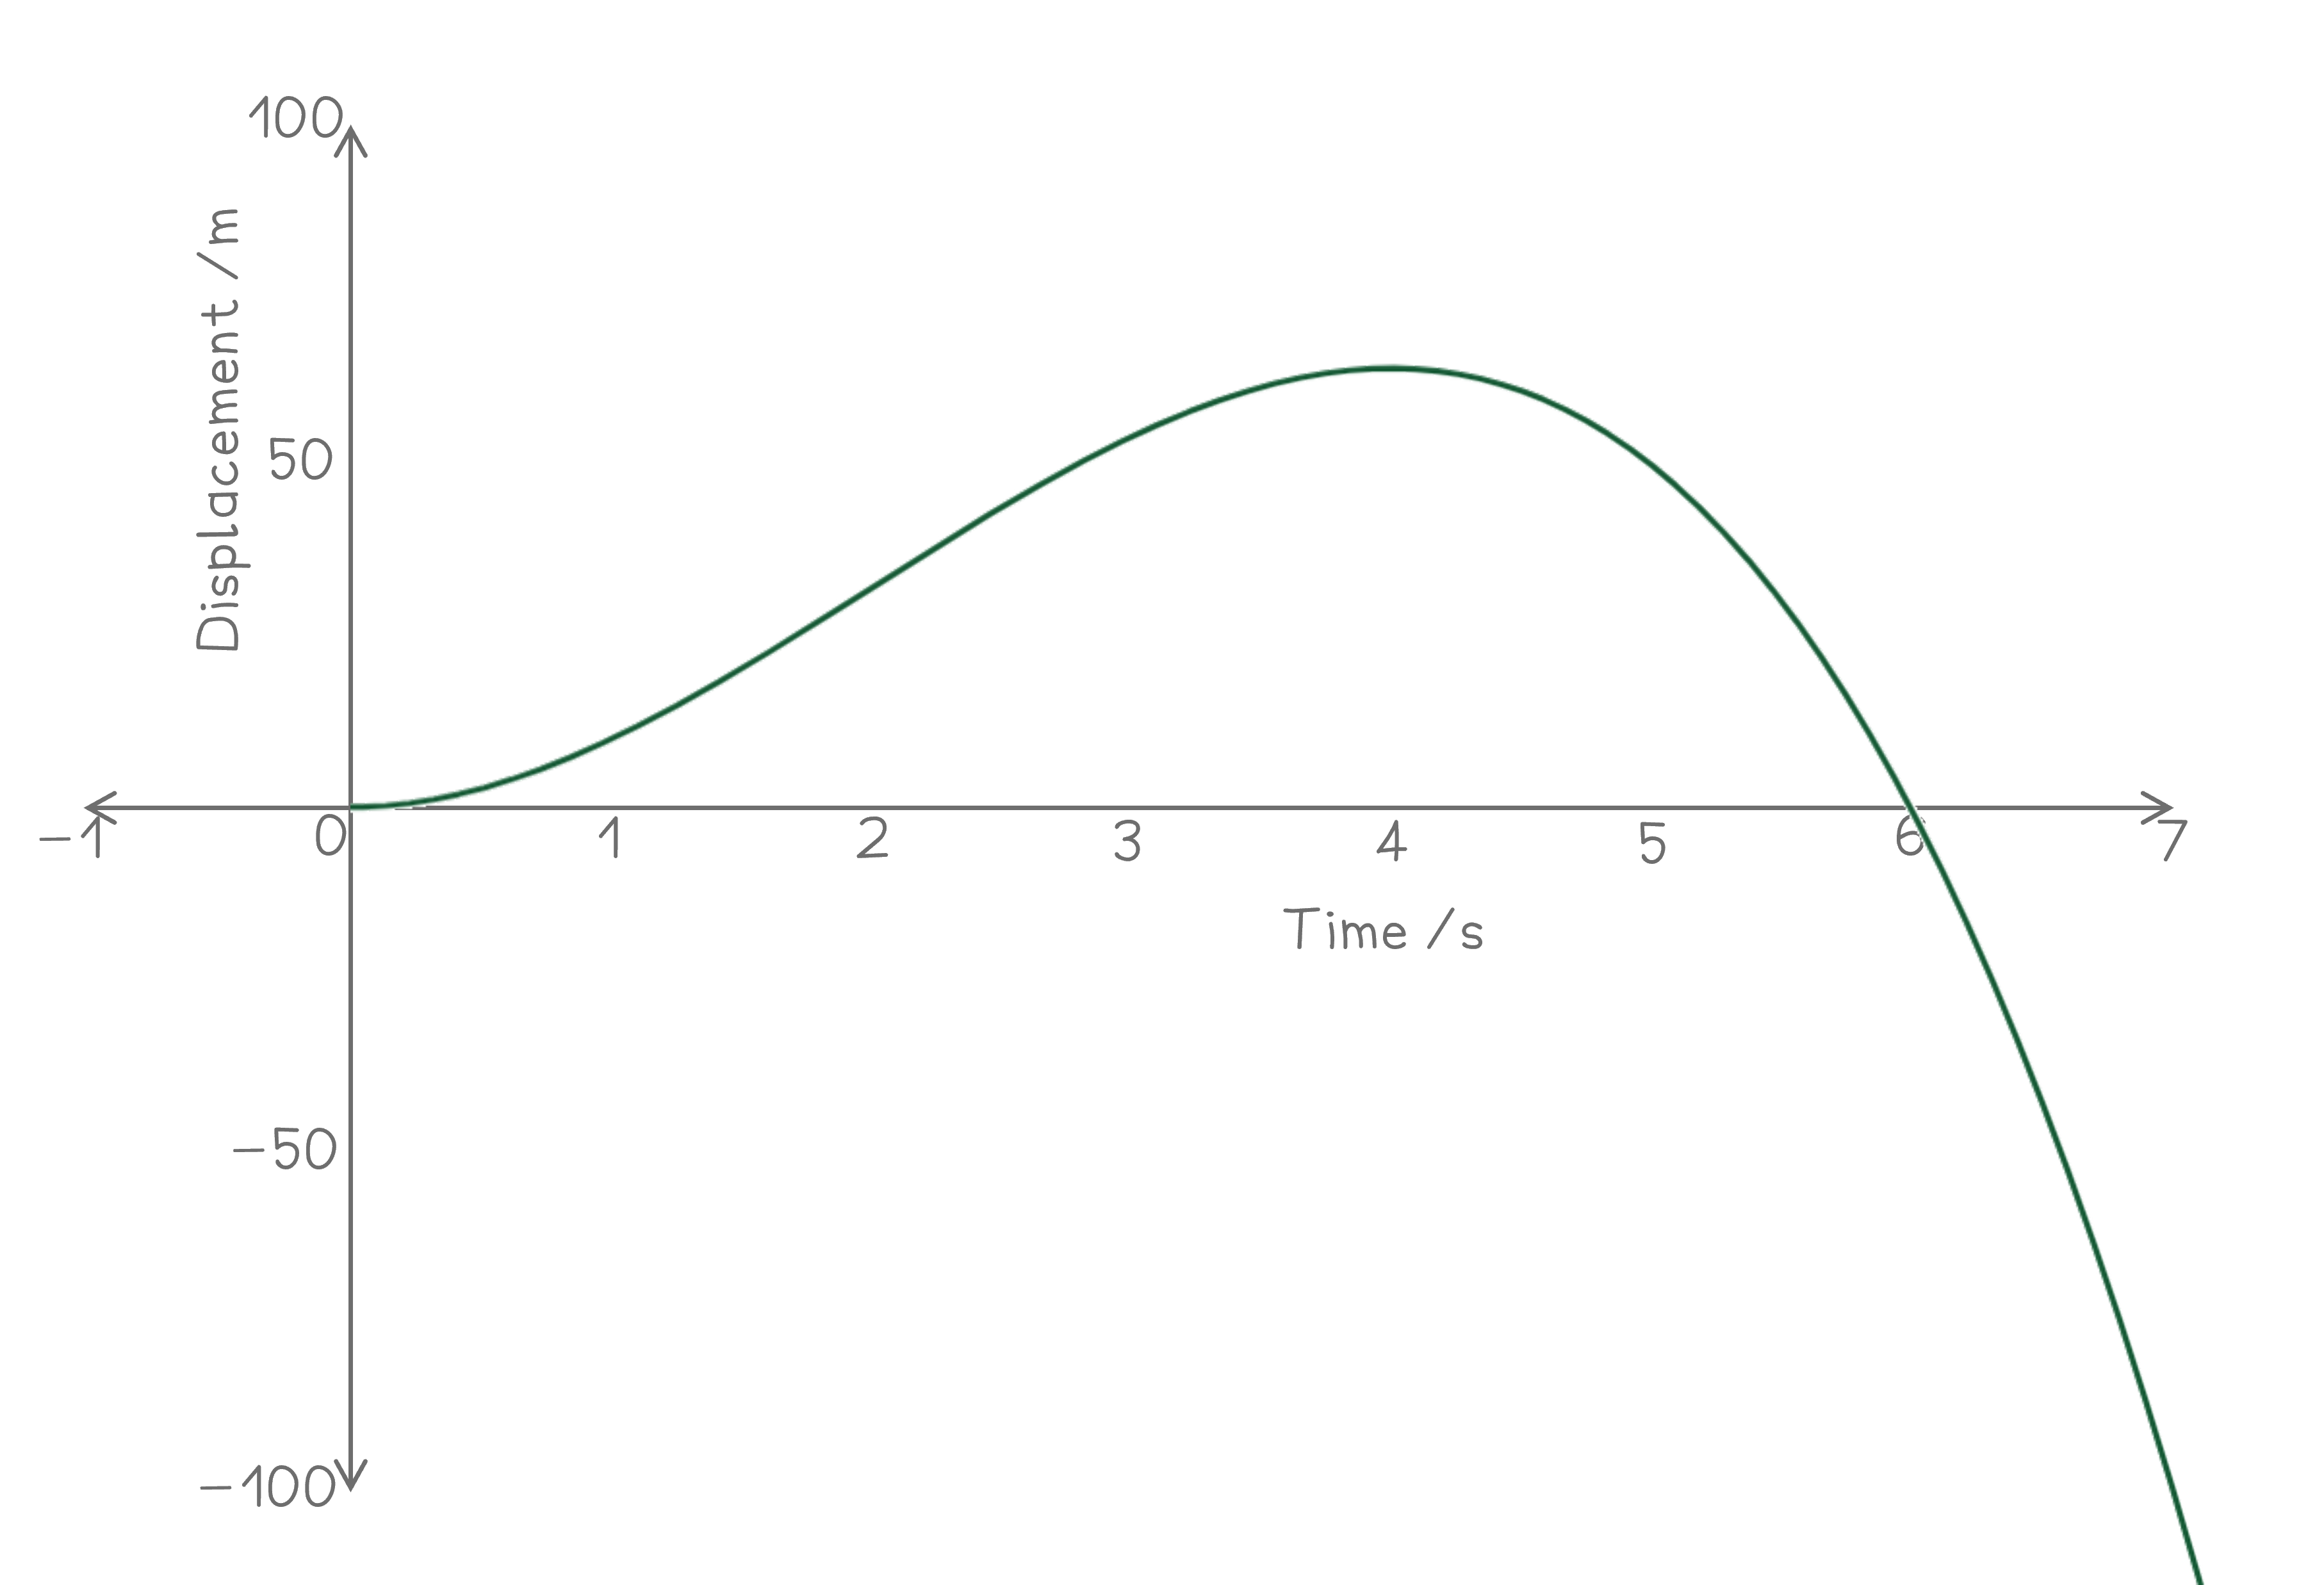
Worked Example A particle moves in a straight line. Its displacement, metres, from a fixed point at time, seconds, is given by for .
Sketch its displacement-time, velocity-time, and acceleration-time graphs.
To sketch the displacement; it can be factorised
s=−2t³+12t²=−2t² (t−6)The roots can then be found
when: (repeated root) and
The graph can then be sketched, noting that it is a negative cubic, and remembering the restriction on the domain;
To find the velocity, differentiate the displacement with respect to (time)
This can be factorised to
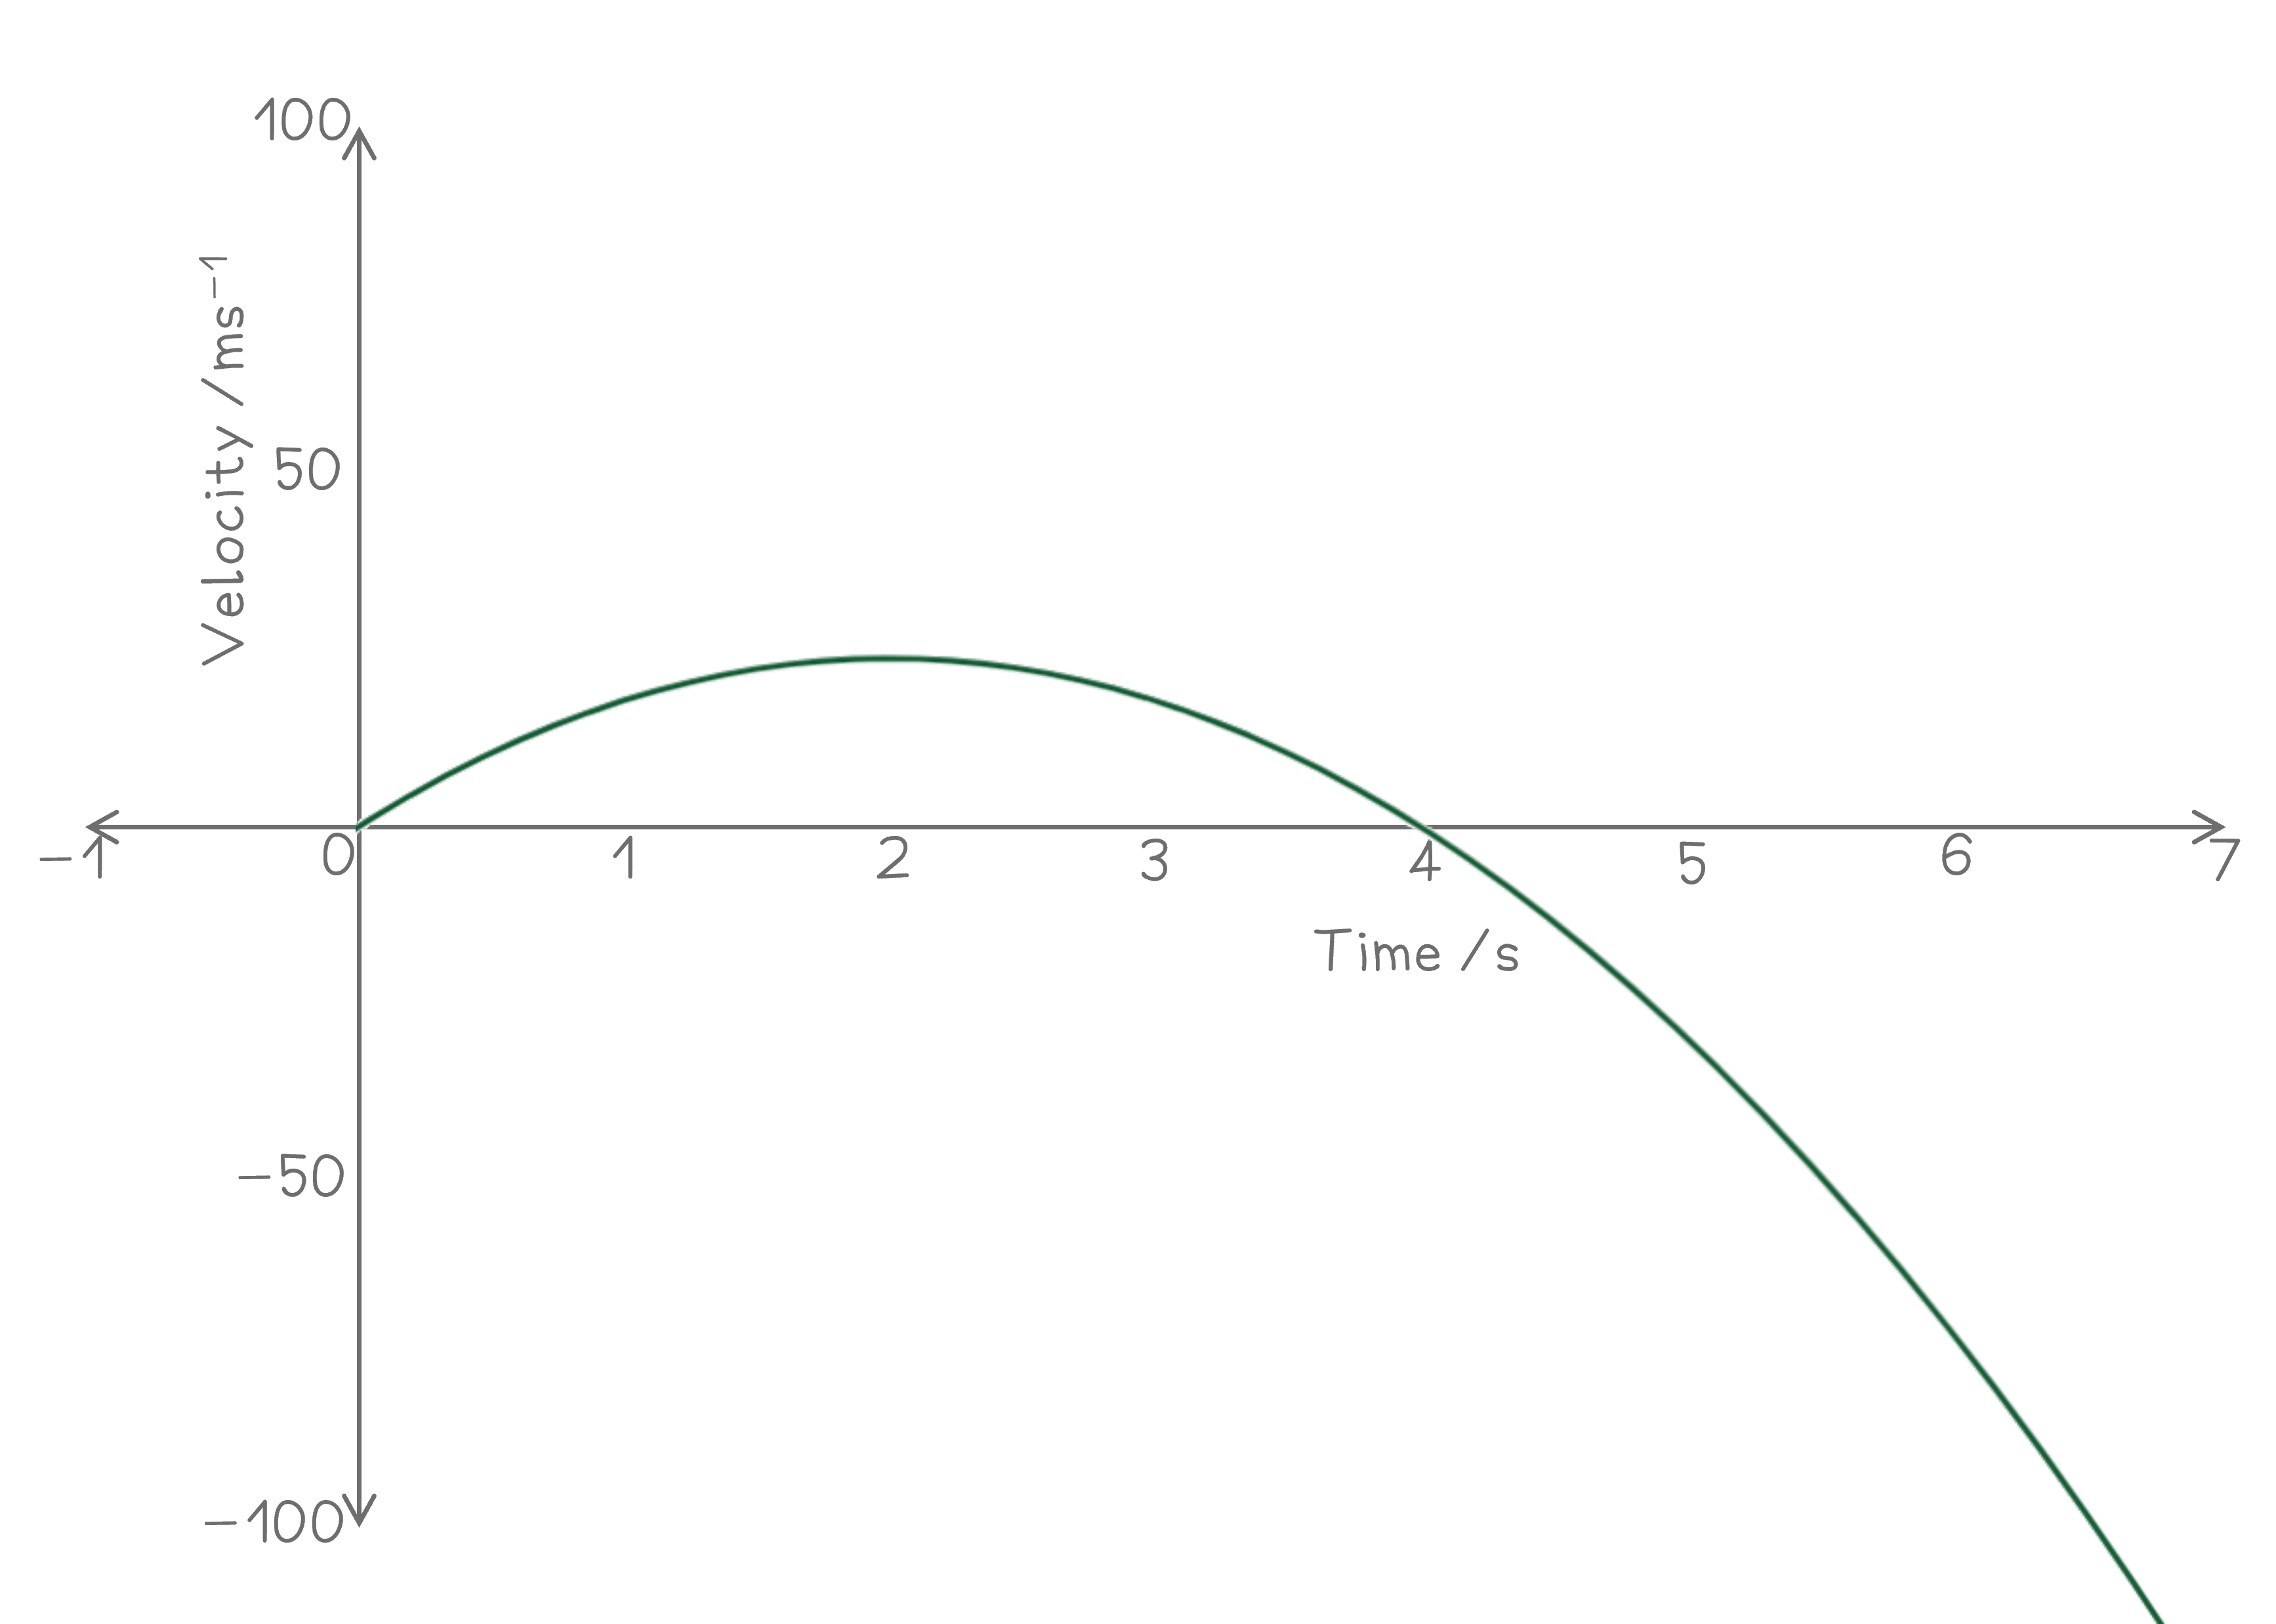
v=−6t (t−4)The roots can then be found
when: and
The graph can then be sketched, noting that it is a negative quadratic, and remembering the restriction on the domain;
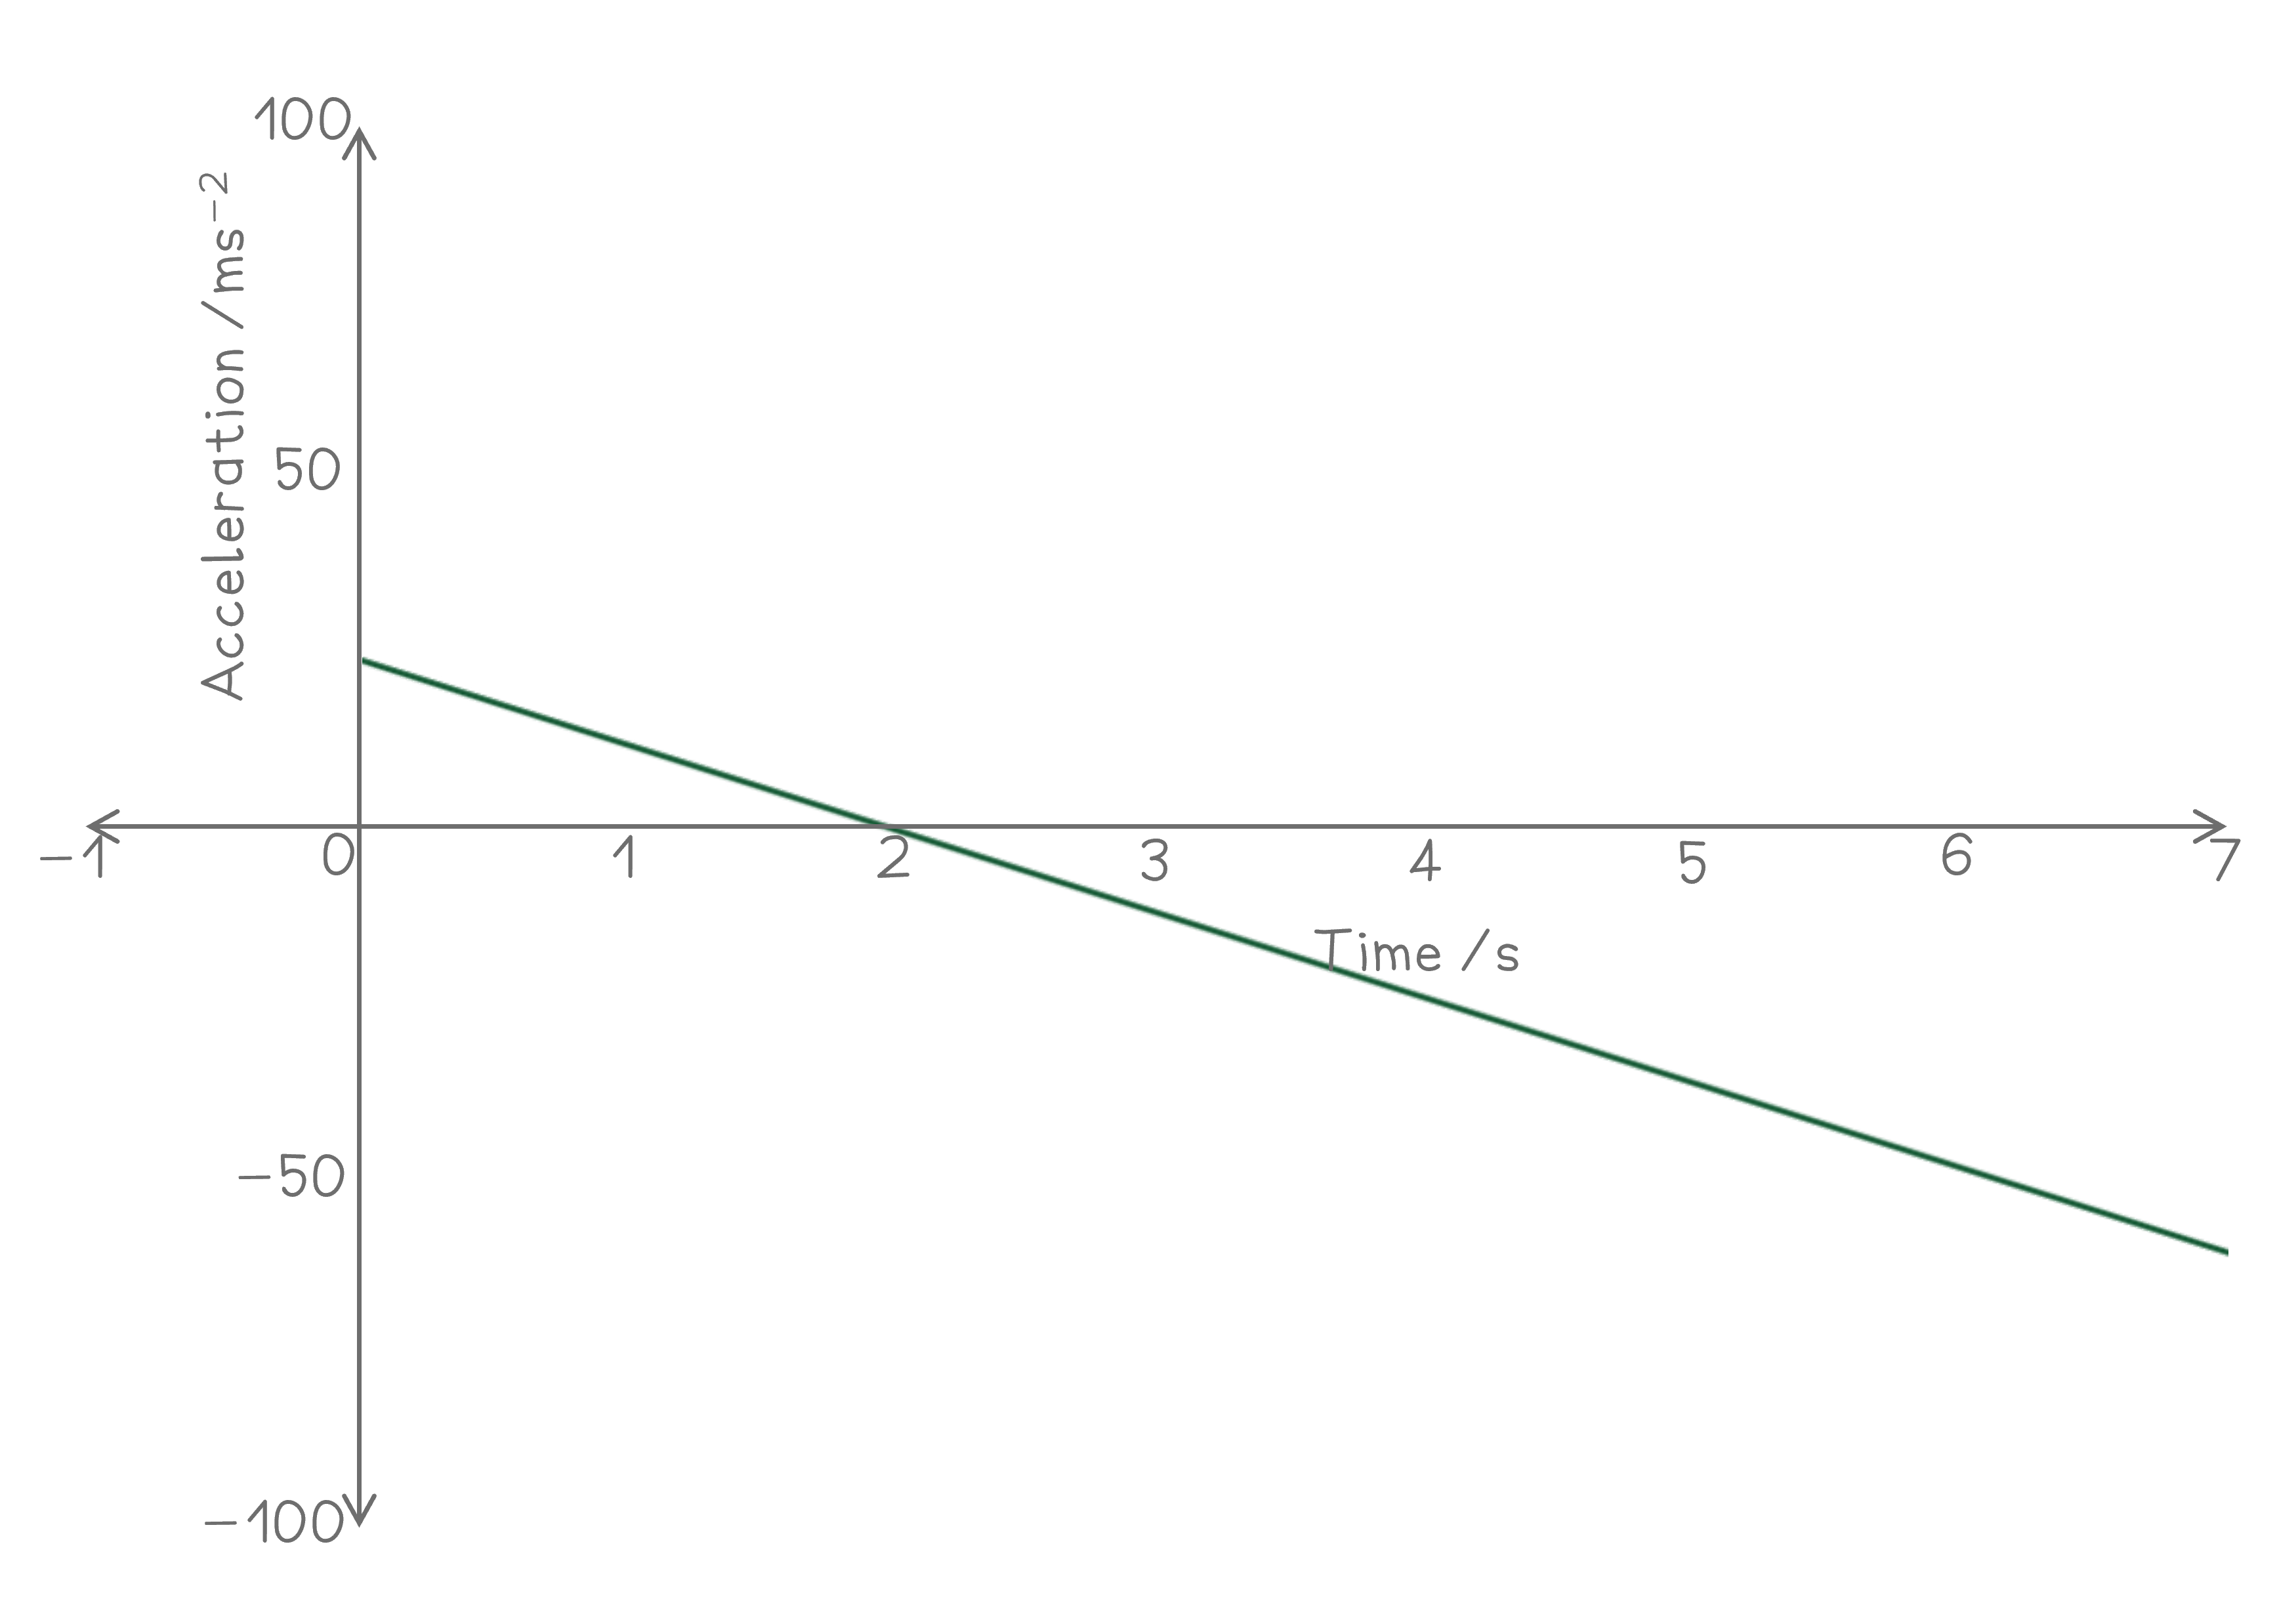
To find the acceleration, differentiate the velocity with respect to This is also the second derivative of the displacement
The graph can then be sketched This is a straight line with -intercept 24, and gradient -12 Remember the restriction on the domain;
Was this revision note helpful?