Labour Market Diagrams (Cambridge International IGCSE Economics)
Drawing and interpreting labour market diagrams
Spec point — Drawing and interpreting labour market diagrams
-
The labour market is a type of factor market
-
Factor markets follow exactly the same rules as product markets
- They are affected by changes to price, demand and supply
- They are affected by the price elasticity of demand and supply
-
Labour market equilibrium occurs where the demand for labour (DL) is equal to the supply of labour (SL)
-
The DL is the demand by firms for workers
- Firms demand more labour as the wage rate decreases, which results in a downward-sloping demand curve
-
The SL is the supply of labour by workers
- Workers supply more labour as the wage rate increases, which results in an upward-sloping supply curve
-
-
Individual firms are price takers in the labour market, as they have to accept the wage rate that workers are being paid in the industry
- If they offer a lower wage, they will likely struggle to recruit workers
- If they offer a higher wage, there will be a large number of workers applying to work there
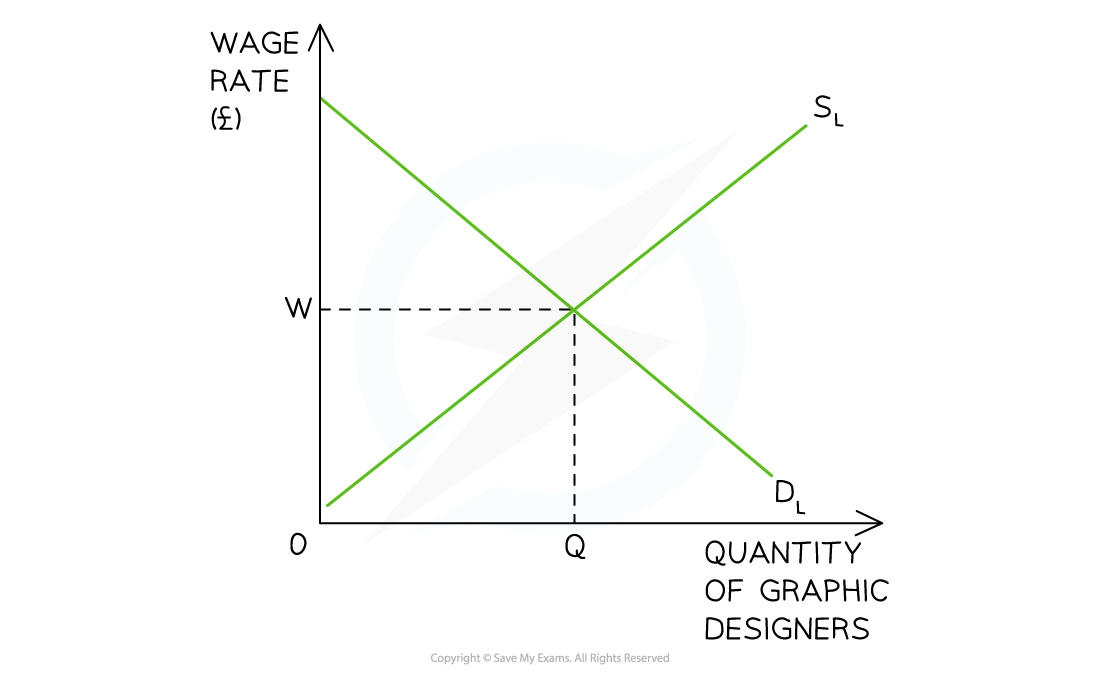
In the labour market for graphic designers, the equilibrium wage rate is W and the equilibrium quantity is Q. At this point the DL = SL
Diagram analysis
- The market for graphic designers is in equilibrium where DL= SL
- The equilibrium wage is W and the quantity of labour is Q
- There is no excess supply of labour
- There is no excess demand for labour
Changes in demand and supply in the labour market
Spec point — Changes in demand and supply in the labour market
1. Increase in demand for labour
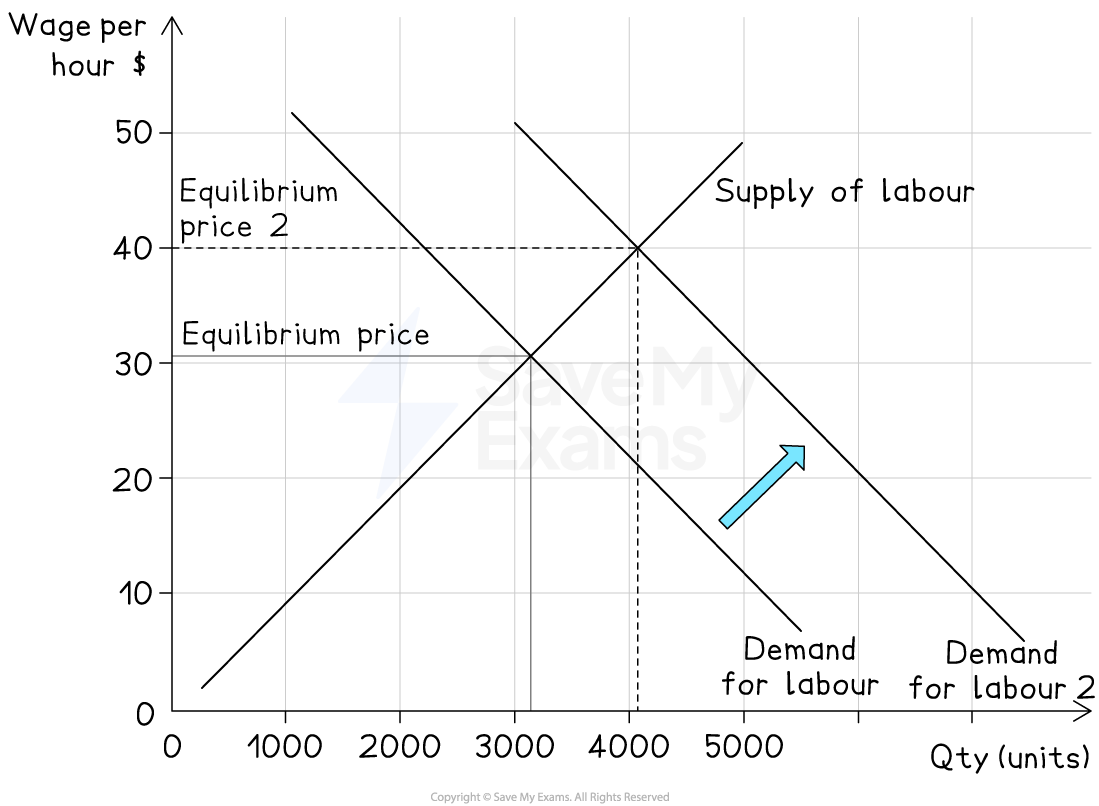
An increase in the demand for labour increases the equilibrium wage rate
-
Cause
- Economic growth, increased demand for goods and services, higher labour productivity
-
Effect on diagram
- Labour demand curve shifts right (D1 → D2)
-
Result
- Higher equilibrium wage rate (W1 → W2) and more labour employed (Q1 → Q2)
2. Increase in supply of labour
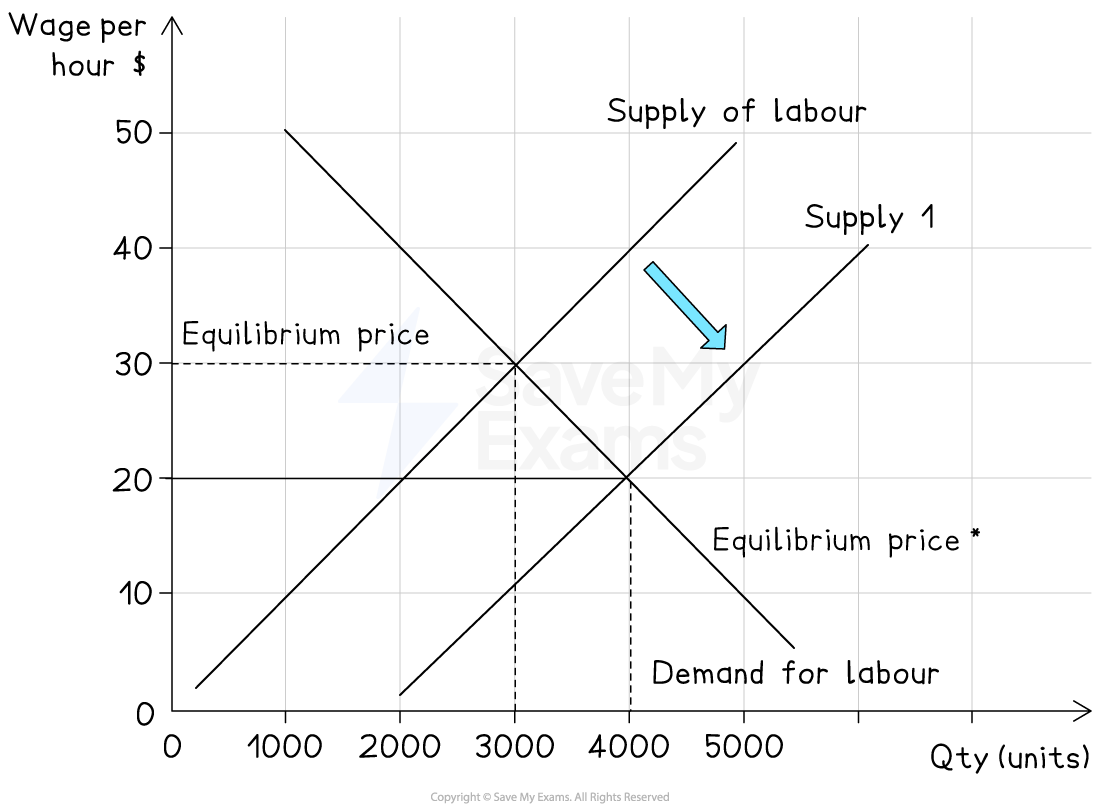
An increase in the supply of labour decreases the equilibrium wage rate
-
Cause
- Immigration, higher working‑age population, more flexible working patterns
-
Effect on diagram
- Labour supply curve shifts right (S1 → S2)
-
Result
- Lower equilibrium wage rate (W1 → W2) and more labour employed (Q1 → Q2)
3. Decrease in demand for labour
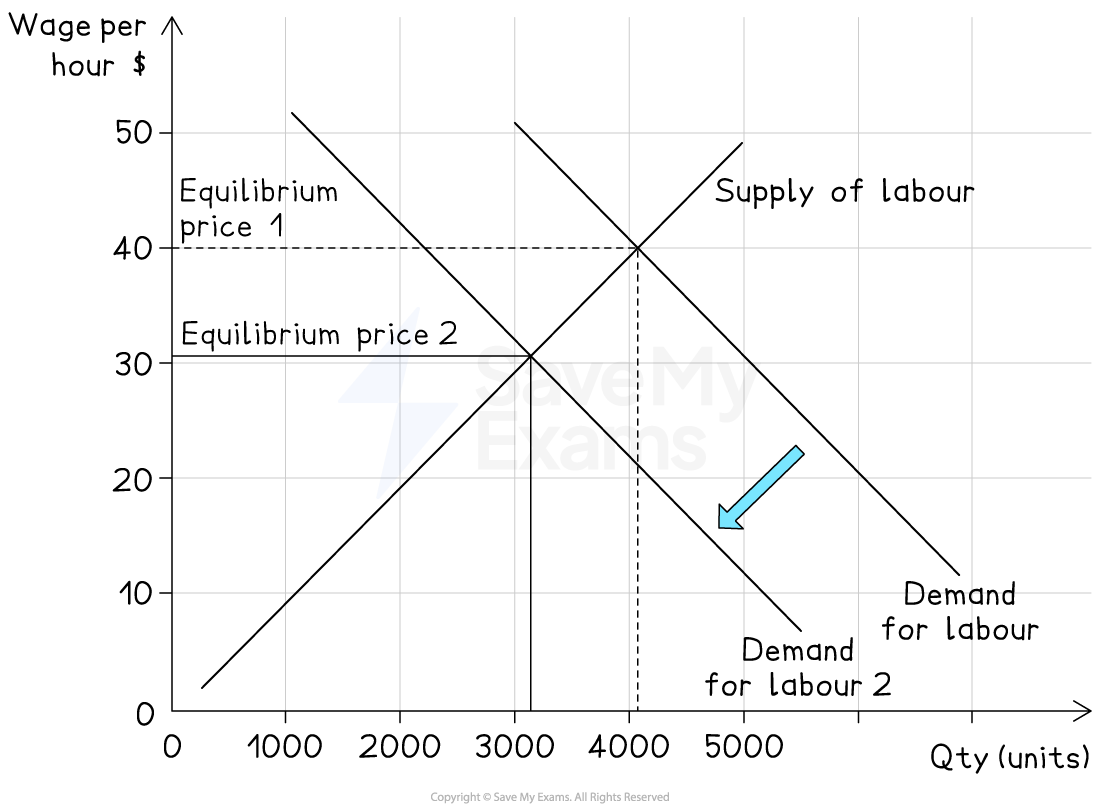
A decrease in the demand for labour decreases the equilibrium wage rate
-
Cause
- Recession, automation replacing workers, falling demand for goods
-
Effect on diagram
- Labour demand curve shifts left (D1 → D2)
-
Result
- Lower equilibrium wage rate (W1 → W2) and less labour employed (Q1 → Q2)
4. Decrease in supply of labour
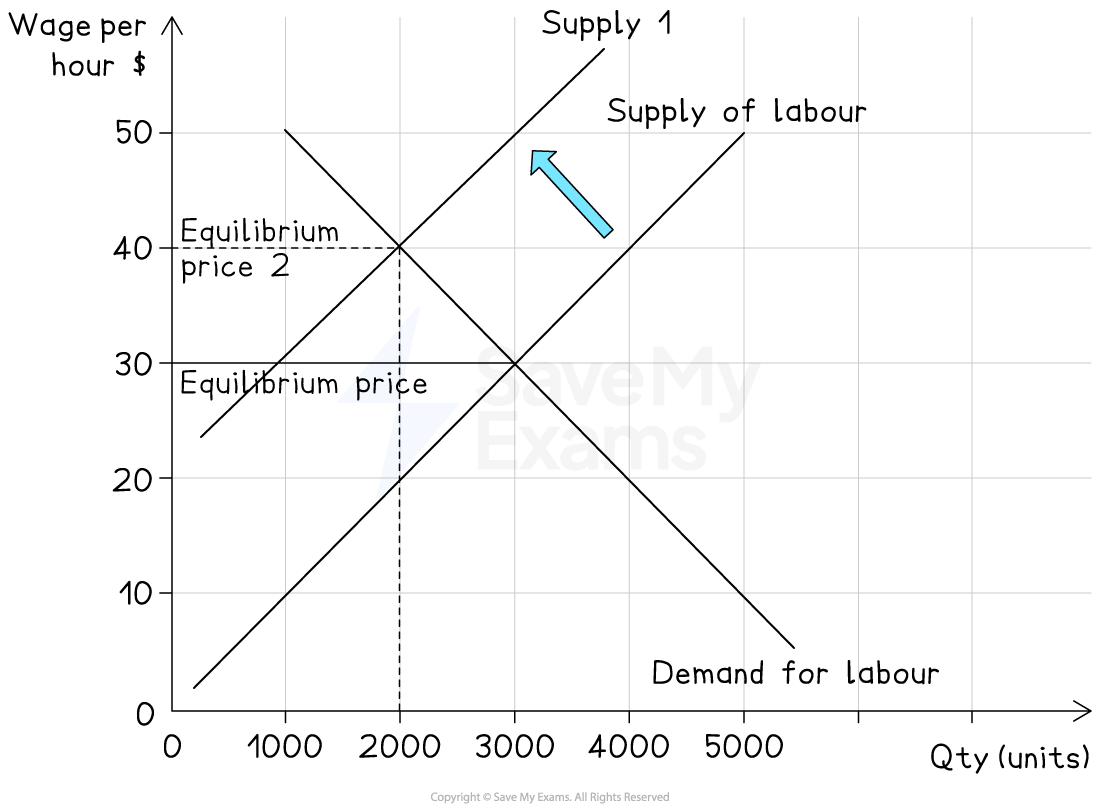
A decrease in the supply of labour increases the equilibrium wage rate
-
Cause
- Ageing population, emigration, higher welfare benefits reducing incentives to work
-
Effect on diagram
- Labour supply curve shifts left (S1 → S2)
-
Result
- Higher equilibrium wage rate (W1 → W2) and less labour employed (Q1 → Q2)
Analysing the PED and PES of labour
Spec point — Analysing the PED and PES of labour
Price inelastic demand and supply
- Consider the labour market for NBA basketball players
- In 2022, LeBron James received a salary of $45m
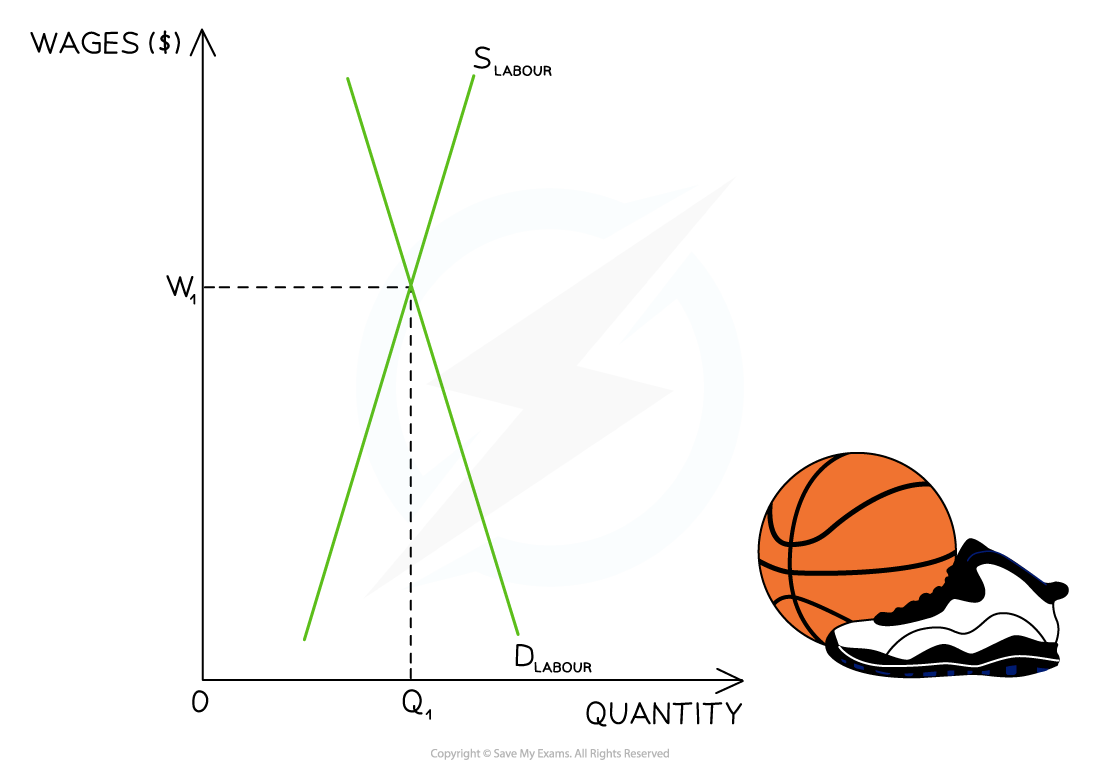
The impact of inelastic demand and supply in the labour market
Diagram analysis
-
DL is the demand for labour from the basketball clubs
-
SL is the supply of labour by the basketball players
-
The demand for highly skilled players is very price inelastic
- Clubs want the very best players, almost irrespective of what they cost
-
The supply of highly skilled players is also very price inelastic
- A significant increase in price will have little impact on the quantity of labour supplied in the market, as it takes years to develop LeBron James-type skills
-
The market equilibrium is found at W1Q1 - a high price and relatively low quantity
Price elastic demand and supply
- Consider the labour market for labourers on a building site
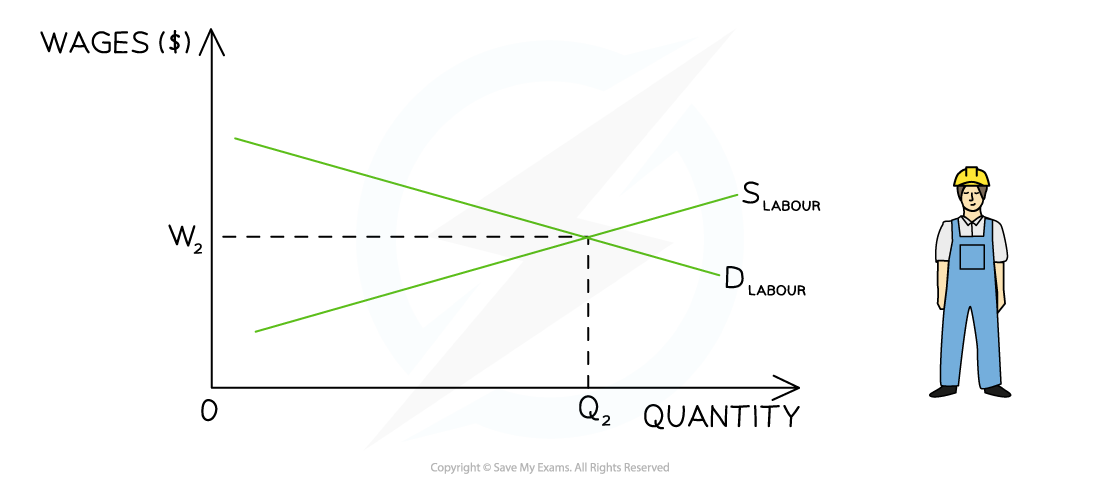
Diagram analysis
-
DL is the demand for labour from the building company for labourers
-
SL is the supply of labour by people willing to work on a building site
-
The demand for workers is very price elastic
- If wages dropped a little, then firms would respond quickly by employing more workers
-
The supply of workers is also very price elastic
- Due to it being an unskilled job, there would quickly be an increase in the supply of labour if wages were to increase
-
The market equilibrium is found at W1Q1 - a low price and relatively high quantity
Was this revision note helpful?
Build on this topic