Can we fit a quadratic to this given data?
Question
In the above table the values of were calculated from a formula , where and are constants. One of the values of , however, has been deliberately misprinted.
Plot the values of against those of , and
- find which value of has been misprinted and give the correct value,
- estimate the numerical values of and .
Suggestion
In the above table the values of were calculated from a formula , where and are constants. One of the values of , however, has been deliberately misprinted.
Plot the values of against those of , …
Why does the question ask us to use rather than ?
Solution
In the above table the values of were calculated from a formula , where and are constants. One of the values of , however, has been deliberately misprinted.
Plot the values of
against those of
…
We have the following calculated data:
The data are plotted below.
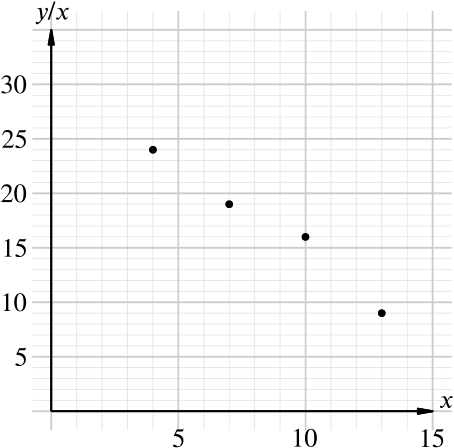
If , then .
This is the equation of a straight line, so, given the information in the question, we should expect to find a line through three of the four points plotted above. This is in fact the case!

From the plot above, the incorrect value of is the one corresponding to , namely .
Since the correct value of must lie on the line, this value is , and so the correct value of is .
The equation of the blue line is , so we can find the value of by finding the gradient of the line and the value of by finding its -intercept.
The gradient of the line in the plot above is (from looking at the points where and ) so . Taking the point with , , we have so .
If we were doing this problem using real-world data rather than calculated figures, we would not use our data points to find the equation of the line (and hence and , but would instead use points on the line itself. In this case, though, these are the same thing.