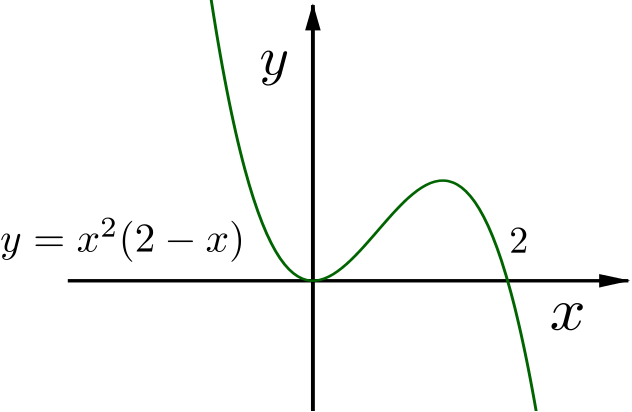
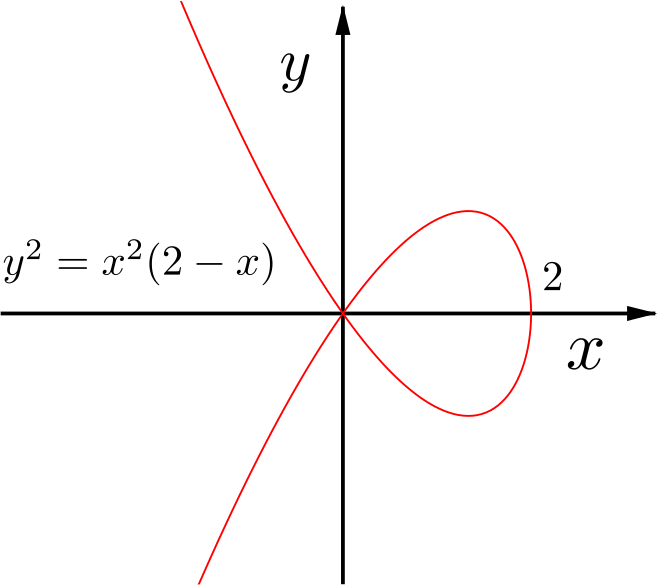
Can we sketch , and from this, ?
Question
Draw a sketch-graph of the curve whose equation is
Hence, or otherwise, draw a sketch-graph of the curve whose equation is
indicating briefly how the form of the curve has been derived.
Solution
The polynomial on the right-hand side has a double zero at the origin and a zero at .
Further,
so the curve has two stationary points, at and .
Since the leading term of the polynomial is , as , and as .
Consequently, the first stationary point must be a local minimum and the second stationary point must be a local maximum.
This information, when put together, leads to the following sketch.
Firstly, note that this curve does not exist where the right hand side is negative, that is when . This corresponds to where the curve in the first part of the question is below the -axis.
For other values of , the curve has two branches, .
The curve cuts or touches the -axis at and at .
So we have some kind of loop above and below the -axis between and , while for the curve is in two branches, one increasing and the other decreasing.
In order to discover the nature of the axis crossings, we could think about how behaves and what happens when we multiply it by . Alternatively, we can do some calculus.
Differentiating implicitly
we find
As approaches , and . So a tangent to the curve at would be vertical.
We can’t evaluate at the origin, but nearby is very small so . This means that and we have Hence the curve passes through the origin with gradient .
The curve whose equation is
has two parts, each the reflection of the other in the -axis:
The restriction that is necessary, since if and only if . We have a graph of the function , so we need to think how a graph is transformed by the map . The three points where are invariant; both the old curve and the new curve go through all three points. The new curve will be ABOVE the old curve for $0
1y^2 > yx \mapsto \sqrt{x}x\sqrt{x}x\sqrt{x}$ decreases. In particular, the stationary points remain stationary points as, by the
,
when is a function such that .
We are led, then, to the following sketch.
** Both curves are plotted together below.