Problem areas
Excerpt: Students are asked to decide which of two functions has the greater area between and without using calculus. The functions share several key features, but one of the functions is not drawn for them, so students will have to sketch this function before thinking about the similarities and differences between the two.
Problem
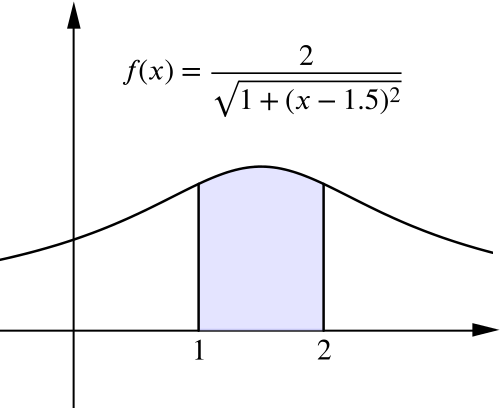
What can you say about the area under each function on the two cards below, between and ?
Which is greater?
| (a) | (b) |
|---|
-
What’s the same and what’s different about these two functions?
-
How might this affect your approach if you wanted to calculate the area under each?
Suggestion
Card (a)
Given that we have a graphical representation for the other function, it would make sense to think about what this might be before we dive into any calculations.
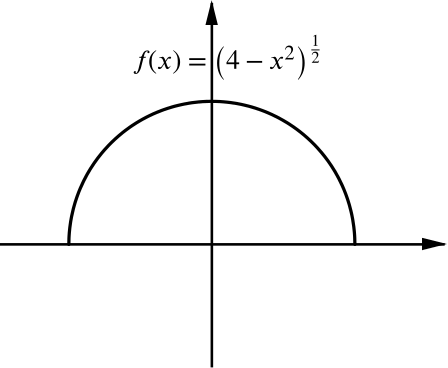
We are dealing with the function . If this were written in the form we might be tempted to square both sides of the equation and rearrange to obtain which should look familiar!
However, when we produce a sketch we must not lose sight of the original function.
What does it look like?
-
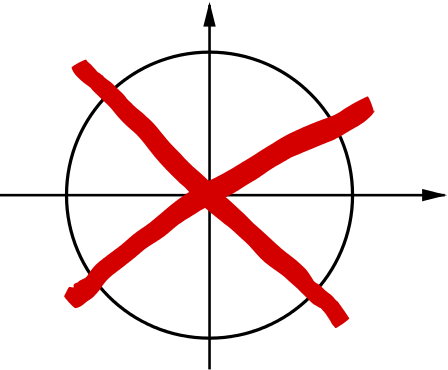
Why is the graphical representation on the left correct? Why is the one on the right incorrect?
-
Where does the function meet the -axis?
-
Where does the function intercept the -axis?
-
How can we now calculate the area under the function between and ?
Card (b)
This curve looks as though it it symmetrical about . How can we decide for certain if this is the case?
We might notice that this function is a horizontal translation of .
-
Is this an odd or even function?
-
What can this tell us about the properties of its graphical representation?
-
Why might it be useful for us to know that the original curve is symmetrical about ?
-
Can we establish maximum and minimum values for the shaded area that will enable us to determine whether it is greater than or less than the area on card (a)?
What do you notice if you plot the two functions on the same axes?
Things you might have noticed
Card (a)
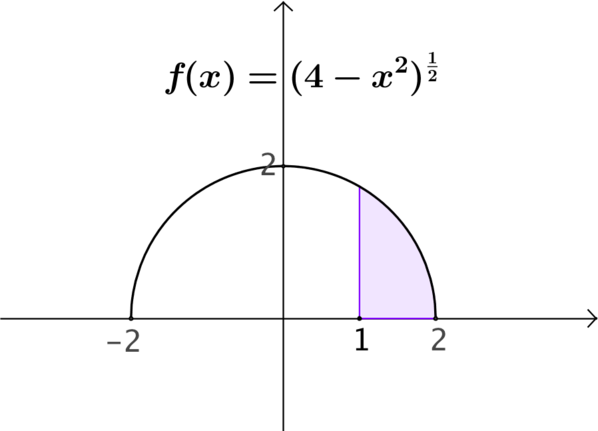
The given function represents a semi-circle of radius , centred on the origin. The area we are concerned with is shaded in purple.
Cards (a) & (b)
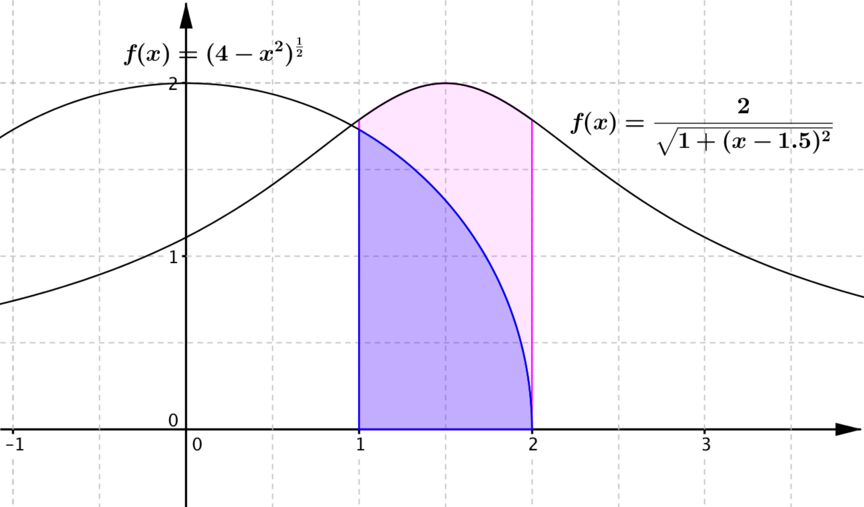
It makes sense to begin our comparison by plotting the two functions on the same axes. Based on our subsequent observations we can think about accuracy and perhaps consider alternative approaches as a comparison.
-
How can you convince someone that the maximum value of each function is the same?
-
What can you say about the area under each function on the two cards between and ?
Some possible observations
-
The maximum value of will occur when the denominator, , is at a minimum. The expression inside the square root cannot take a value less than and the minimum value will occur when , corresponding to . Substituting this value of into the function we have So the maximum point on the graph of occurs at coordinates and the functions on the two cards have the same maximum value.
-
Looking at the combined graph, it is clear that the area under the function on card (b), , is greater than that on card (a), , between and . We can also say that the area on card (b) is less than double that on card (a). Can we be any more specific about the proportion of the area on card (b) taken up by the area on card (a)?
Thinking more about card (a)
With the function on this card we can calculate the required area exactly.
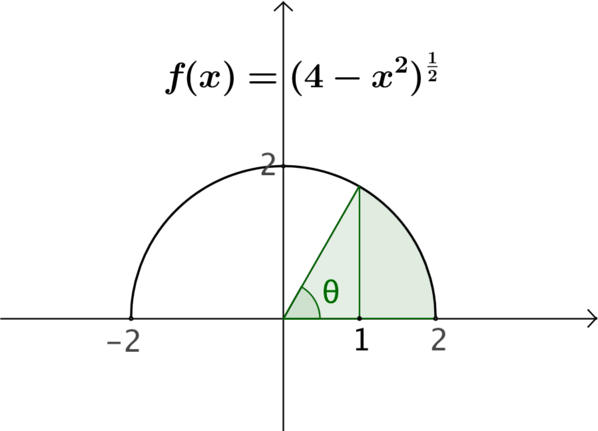
We can exploit the fact that we know we are looking at a semi-circle. In the diagram below we can see that the green sector is made up of the purple area that we want plus a right-angled triangle (of base length and hypotenuse length ).
We can therefore obtain the required area by first calculating of the green sector and then subtracting the area of the triangle.
Calculating the area of the sector
In order to calculate the area of the sector we need to know what proportion it is of the original semi-circle. We can deduce this from the value of the angle .
By applying trionometry to the right-angled triangle we find that
This means that the green sector is exactly of the area of the semi-circle, and therefore has an area of .
We have chosen to express the angle in radians.
We could just have easily used degrees with the same result:
Calculating the area of the triangle
We know that the base length of the triangle is and that its hypotenuse is of length . There are now two ways in which we could determine its vertical height: we could directly apply Pythagoras’ Theorem, or we could find the value of .
Using either approach, the height of the triangle is found to be . Therefore the area of the triangle will be .
Calculating the original purple area
The area under the curve between and can now be calculated as
The approximate decimal value may useful when we come to compare this area to that on card (b).
Thinking more about card (b)
We do not yet have any techniques for finding an exact value for this area. We can however find an approximation for the area that will allow us to answer the question posed in this problem.
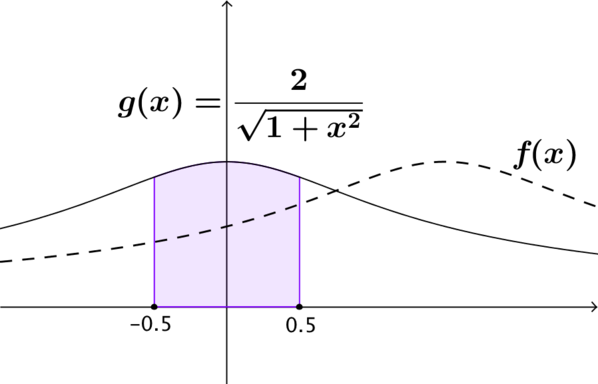
The function shown on this card is a horizontal translation of the function and will therefore have the same area as between and .
We can show that and hence that is an even function. This in turn means that is symmetrical about (and that is symmetrical about ).
Exploiting the symmetry properties of this function will reduce the amount of work we need to do to obtain an approximate value for the area that is ‘good enough’ for this problem.
It now doesn’t matter whether we return to the original function, , or follow through our working with the translated function, , (we have already observed that the areas are equivalent as long as we look at the translated region). If we choose to work with , we need to consider a method of approximating the area under between and (doubling this value will then give us an estimate for the whole area between and ).
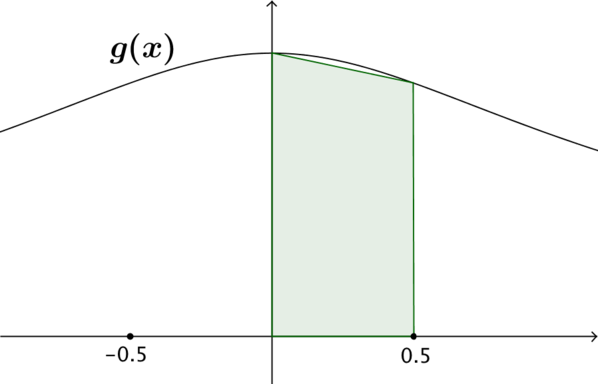
We might choose to use a single trapezium to do this in the first instance, giving us a lower bound for the area.
In this case we can write
Now, we can see that this is an under-estimate of the area and so we can say
We might have chosen to use the trapezium rule, dividing the area into two trapezia, each of width (or ) giving
Using software such as GeoGebra to compute the area we find that our approximate value is actually correct to two decimal places. This level of accuracy was achieved by completing calculations for just two trapezia, the equivalent of dividing the total area into four trapezia.
-
Can this level of accuracy be guaranteed when using the trapezium rule, with four trapezia, to estimate areas under other functions?
-
What is it about this function that makes the trapezium rule such a good fit?
-
What can we say now about the proportion of the area on card (b) taken up by the area on card(a)?