The Performance of Firms in Perfect Competition (Cambridge International A-Level Economics)
Revenue in perfect competition
-
The firm does not have any market power so it is unable to influence the price and quantity
- The firm is a price taker due to the large number of sellers
- The firm's selling price is the same as the market price, P1= MR = AR = Demand
The relationship between TR, AR & MR when price = $8
| Q | TR | AR | MR |
|---|---|---|---|
| 5 | 40 | 8 | 8 |
| 6 | 48 | 8 | 8 |
| 7 | 56 | 8 | 8 |
| 8 | 64 | 8 | 8 |
- The situation in the table above is illustrated in the diagram below
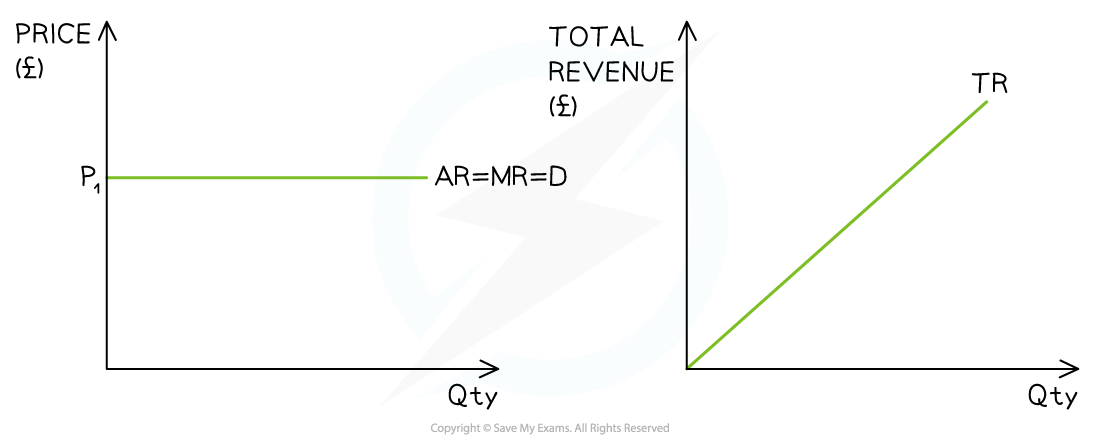
An illustration of the relationship between AR, MR & TR in a perfectly competitive market
Observations
-
The firm is a price taker at P1 ($8)
- Every unit of output is sold at the same price
- A higher price would decrease sales to zero
- A lower price would result in all sellers lowering their price
-
TR increases at a constant rate
-
MR = AR = Demand
The role of the MC curve
- The MC curve shows the cost of producing one additional unit
- As price changes, the firm changes output to the point where P = MC
- This means the MC curve determines the quantity supplied at each price
Deriving the supply curve
- For every possible price, the firm produces the output where P = MC
- Plotting these output decisions across different prices traces the firm’s supply curve
Long run equilibrium in perfect competition (normal profit)
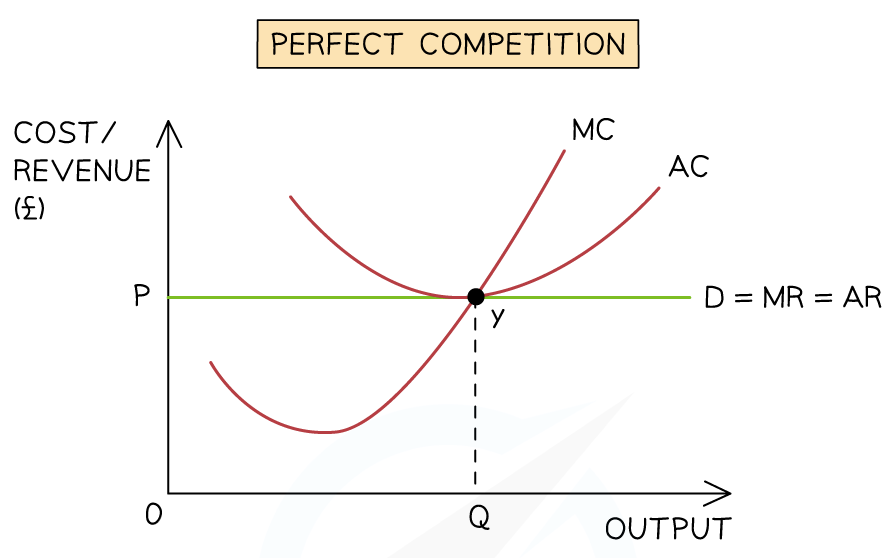
Diagram observations
- The MC curve represents the cost of producing one additional unit of output
- In a perfectly competitive market, the firm maximises profit where MC = MR
- Because the firm is a price taker, MR = AR = P, which is shown by the horizontal demand curve
- The profit-maximising output is therefore Q, where the MC curve intersects the price line
- If MC were below price, producing an additional unit would add more revenue than cost, so the firm would increase output
- If MC were above price, producing an additional unit would increase costs more than revenue, so the firm would reduce output
- Therefore, the MC curve determines the output supplied at each market price
- For this reason, the upward-sloping section of the MC curve represents the firm’s short-run supply curve
Profits
-
In order to maximise profit, firms in perfect competition produce up to the level of output where marginal cost = marginal revenue (MC=MR)
-
The firm does not have any market power so it is unable to influence the price and quantity
- The firm is a price taker due to the large number of sellers
Firms in perfect competition making supernormal profits
-
Firms in perfect competition are able to make supernormal profit in the short-run
- A seller may gain a competitive advantage for a short period of time, which allows them to make supernormal profit
-
However, they will always return to the long-run equilibrium (see diagrm above) where they make normal profit
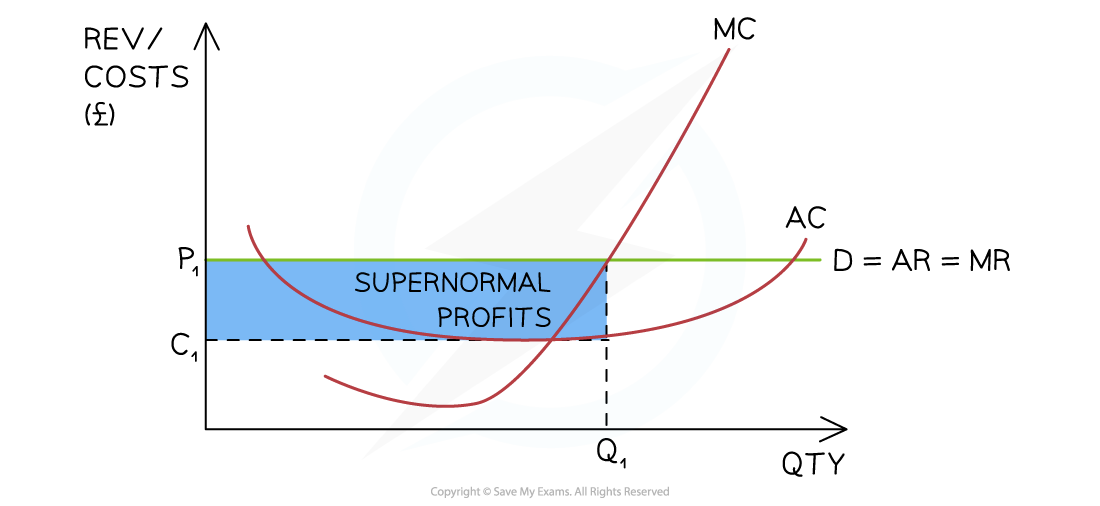
This firm is making abnormal profit in the short-run as the AR > AC at the profit maximisation level of output (Q1)
Diagram analysis
-
The marginal cost curve (MC) is the **supply curve **of the firm
-
The firm is producing at the profit maximisation level of output, where MC=MR (Q1)
- At this point, AR (P1) > AC (C1)
- The firm is making supernormal profit
Supernormal profit eliminated in the long run
-
If firms in perfect competition make supernormal profit in the short-run, new firms are attracted to the industry
-
They are incentivised by the opportunity to make supernormal profit
-
There are no barriers to entry
- It is easy to join the industry
-
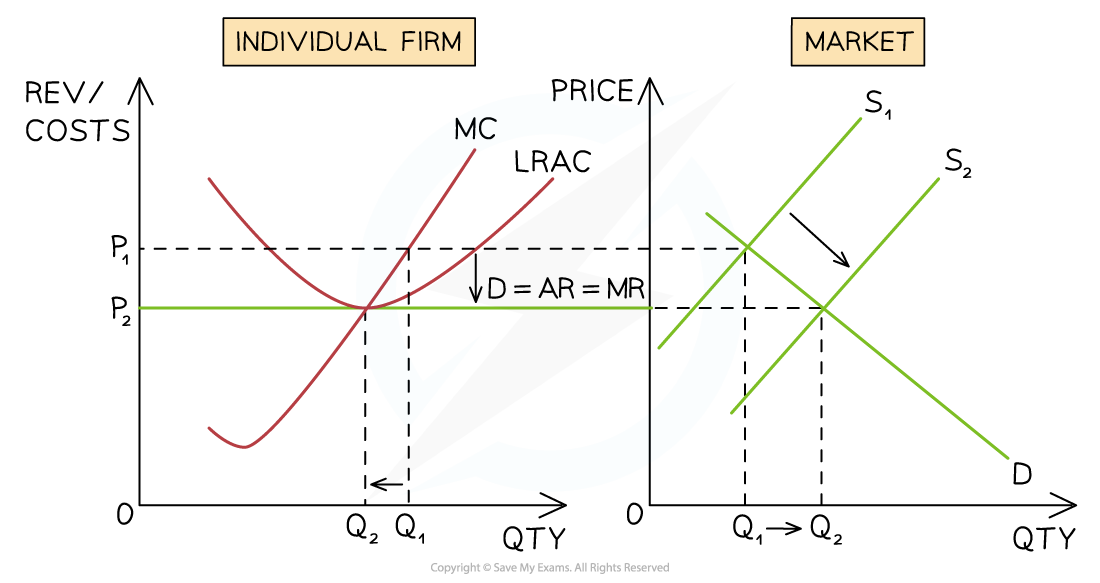
*New entrants shift the industry supply curve to the right (S1→S2 ) which changes the industry price from P1→P2. The firm can now only sell its products at P2 *
Diagram analysis
-
The firm is initially producing at the profit maximisation level of output, where MC=MR (Q1)
- At this level of output, AR (P1) > AC (P2) and the firm is making supernormal profit
-
Incentivised by profit, new firms join the industry and supply increases from S1→S2
- Overall quantity in the industry increases from Q1→Q2
- The industry price falls from P1→P2
-
The firm has to now sell its products at the industry price of P2
- The output of the firm falls from Q1→Q2 as it now has a smaller market share of the larger industry
-
At the profit maximisation level of output (MC=MR) the firm is now producing at the point where AR= AC
- The firm is making normal profit
-
In the long-run, firms in perfect competition always make normal profit
Short-run losses in perfect competition
-
Firms in perfect competition are able to make losses in the short-run
- Periods of intense competition can cause prices to fall below the average costs
- New firms may enter the industry. This results in the market share being divided up between more competitors and some individual firms may start making a loss
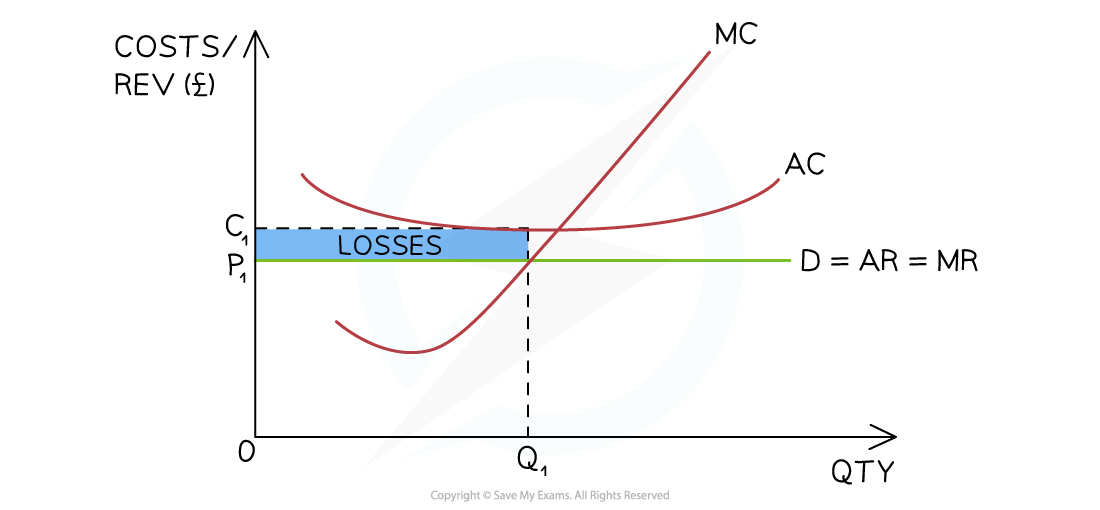
This firm is making losses in the short-run as the AR < AC at the profit maximisation level of output (Q1)
Diagram analysis
-
The firm is producing at the profit maximisation level of output, where MC=MR (Q1)
- At this level of output, the AR (P1) < AC (C1)
- The firm's loss is equivalent to
Losses are eliminated in the long run
-
If firms in perfect competition make losses in the short-run, some will shut down
- The shut down rule will determine which firms shut down
- There are no barriers to exit, so it is easy to leave the industry
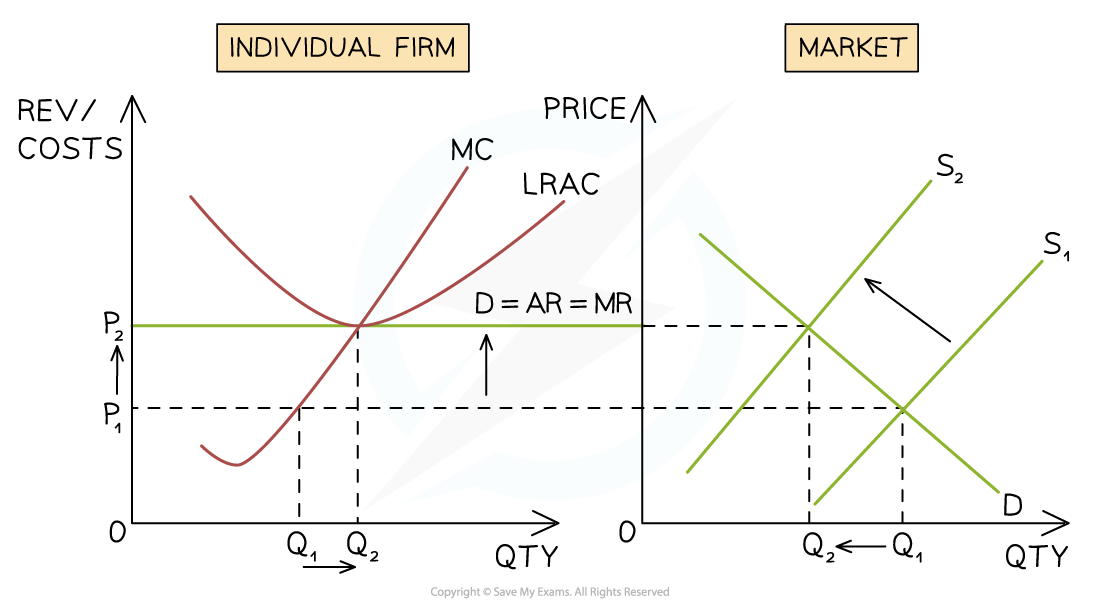
* Firms leaving the industry shift the industry supply curve to the left (S1→S2 ) which changes the industry price from P1→P2. Remaining firms can now sell products at P2 which returns it to a position of normal profit*
Diagram analysis
-
The firm is initially producing at the profit maximisation level of output, where MC=MR (Q1)
- At this level of output, the AR (P1) < AC (C1) and the firm is making a loss
-
Some firms leave the industry, and supply decreases from S1→S2
- Overall quantity in the industry falls from Q1→Q2
- The industry price increases from P1→P2
-
The firm now has to sell its products at the industry price of P2
- The output of the firm increases from Q1→Q2 as it now has a larger market share of the smaller industry
-
At the profit maximisation level of output (MC=MR) the firm is now producing at the point where AR= AC
- The firm is making normal profit
-
In the long-run, firms in perfect competition always make normal profit
- Firms making a loss leave the industry
- Firms making supernormal profit see them slowly eradicated as new firms join the industry
Efficiency in perfect competition
-
Allocative efficiency occurs at the level of output where average revenue = marginal cost (AR = MC)
- At this point, resources are allocated in such a way that consumers and producers get the maximum possible benefit
- No one can be made better off without making someone else worse off
- There is no excess demand or supply
-
Productive efficiency occurs at the level of output where marginal cost = average cost (MC=AC)
- At this point average costs are minimised
- There is no wastage of scarce resources & a high level of factor productivity
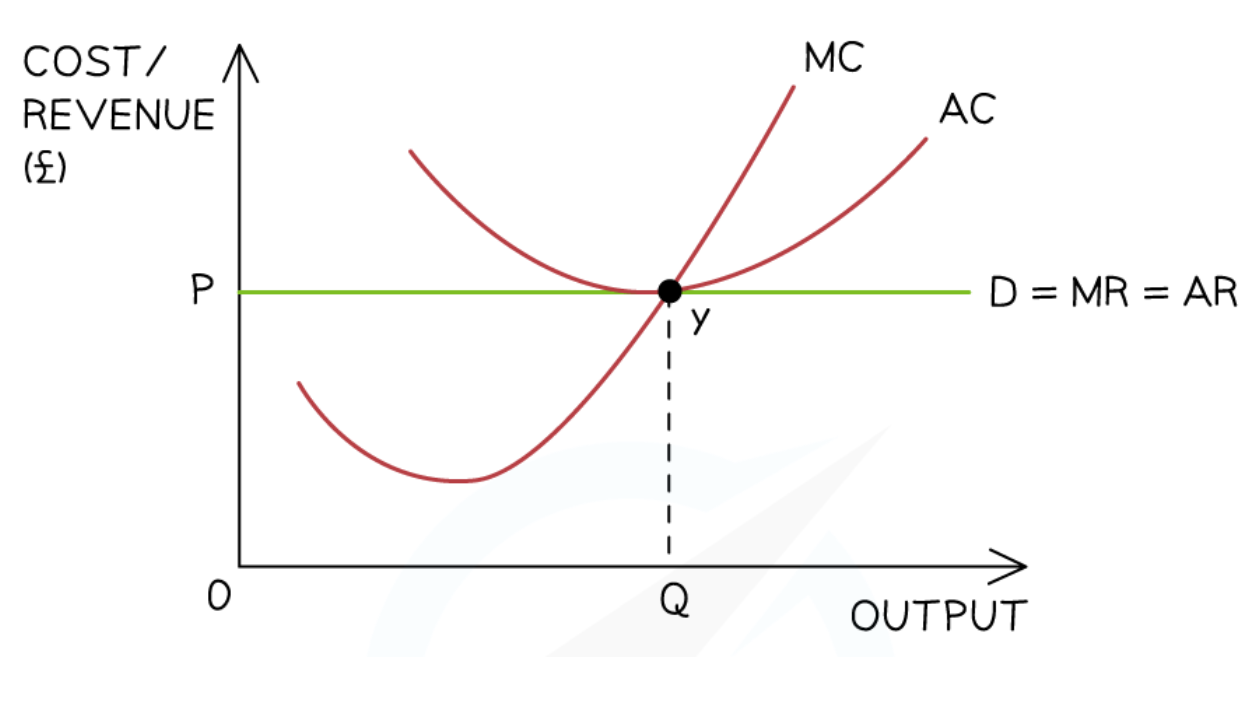
*A perfectly competitive market benefits from both productive and allocative efficiency in the long-run *
Diagram analysis
- The firm produces at the profit maximisation level of output where MC=MR (Y)
- The firm is productively efficient as MC=AC at this level of output
- The firm is allocatively efficient as AR (P)=MC
Exam Hint You should look to demonstrate your awareness that perfect competition provides a benchmark for judging the extent to which real-world markets perform efficiently or inefficiently
Wherever relevant, critically assess the proposition that perfectly competitive markets lead to an efficient allocation of resources
Was this revision note helpful?
Build on this topic