Long-Run Costs (Cambridge International A-Level Economics)
Long-run average costs
-
The long-run average cost (LRAC) curve shows the lowest possible average cost of production at each level of output when a firm can vary all factors of production
- In the long run, firms can change plant size, adopt new technology and reorganise production
- This flexibility allows firms to move to the most efficient scale of production
-
The LRAC curve is typically U-shaped
- At low levels of output, firms experience economies of scale, causing average costs to fall
- At higher levels of output, diseconomies of scale cause average costs to rise
Shape of the long-run average cost curve (LRAC)
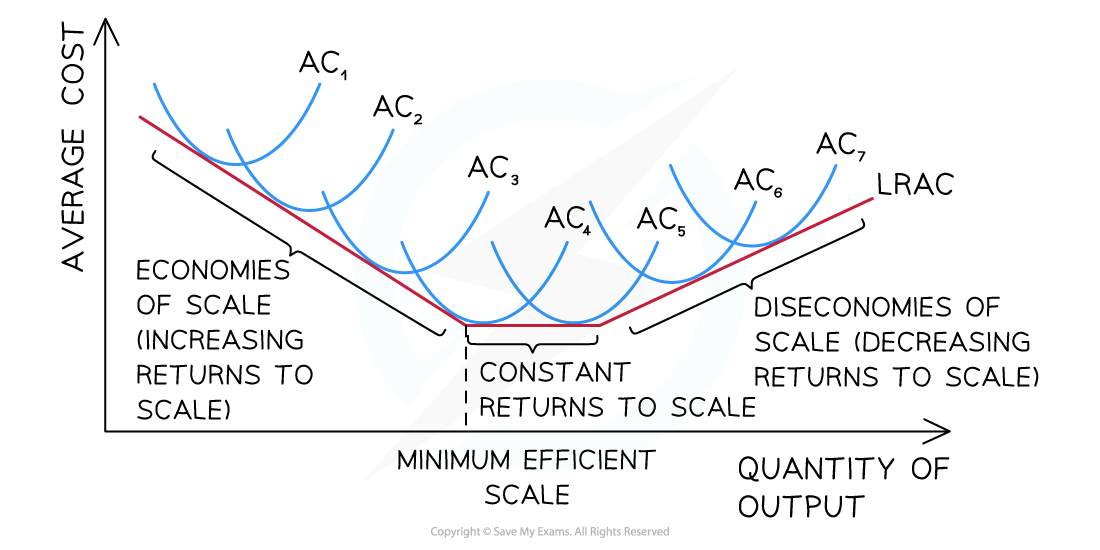
As a firm grows, economies of scale help it reach its minimum efficient scale, before diseconomies raise the cost/unit again
-
The LRAC curve is derived from a series of short-run average cost (SRAC) curves
- Each SRAC curve represents a different scale of operation
- As output increases, the firm can move to a larger plant size
- The LRAC curve therefore shows the lowest possible cost of production at each level of output
-
The LRAC curve touches each SRAC curve at the point where production is most efficient for that plant size
Minimum efficient scale (MES)
-
The minimum efficient scale (MES) is the lowest level of output at which the firm achieves the minimum point on the LRAC curve At this level:
- The firm has fully exploited most economies of scale
- Producing additional output will not significantly reduce average costs further
-
MES varies between industries.
- In industries with low fixed costs, MES occurs at relatively low output levels
- In industries with high fixed costs, MES occurs at very large output levels
-
For example:
- A small café may reach its MES with one location
- A car manufacturer must produce very large quantities of vehicles to achieve minimum costs
Exam Hint When explaining the shape of the long-run average cost curve, structure answers using three stages:
- At low levels of output, firms experience economies of scale, so long-run average costs fall
- As the firm continues to expand, it reaches the minimum efficient scale, where LRAC is at its lowest point
- At very high levels of output, diseconomies of scale occur, causing LRAC to rise
This explains why the LRAC curve is typically U-shaped.
You may also want to add one short exam-ready sentence, which examiners often reward:
The LRAC curve is U-shaped because economies of scale initially reduce average costs, but diseconomies of scale eventually cause costs to rise as firms become very large.
Economies of scale
- Economies of scale occur when average costs fall as output increases
- This happens because larger firms can operate more efficiently.
Examples of internal economies of scale
| Type | Explanation |
|---|---|
| Financial economy of scale | - Large firms can borrow at lower interest rates |
| Managerial economy of scale | - Specialised managers improve efficiency |
| Marketing economy of scale | - Advertising costs are spread over more output |
| Purchasing economy of scale | - Firms buying inputs in bulk receive discounts |
| Technical economy of scale | - Larger firms can use more advanced machinery |
| Risk-bearing economy of scale | - Larger firms can spread risk across more products |
- These efficiencies allow firms to reduce long-run average costs as production expands
External economies of scale
-
External economies of scale occur when firms benefit from cost reductions due to the growth of the industry as a whole, rather than from their own expansion
-
These cost reductions occur outside the firm but within the industry
-
As the industry grows, firms may benefit from:
- Improved infrastructure
- A larger pool of skilled labour
- The development of specialist suppliers
- Better transport and logistics networks
-
These factors can reduce production costs for all firms in the industry
Examples of external economies of scale
| Source | Explanation |
|---|---|
| Geographic clustering | - Firms locate near each other and share suppliers and infrastructure |
| Skilled labour pool | - Large industries attract workers with specialised skills |
| Specialist suppliers | - Firms supplying inputs develop as the industry expands |
| Infrastructure improvements | - Governments invest in roads, ports or digital infrastructure |
- For example, the growth of the technology industry in Silicon Valley created a large pool of engineers, venture capital and specialised suppliers, reducing costs for firms operating there
Diseconomies of scale
- Diseconomies of scale occur when average costs increase as firms become very large
- This happens because managing a very large organisation becomes more complex
Causes of diseconomies of scale
| Cause | Explanation |
|---|---|
| Management diseconomies | - More management layers create slower decision-making |
| Communication diseconomies | - Information flows less efficiently in large organisations |
| Geographical diseconomies | - Operating across multiple locations increases coordination costs |
| Cultural diseconomies | - Different work practices across locations can reduce efficiency |
- These problems can cause long-run average costs to rise as output expands further
Avoiding confusion: three different concepts
Economies of scale
- Occur in the long run
- Average costs fall as output increases
- Caused by factors such as specialisation, bulk purchasing and better technology
- Help explain the downward-sloping section of the LRAC curve
Diseconomies of scale
- Also occur in the long run
- Average costs rise as firms become very large
- Caused by management, communication and coordination problems
- Explain the upward-sloping section of the LRAC curve
Law of diminishing returns
- Occurs in the short run
- Happens when additional units of a variable factor are added to a fixed factor
- The marginal product of the variable factor eventually falls
Exam Hint Diminishing returns explain the shape of short-run cost curves
Economies and diseconomies of scale explain the shape of the LRAC curve
Was this revision note helpful?