Absorption Spectra & Action Spectra (Cambridge International A-Level Biology)
Exam board Cambridge International · A-LevelUpdated 2026-06-30
Spec point —
13.1.5· interpret absorption spectra of chloroplast pigments and action spectra for photosynthesis
Absorption spectra & action spectra
Absorption spectra
-
An absorption spectrum is a graph that shows the absorbance of different wavelengths of light by a particular pigment
- Chlorophylls absorb wavelengths in the blue-violet and red regions of the light spectrum
- Carotenoids absorb wavelengths of light mainly in the blue-violet region of the spectrum
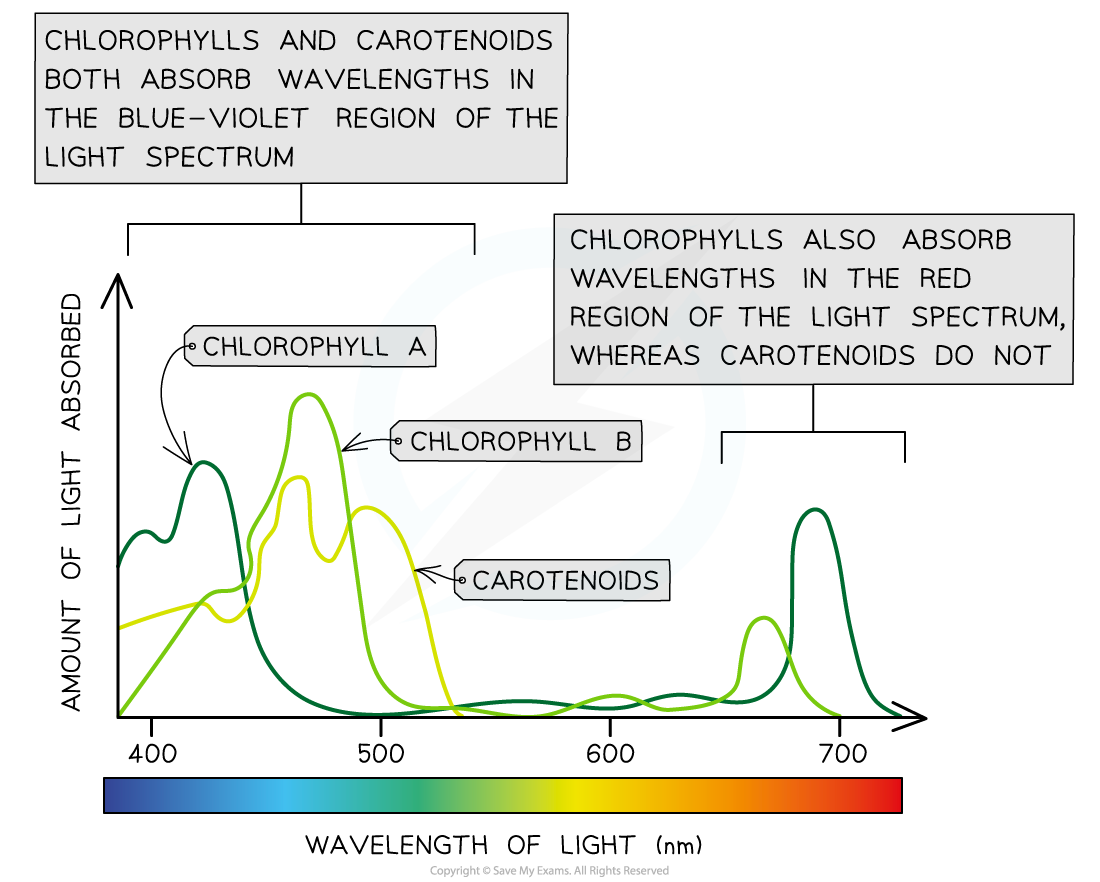
Absorption spectra of chlorophyll A, chlorophyll B and carotenoid pigments
Action spectra
-
An action spectrum is a graph that shows the rate of photosynthesis at different wavelengths of light
- The rate of photosynthesis is highest at the blue-violet and red regions of the light spectrum
- This is because these are the wavelengths of light that plants can absorb (i.e. the wavelengths of light that chlorophylls and carotenoids can absorb)
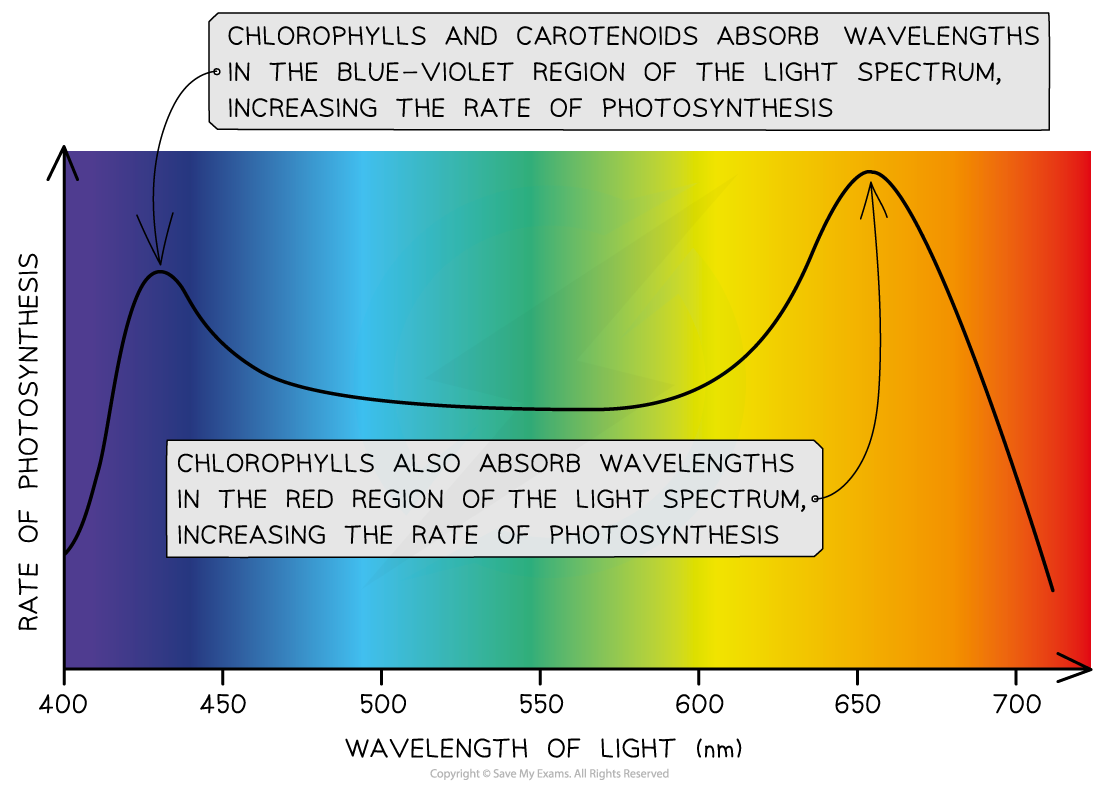
Photosynthetic action spectrum
-
There is a strong correlation between the cumulative absorption spectra of all pigments and the action spectrum:
- Both graphs have two main peaks (at the blue-violet region and the red region of the light spectrum)
- Both graphs have a trough (in the green-yellow region of the light spectrum)
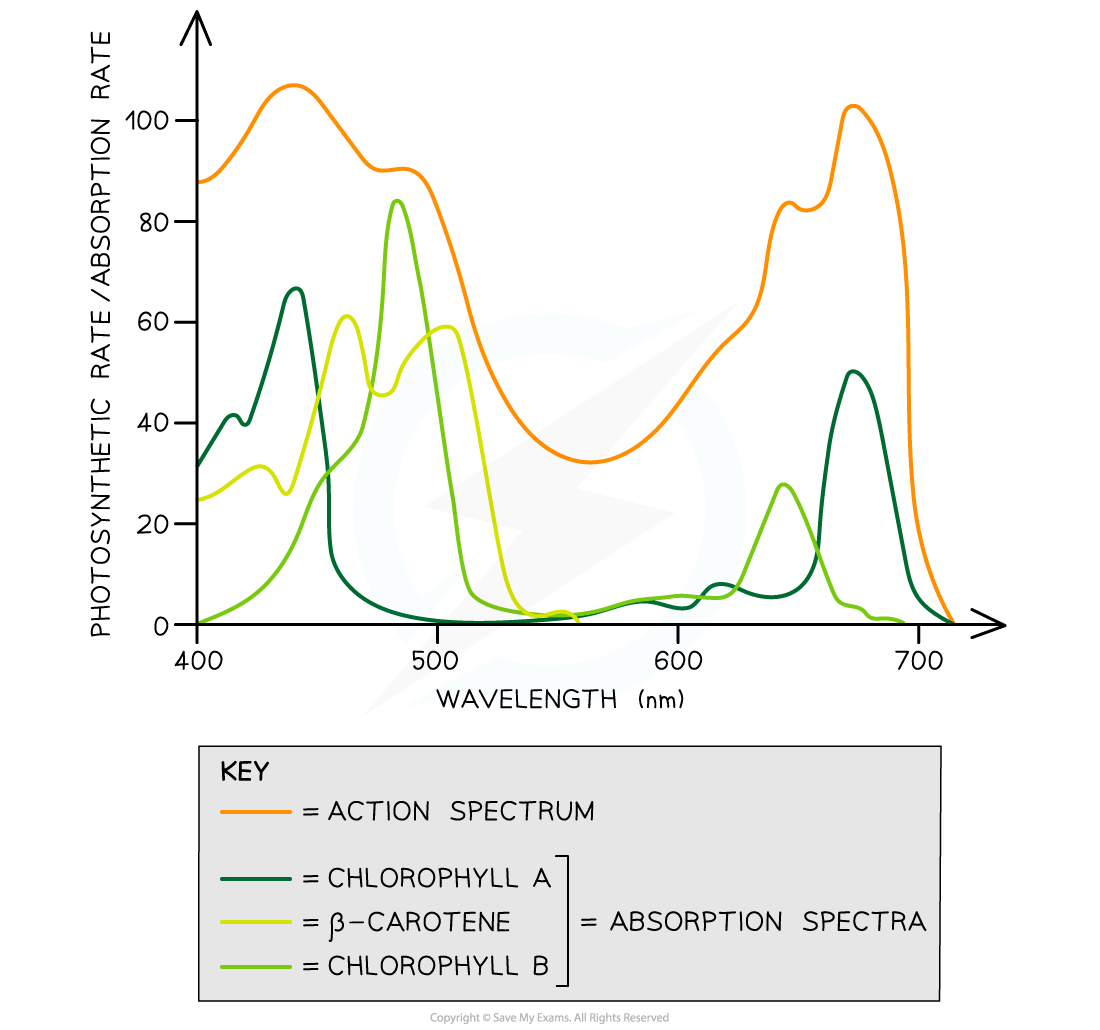
An overlay of the photosynthetic absorption and action spectra shows there is a strong cumulative correlation
Was this revision note helpful?
Build on this topic