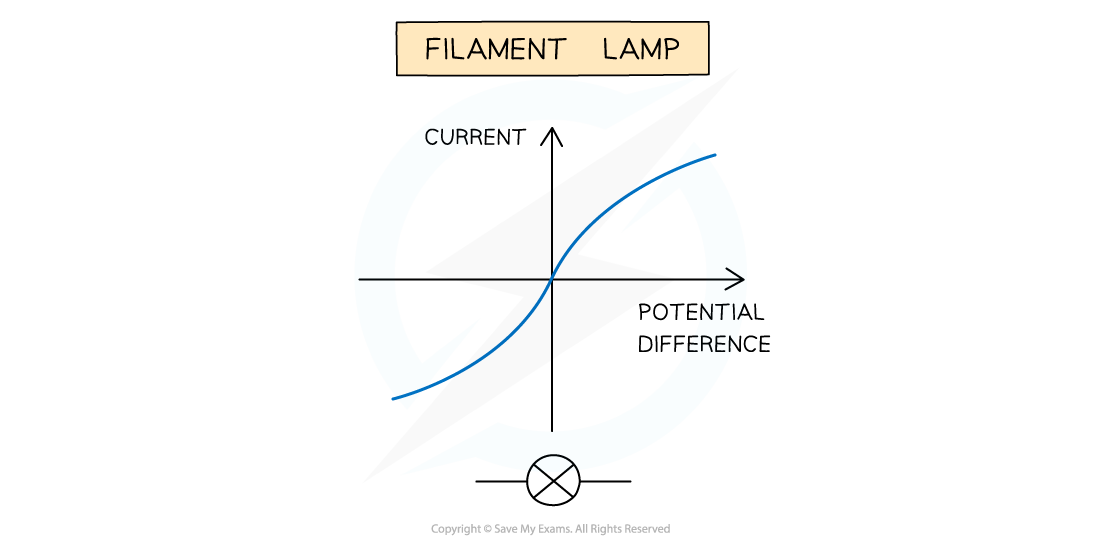
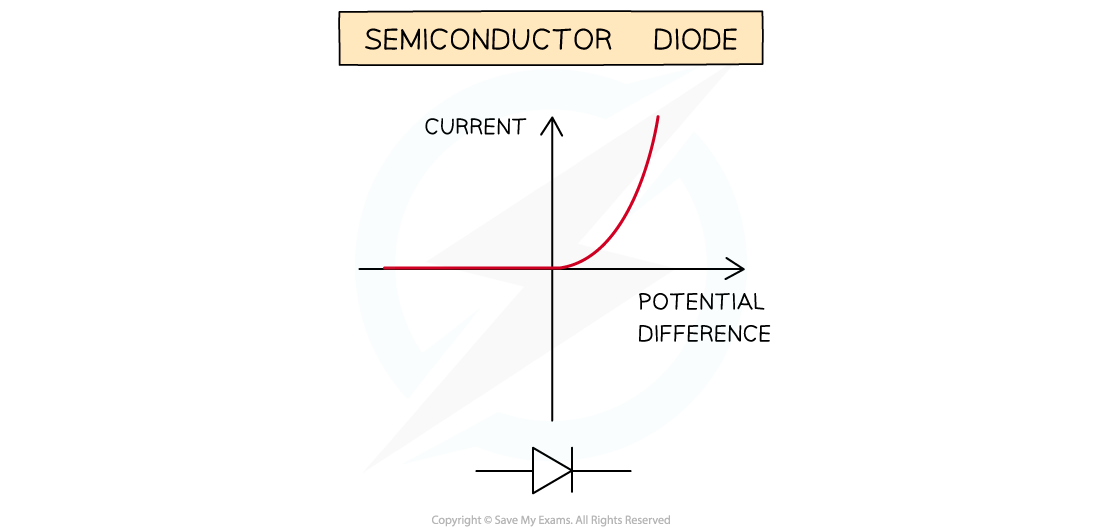
IV Graphs
3 guided lessons · 27 checks · 2. Electricity → Components in Series & Parallel Circuits
Guided lessons for this note
Which concept don't you understand yet?
We'll explain it simply and check your understanding. Pick any lesson — any order works.
0 of 27 checks correct so far
Lesson 1 of 3
IV graphs
Plot the current through a component against the voltage across it and the shape of the line tells you everything. Straight through the origin: the resistance never budges. Curved away: something inside is changing. This lesson learns to read both shapes and names the components that produce them.
What you know already
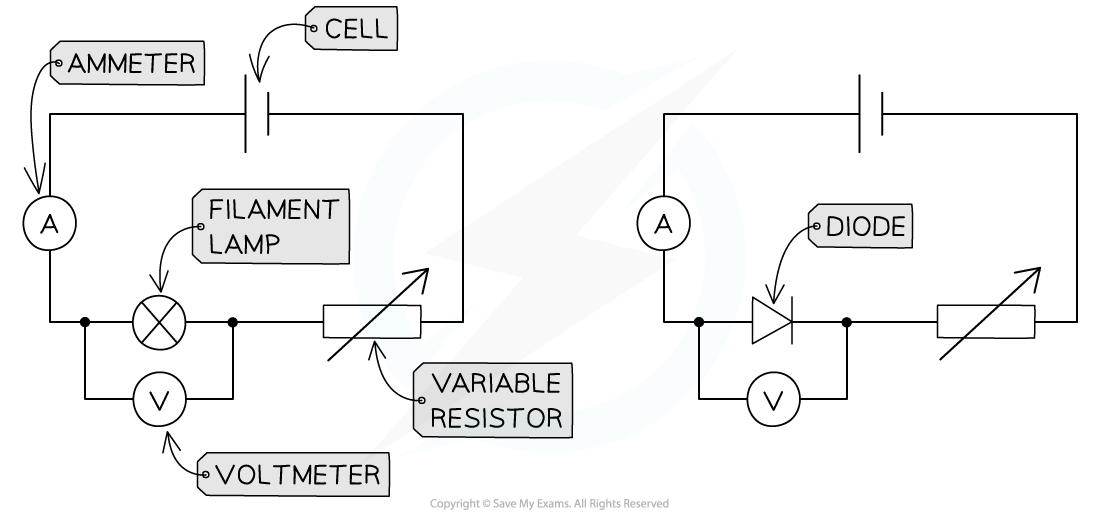
How a component responds to voltage is easiest to see as a graph. A straight line through the origin means steady, predictable behaviour; a curve means the component is changing underneath you. This note reads the IV graphs of wires, filament lamps and diodes, then shows the bench setup that measures them and the resistance dial that controls them.
Key points of understanding
- An IV graph plots the current through a component against the voltage across it.
- A straight line through the origin means the relationship is linear and the resistance stays constant.
- A curved graph means the resistance changes as the current varies.
- Wires and fixed resistors at steady temperature give linear, directly proportional graphs.
- Filament lamps, diodes, LDRs and thermistors all produce non-linear graphs.
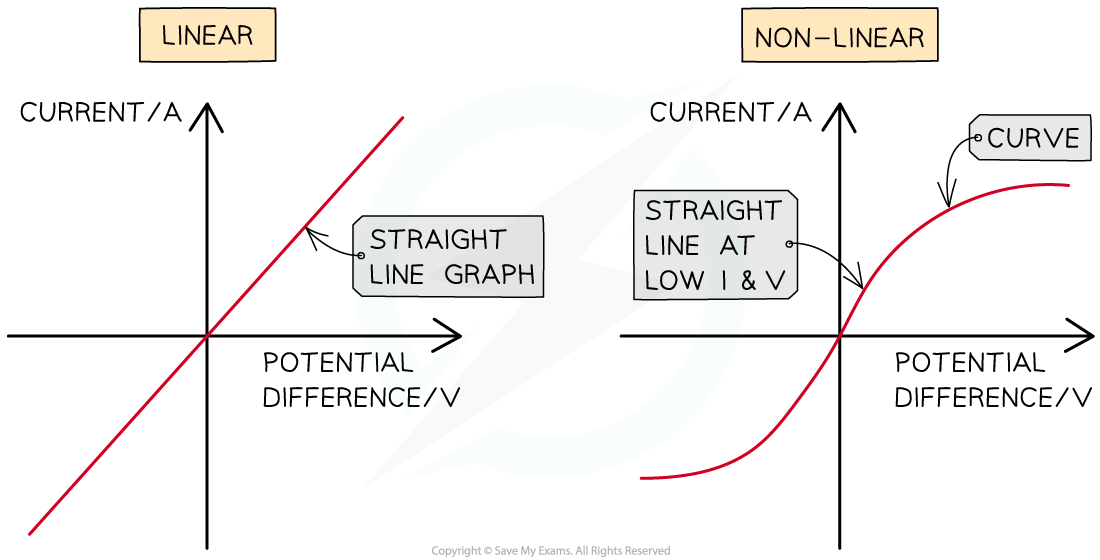
Linear IV graphs are straight lines through the origin, indicating a constant resistance. Non-linear IV graphs are curved, indicating a variable resistance
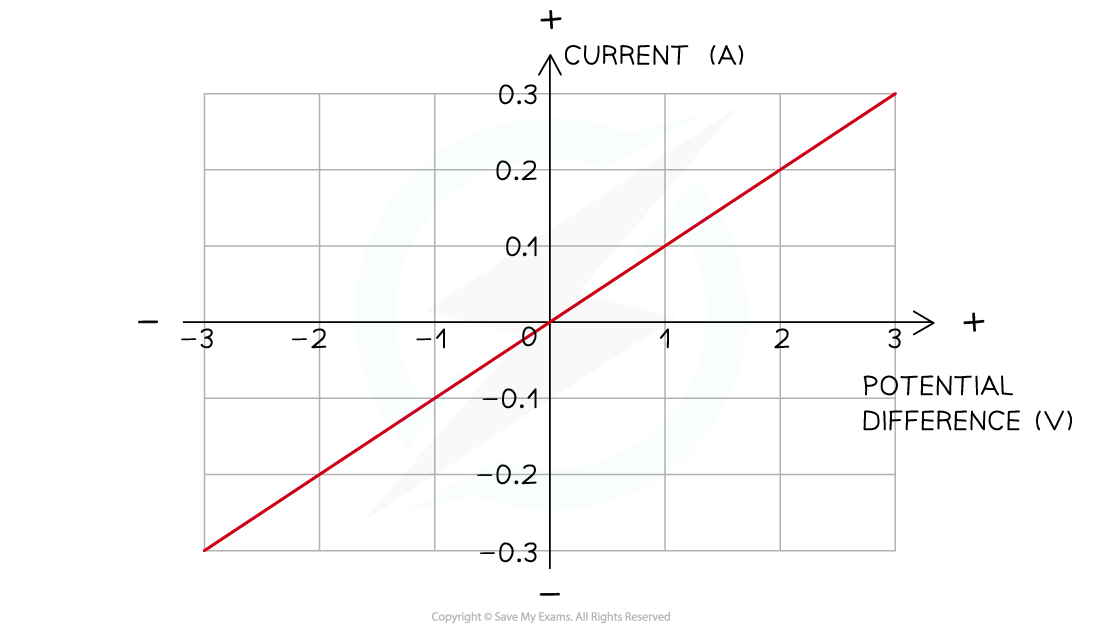
The current is directly proportional to the potential difference (voltage) as the graph is a straight line through the origin
Choose a confidence level to continue.
Prefer to read it all at once? Show the full lesson as a page
1.IV graphs
Plot the current through a component against the voltage across it and the shape of the line tells you everything. Straight through the origin: the resistance never budges. Curved away: something inside is changing. This lesson learns to read both shapes and names the components that produce them.
Linear IV graphs are straight lines through the origin, indicating a constant resistance. Non-linear IV graphs are curved, indicating a variable resistance
The current is directly proportional to the potential difference (voltage) as the graph is a straight line through the origin
Key points
Guided content from the SME authoring corpus — note rn_WzQZfyNNFFFFghbF, pinned at 275f3b535d78 · promoted SyllabAI/syllabai-resources b3caaaa90c5e