Describing Wave Motion
3 guided lessons · 27 checks · 3. Waves → Waves & The Electromagnetic Spectrum
Guided lessons for this note
Which concept don't you understand yet?
We'll explain it simply and check your understanding. Pick any lesson — any order works.
0 of 27 checks correct so far
Lesson 1 of 3
Wavefronts
Seen from above, a moving wave can be drawn as a set of parallel lines, each standing for one wave: the wavefronts. Their spacing does real work in diagrams, because crowded lines mean a short wavelength and widely spaced lines mean a long one. The arrow showing travel direction is called a ray.
What you know already
Waves only make sense once you can measure them. This lesson fixes the five measuring words of wave motion in place: the wavefront you draw from above, the amplitude of a swing, the wavelength between matching points, the frequency of passes per second and the period of a single pass. Every later wave calculation leans on these.
Key points of understanding
- Each wavefront line represents a single wave drawn as if viewed from above.
- The arrow showing the direction a wave moves is called a ray.
- The gap between neighbouring wavefronts represents the wavelength.
- Close-spaced wavefronts show a short wavelength; far-spaced ones show a long wavelength.
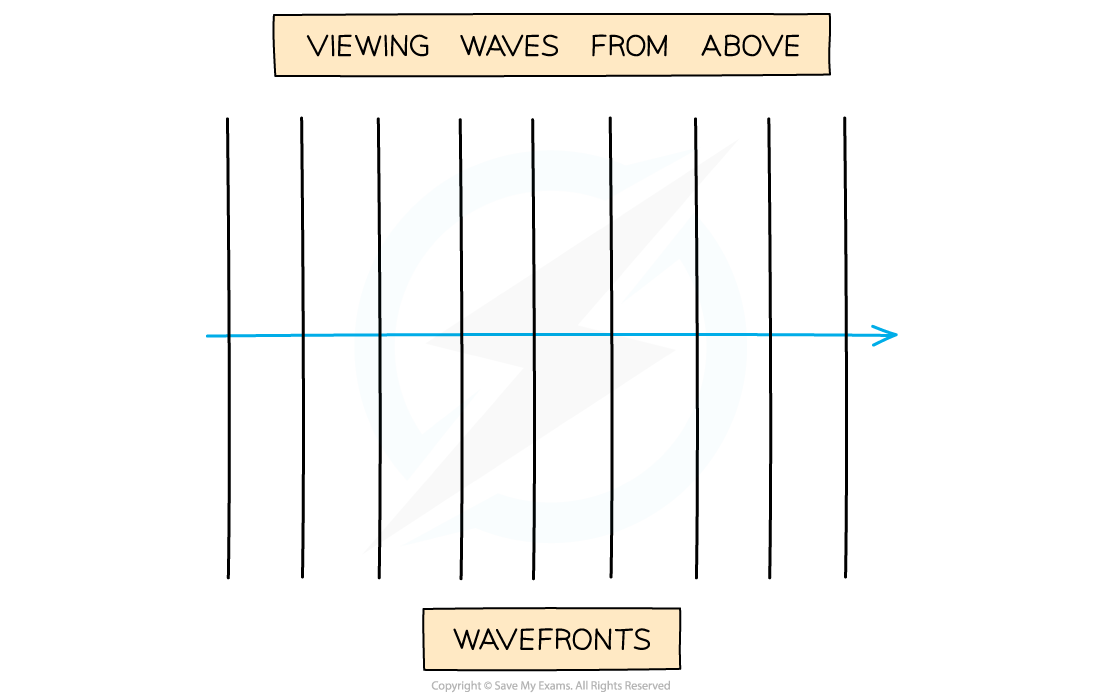
Diagram showing a wave moving to the right, drawn as a series of wavefronts
Choose a confidence level to continue.
Prefer to read it all at once? Show the full lesson as a page
1.Wavefronts
Seen from above, a moving wave can be drawn as a set of parallel lines, each standing for one wave: the wavefronts. Their spacing does real work in diagrams, because crowded lines mean a short wavelength and widely spaced lines mean a long one. The arrow showing travel direction is called a ray.
Diagram showing a wave moving to the right, drawn as a series of wavefronts
Key points
- Each wavefront line represents a single wave drawn as if viewed from above.
- The arrow showing the direction a wave moves is called a ray.
- The gap between neighbouring wavefronts represents the wavelength.
- Close-spaced wavefronts show a short wavelength; far-spaced ones show a long wavelength.
First pass
Wavefronts are the top-down picture of a wave: one line per wave, with the spacing between the lines standing in for the wavelength.
Analogy — Aerial photo of ocean swells: each bright crest line is a wavefront, and bunched lines mean choppy short waves.
Exam pointer — Diagram questions often want the ray arrow as well as the wavefront lines, so always add the direction arrow.
Going deeper
The wavefront picture trades the up-down profile for a map view: what you lose in shape detail you gain in being able to show refraction and direction changes cleanly.
Analogy — A contour map replaces a mountain photograph with lines whose spacing tells you the steepness at a glance.
Exam pointer — When wavefronts bend at a boundary, the spacing change tells you the speed change; quote that link in refraction questions.
Checks
0 of 9 attempted · 0 correct
2.Amplitude & wavelength
Two lengths describe the shape of a wave on paper. Amplitude measures the size of the swing: the rise from the undisturbed level to a peak, or the drop to a trough. Wavelength measures the repeat distance: from any chosen point on the wave to the matching point on the next wave.
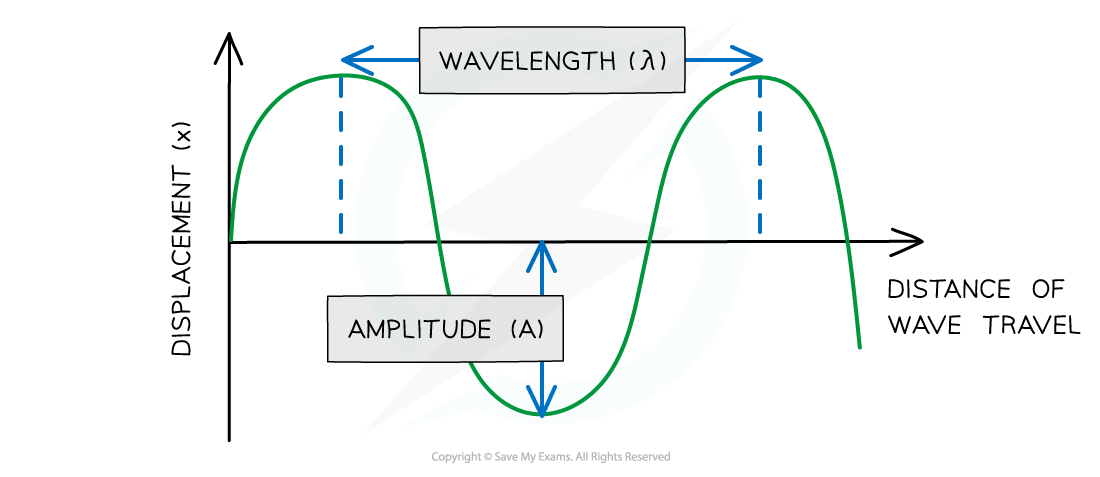
Diagram showing the amplitude and wavelength of a wave
Key points
- Amplitude is the distance from the undisturbed position to a peak or a trough.
- Amplitude carries the symbol A and is measured in metres.
- Wavelength is the distance from one point on a wave to the same point on the next wave.
- Wavelength carries the symbol lambda and is measured in metres.
- On a displacement-distance graph, wavelength is read between matching points along the horizontal axis.
First pass
Amplitude says how far the wave swings from its resting level, and wavelength says how far along the wave you must go before the shape repeats.
Analogy — A fairground swing: amplitude is how high it flies, wavelength is how many metres between one swing and the next rider at the same height.
Exam pointer — Read amplitude from the rest line, never from trough to peak; the rest line is the reference examiners mark against.
Going deeper
Amplitude tracks the energy carried by the oscillation while wavelength tracks the spatial repeat unit; the two are independent measurements you read from different directions on a graph.
Analogy — On a mountain trail profile, amplitude is the height of each hump above the valley floor and wavelength is the distance from one summit to the next.
Exam pointer — Wavelength can be measured between any corresponding points, not only peak-to-peak; state that when a diagram lacks clear peaks.
Checks
0 of 9 attempted · 0 correct
3.Frequency & time period
The last pair of measuring words is about time. Frequency counts how many waves pass a point each second and is measured in hertz. The time period is the partner measurement: how long one single wave takes to pass the same point. On a displacement-time graph the period is read along the time axis.
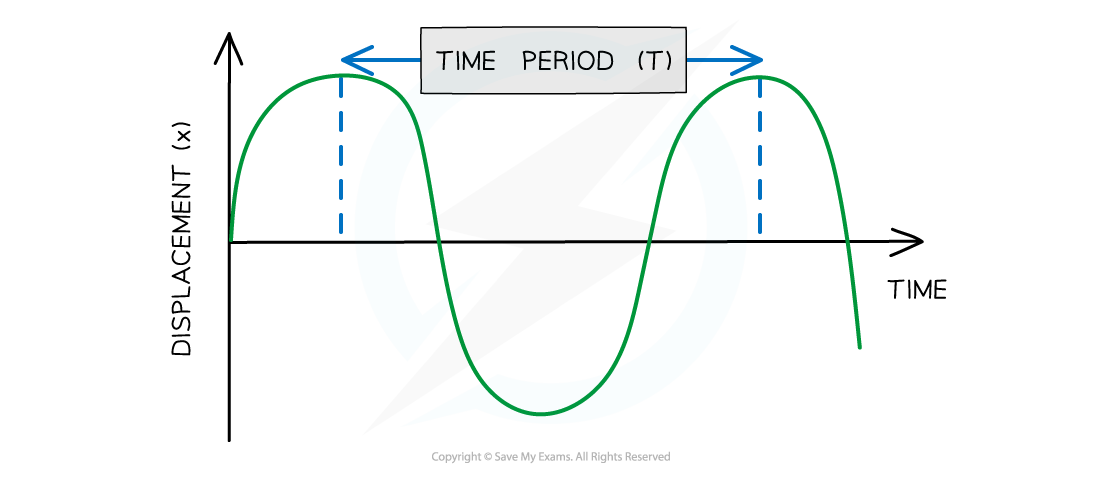
Diagram showing the time period of a wave
Key points
- Frequency is the number of waves passing a point each second.
- Frequency carries the symbol f and is measured in hertz.
- One hertz means one wave per second, so 5 Hz means five waves per second.
- The time period is the time taken for a single wave to pass a point.
- Period carries the symbol T and is measured in seconds.
First pass
Frequency counts waves arriving per second, and the time period measures how long one wave takes to arrive; they describe the same rhythm from opposite ends.
Analogy — Buses passing a stop: frequency is buses per minute, the period is the minutes between one bus and the next.
Exam pointer — Units earn marks: frequency in hertz, period in seconds. Mixing them up is a common lost mark.
Going deeper
On a displacement-time graph the horizontal axis is time, so the period is the horizontal repeat distance, while amplitude and wavelength stay vertical and spatial reads from other graphs.
Analogy — Heartbeat traces on a monitor: the spacing between beats on the time axis is the period, and the beats-per-minute rate is the frequency.
Exam pointer — Check the horizontal axis label before reading a graph: distance gives wavelength, time gives period.
Checks
0 of 9 attempted · 0 correct
Guided content from the SME authoring corpus — note rn_TPSJT83Gh8nMCcVV, pinned at dad406f1ecd8 · promoted SyllabAI/syllabai-resources b3caaaa90c5e