Velocity-Time Graphs
2 guided lessons · 18 checks · 1. Forces & Motion → Movement & Position
Guided lessons for this note
Which concept don't you understand yet?
We'll explain it simply and check your understanding. Pick any lesson — any order works.
0 of 18 checks correct so far
Lesson 1 of 2
Reading slopes and flats on a velocity-time graph
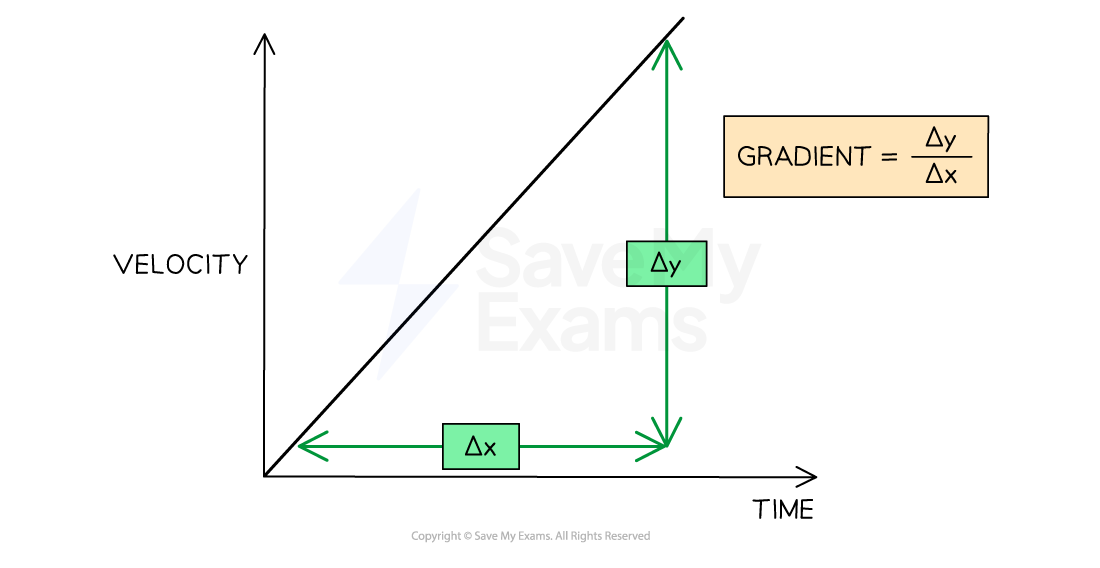
On this graph the story is told entirely by the line's direction and steepness: rising means gaining speed, falling means losing it, and a flat stretch means cruising unchanged. This lesson builds the full reading vocabulary before any numbers are taken from the plot.
What you know already
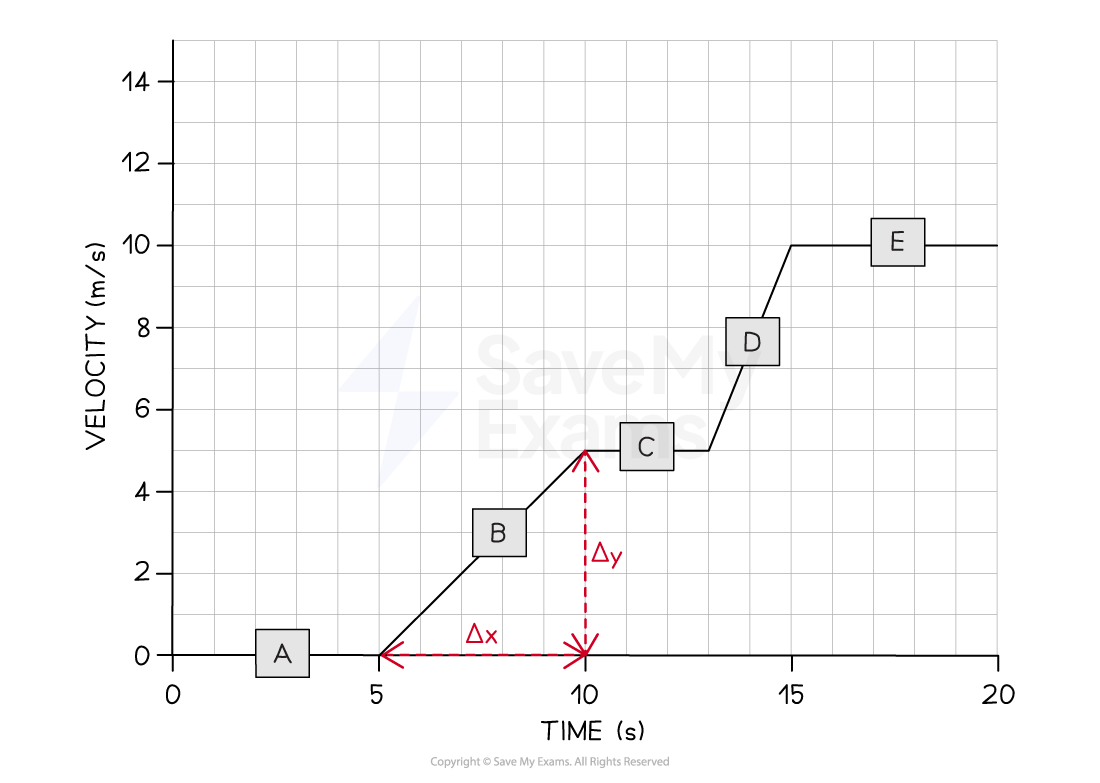
The distance-time graph answered 'how far by when'; the velocity-time graph answers the sharper question of how the pace itself evolved. This lesson teaches the graph's vocabulary of slopes and flats, then extracts a number from the picture by measuring its gradient.
Key points of understanding
- A velocity-time graph plots the object's velocity against time, so the vertical axis carries m/s and the horizontal axis carries seconds.
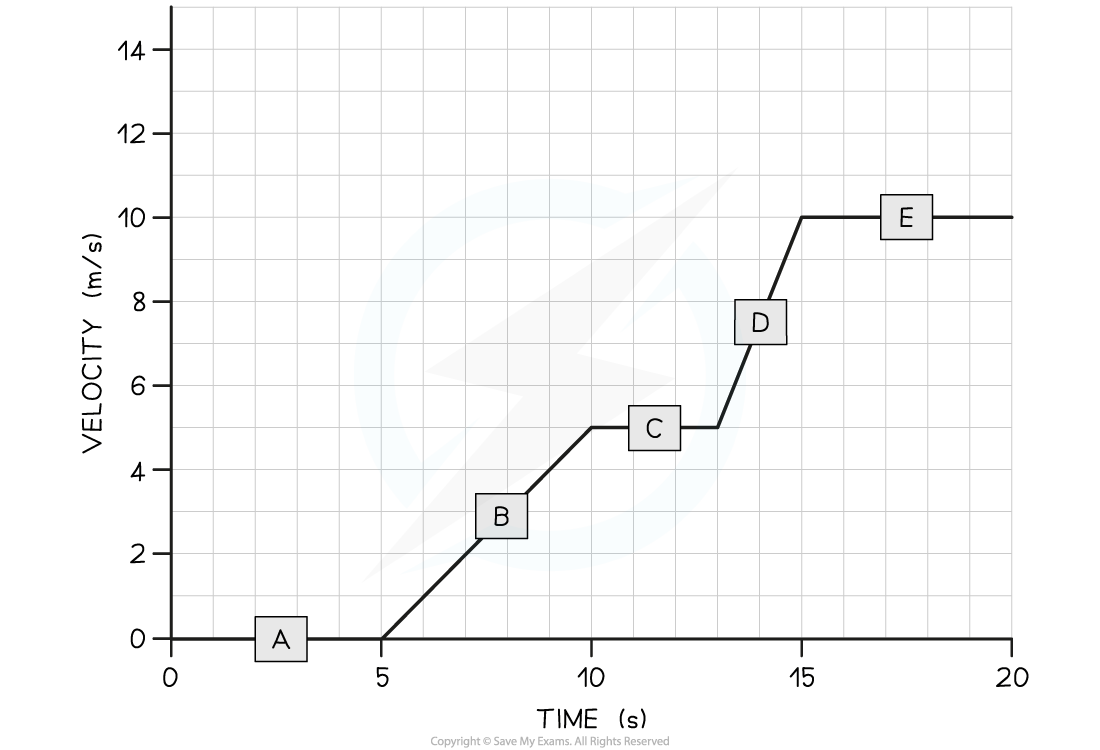
- A straight sloping line means the acceleration is constant for that whole stretch.
- The steepness of the slope carries the size of the acceleration: steep means fast-changing, gentle means gradual.
- A positive gradient shows the velocity increasing; a negative gradient shows it decreasing.
- A flat horizontal line means zero acceleration, which is motion at a steady velocity.
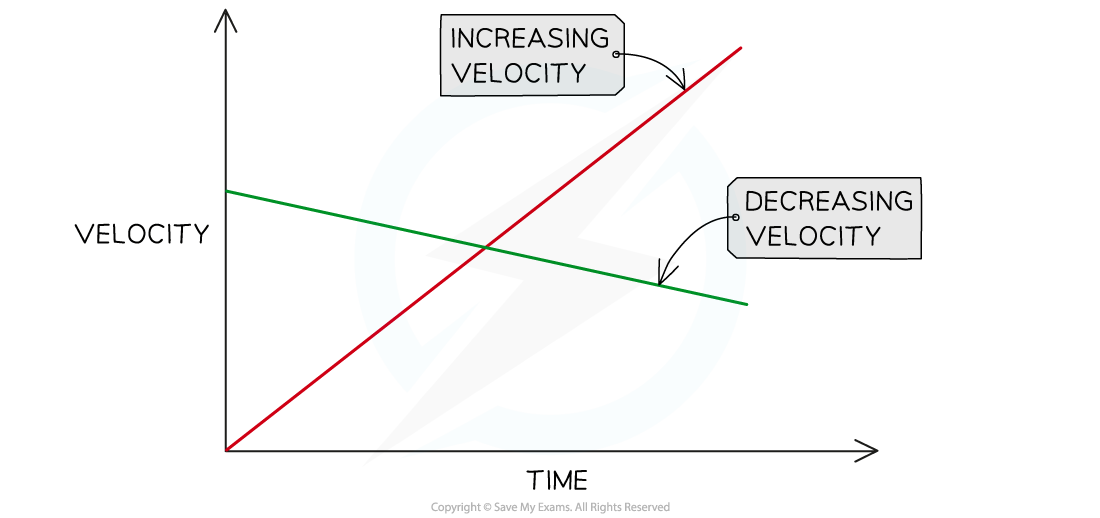
Increasing and decreasing velocity represented on a velocity-time graph
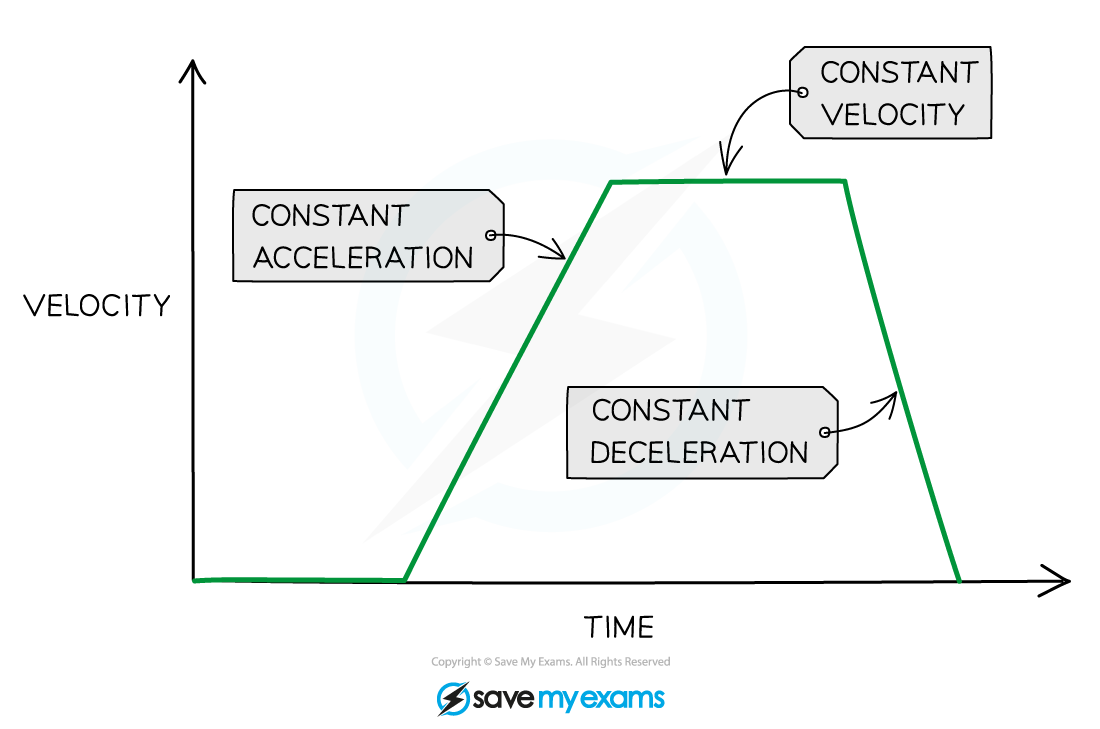
Flat horizontal lines on a velocity-time graph show periods of constant velocity, and sloping straight line show periods of acceleration
Choose a confidence level to continue.
Prefer to read it all at once? Show the full lesson as a page
1.Reading slopes and flats on a velocity-time graph
On this graph the story is told entirely by the line's direction and steepness: rising means gaining speed, falling means losing it, and a flat stretch means cruising unchanged. This lesson builds the full reading vocabulary before any numbers are taken from the plot.
Increasing and decreasing velocity represented on a velocity-time graph
Flat horizontal lines on a velocity-time graph show periods of constant velocity, and sloping straight line show periods of acceleration
Key points
- A velocity-time graph plots the object's velocity against time, so the vertical axis carries m/s and the horizontal axis carries seconds.
Guided content from the SME authoring corpus — note rn_5hfYYFrc2XjMJCrq, pinned at aa6485187429 · promoted SyllabAI/syllabai-resources b3caaaa90c5e