16 markshard
2 marks
(a)
Given that and are integers such that
and
find all the possible values of .
4 marks
(b)
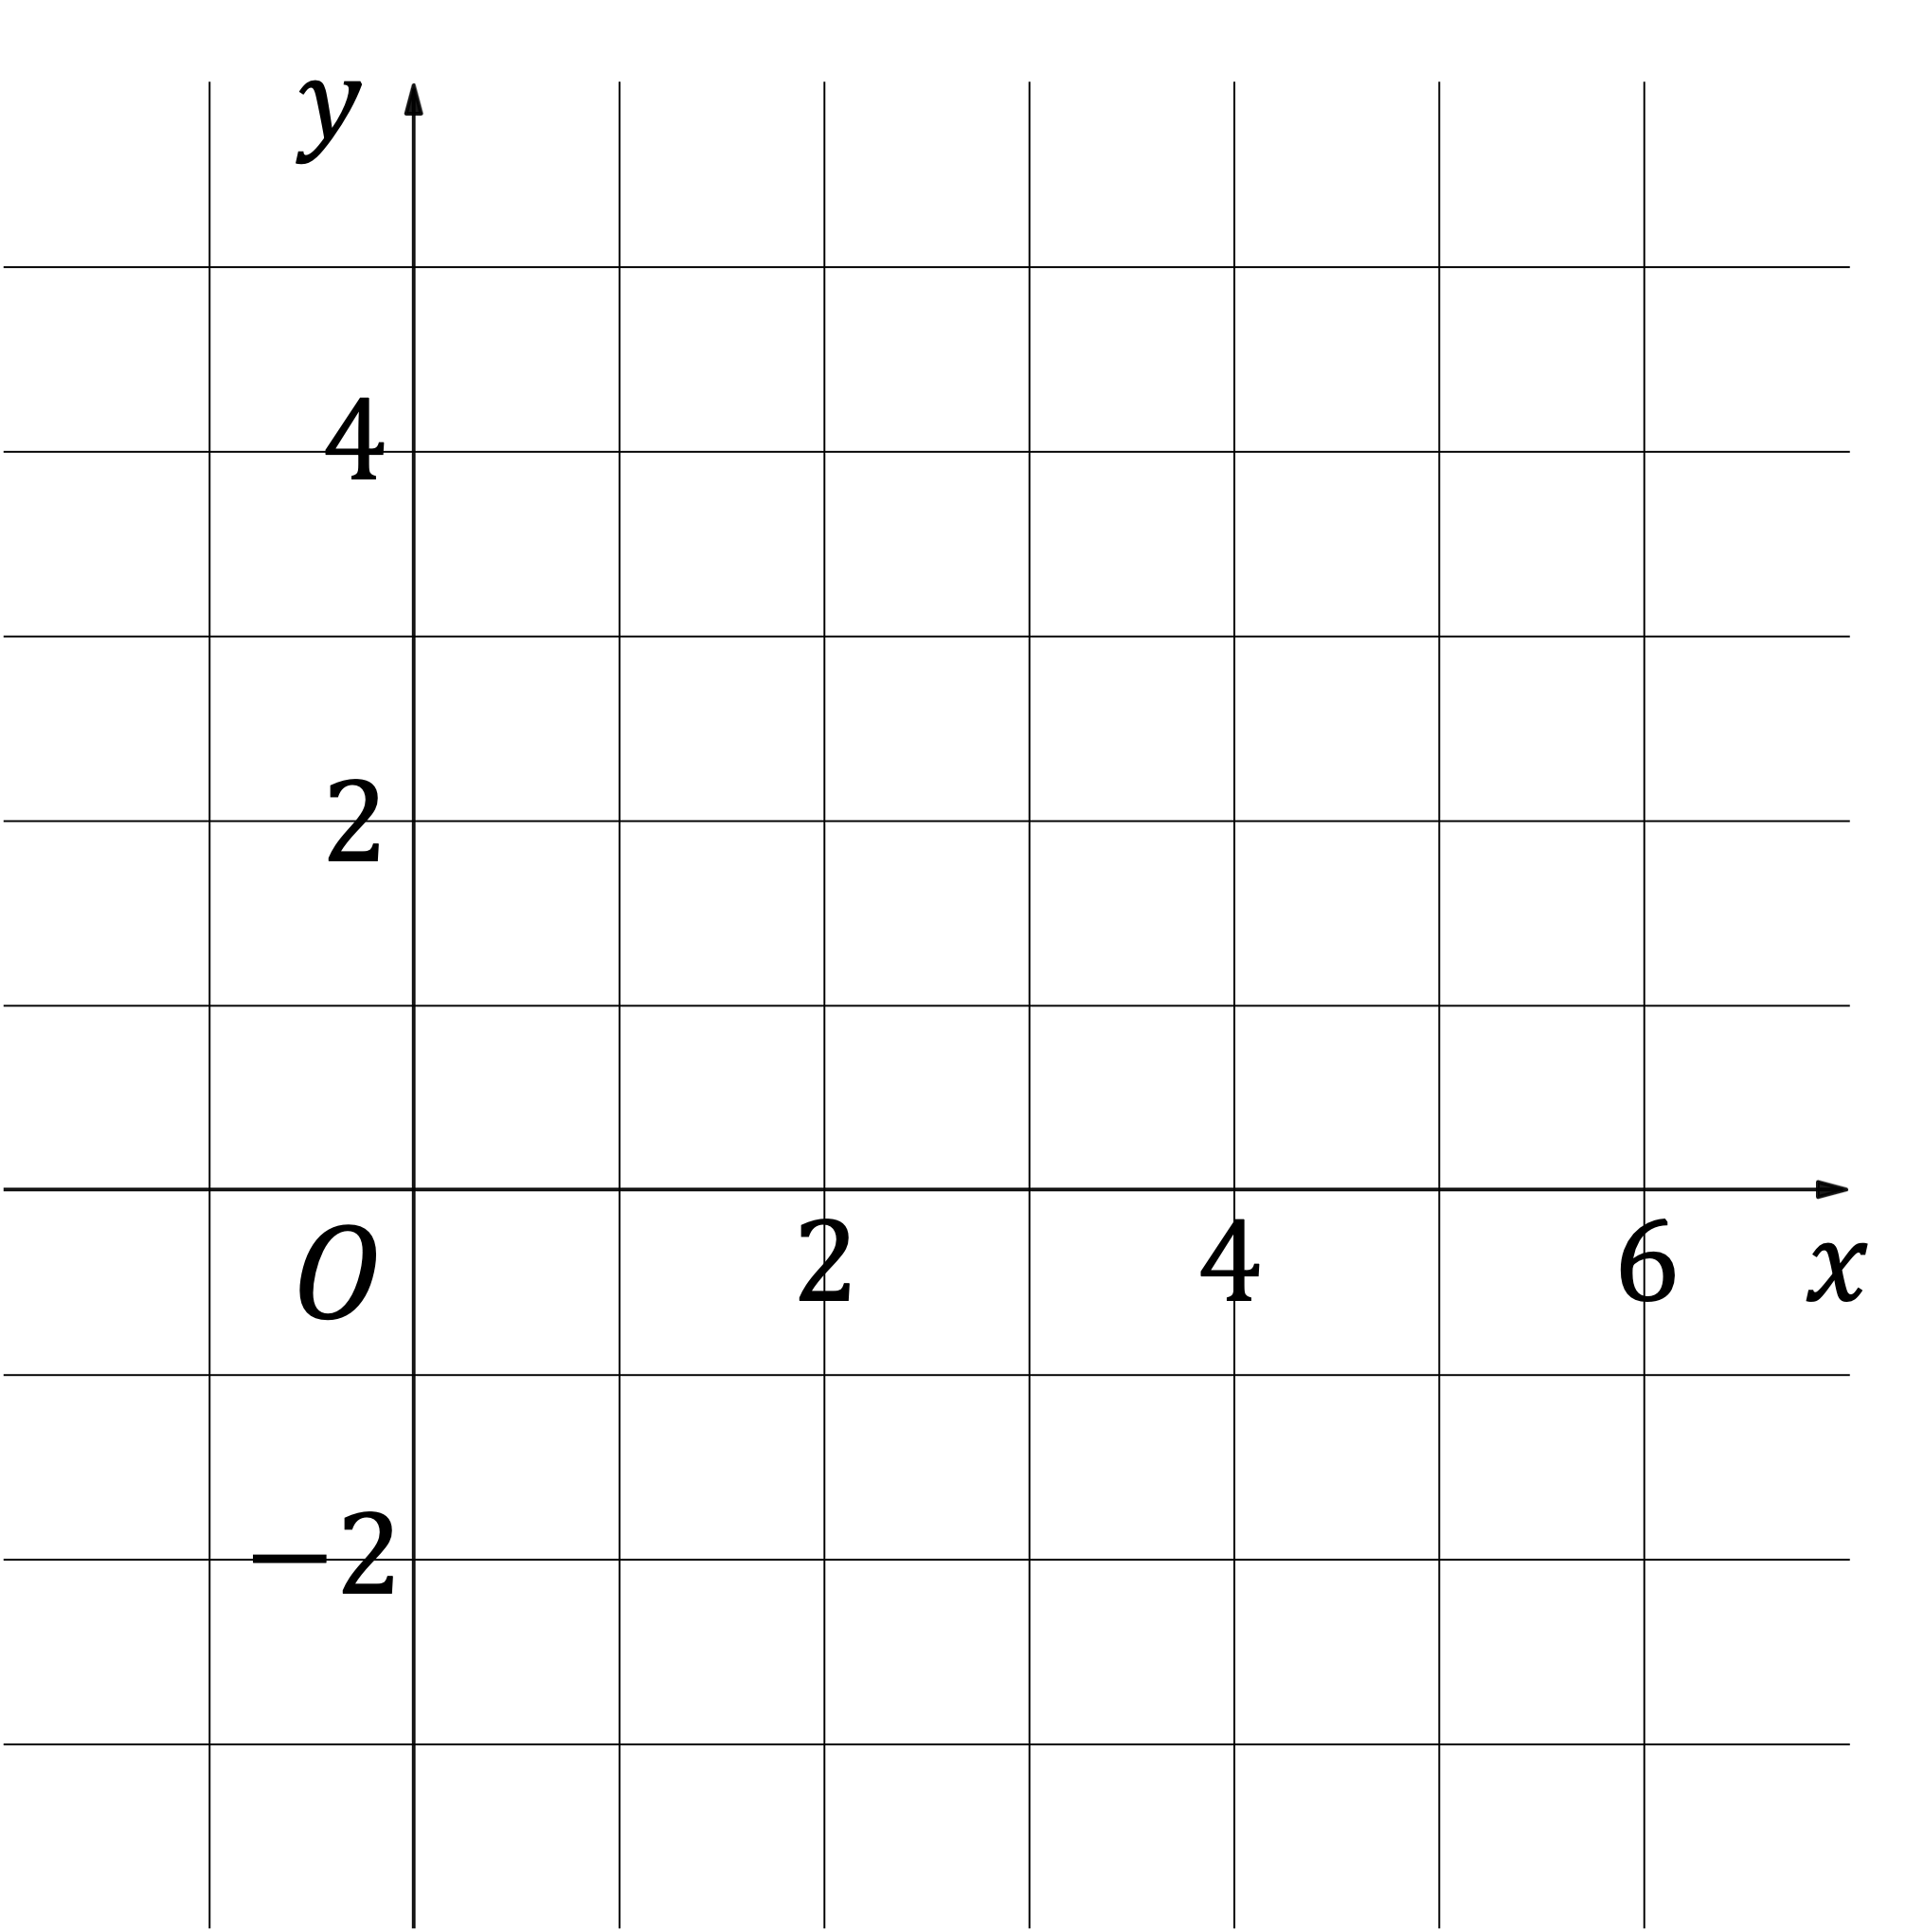
On the grid below show, by shading, the region defined by the inequalities
Mark this region with the letter .
32 questions · 121 marks · ≈ 2 hours
Given that and are integers such that
and
find all the possible values of .
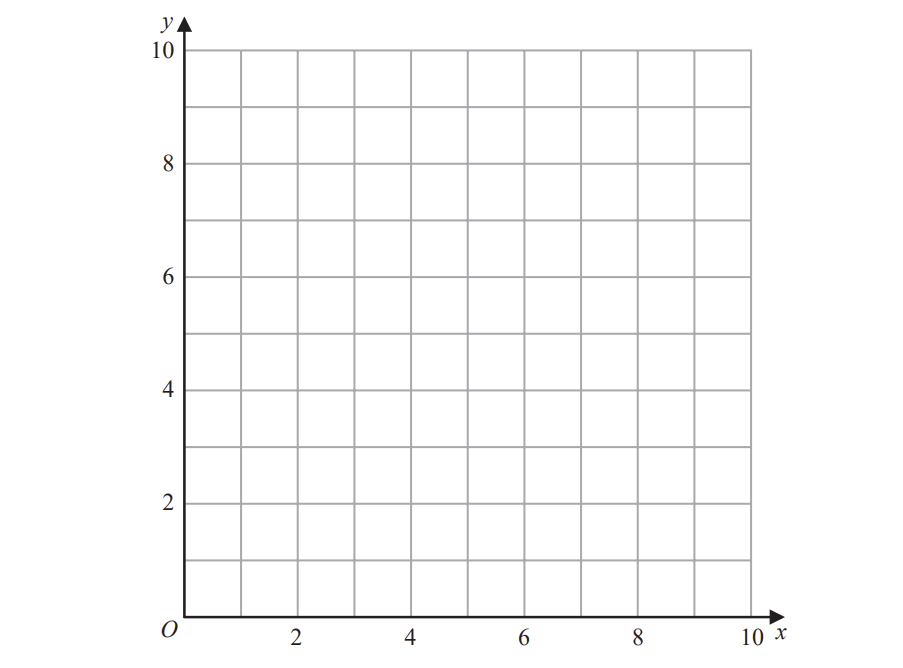
On the grid below show, by shading, the region defined by the inequalities
Mark this region with the letter .
The lines and are drawn on the grid.
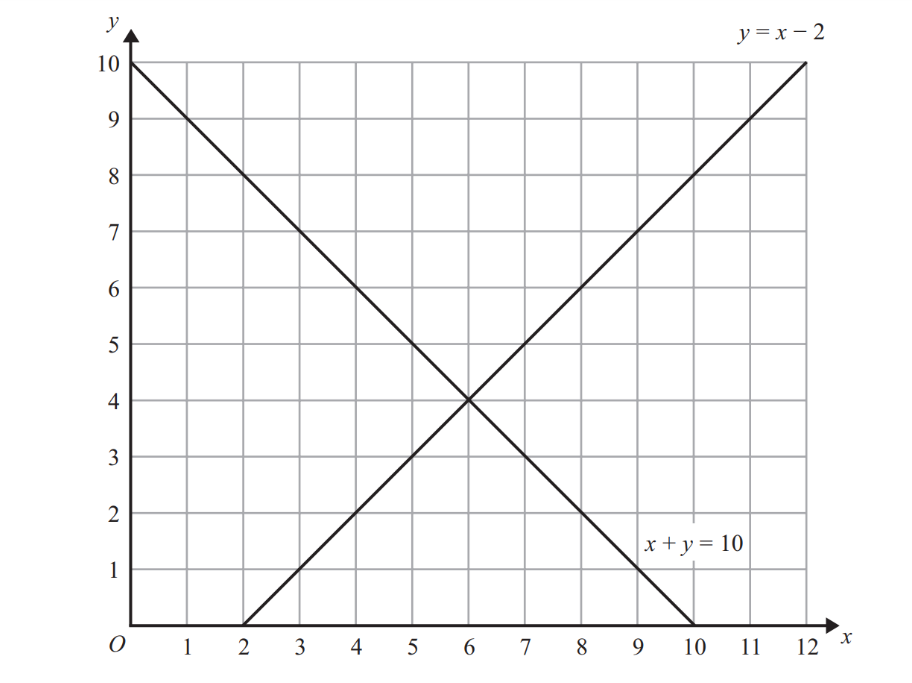
On the grid, mark with a cross (x) each of the points with integer coordinates that are in the region defined by
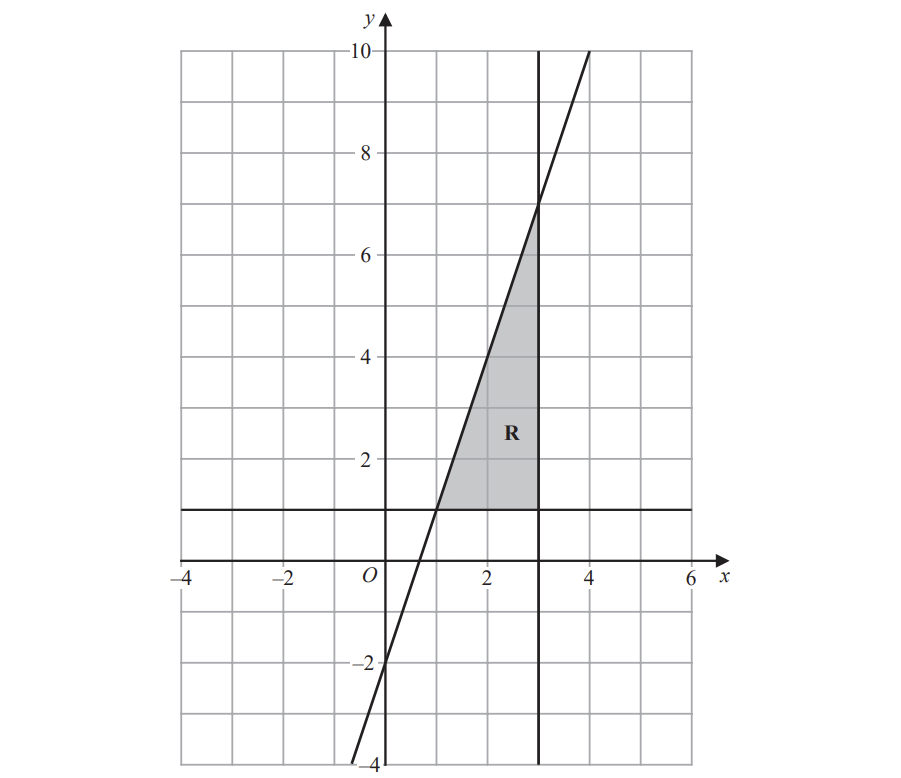
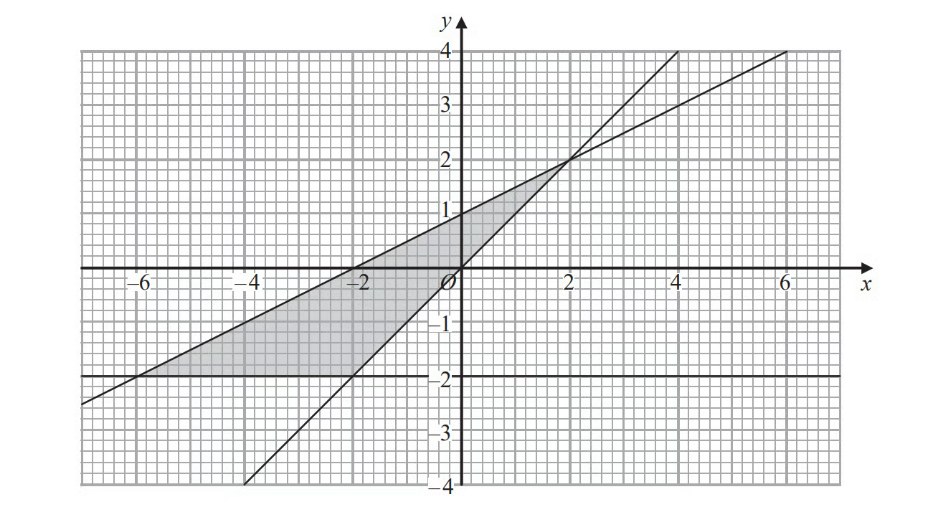
The shaded region , shown in the diagram below, is bounded by the straight line with equation and by two other straight lines.
Write down the three inequalities that define region .
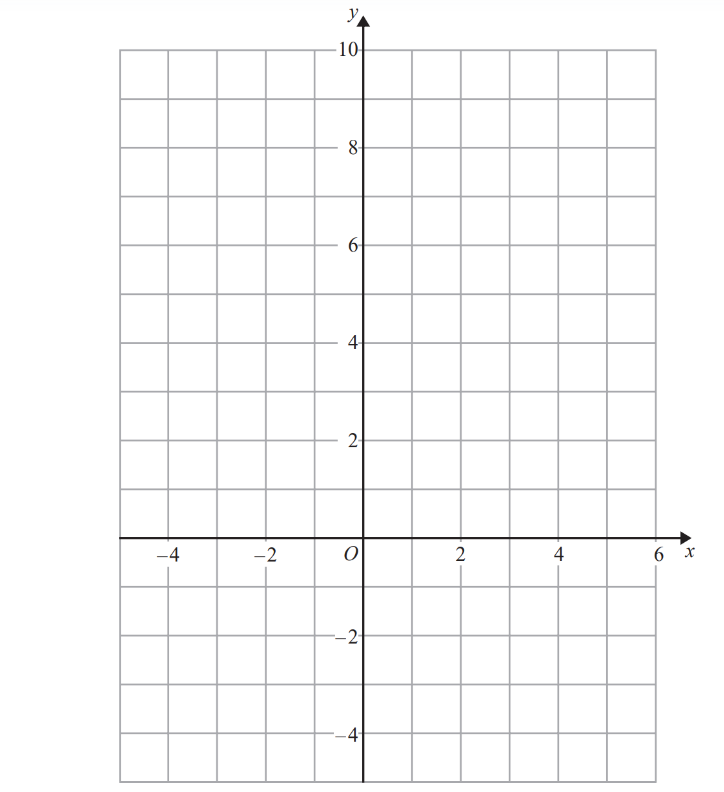
On the grid, shade the region that satisfies all these inequalities.
Label the region .
Write down the three inequalities that define the shaded region.
Show, by shading on the grid, the region that satisfies all three of the inequalities
Label the region
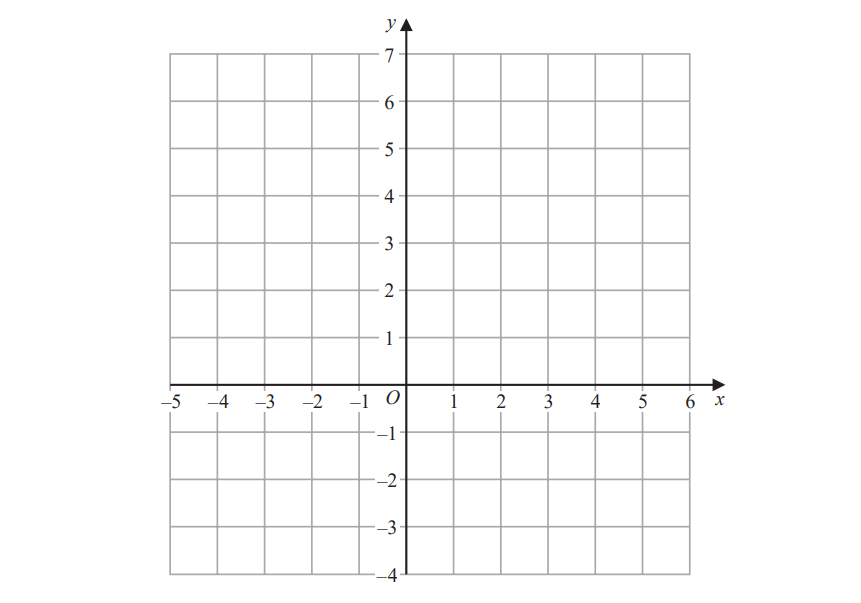
On the grid, shade the region that satisfies all these inequalities.
Label the region .
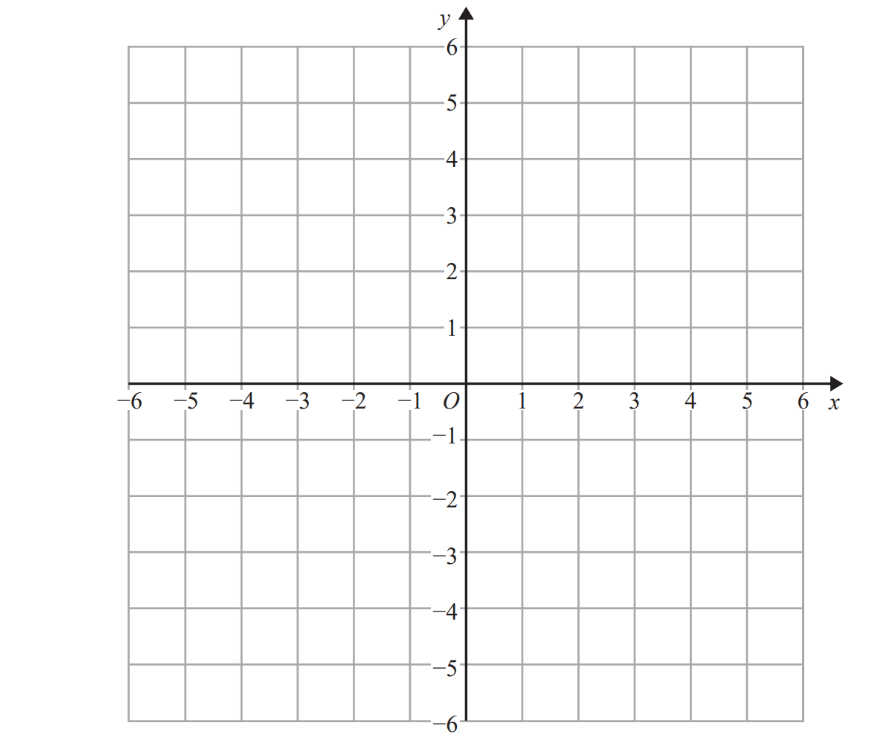
Show, by shading on the grid, the region defined by all three of the inequalities
Label your region .
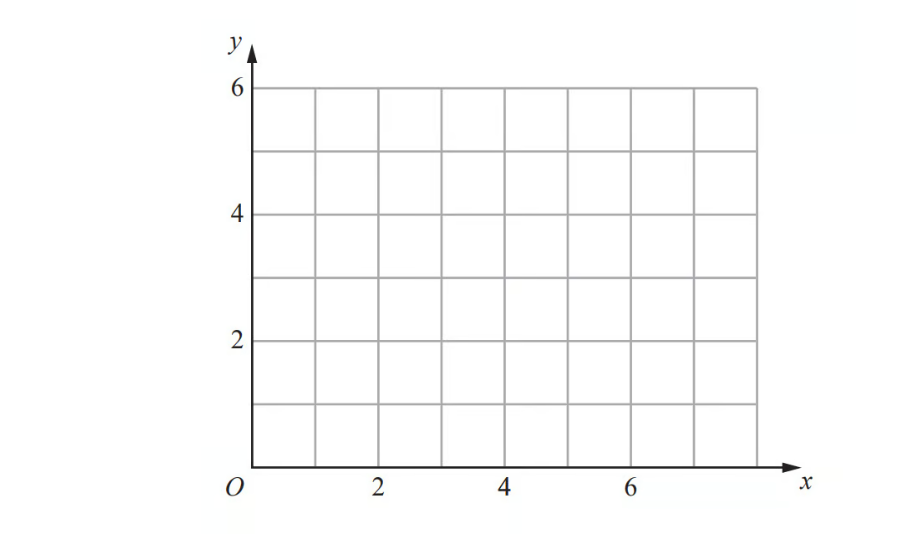
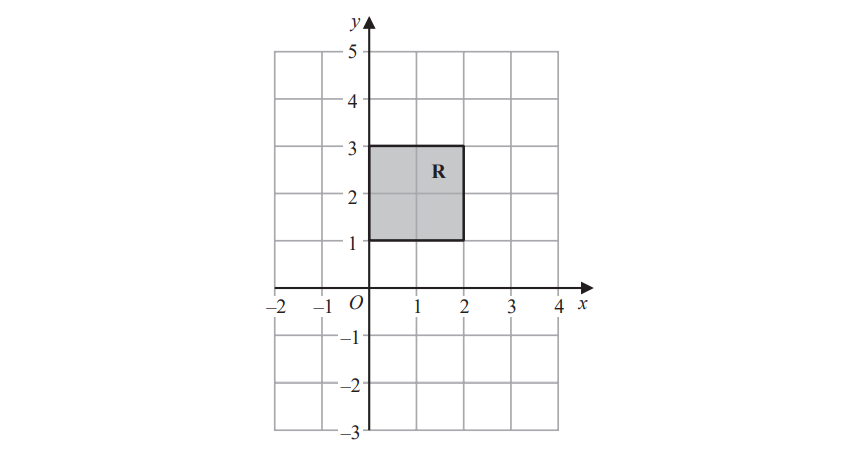
The region , shown shaded in the diagram, is bounded by four straight lines.
Write down the inequalities that define .
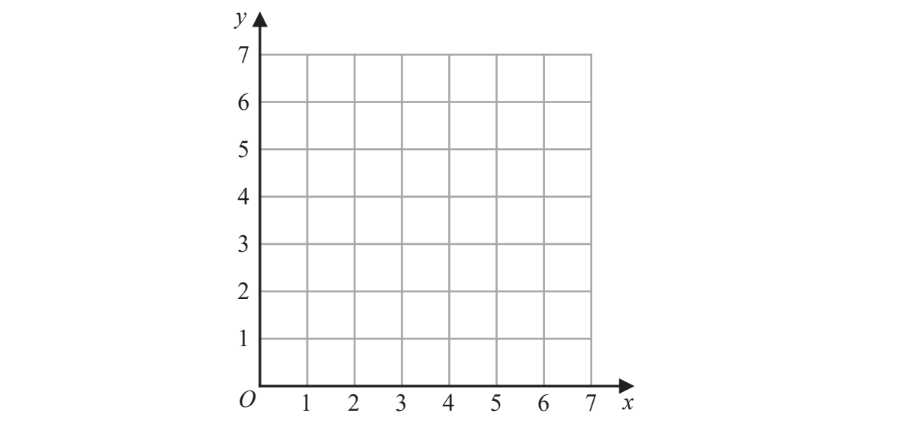
On the grid show, by shading, the region that satisfies all three of the inequalities
Label the region .
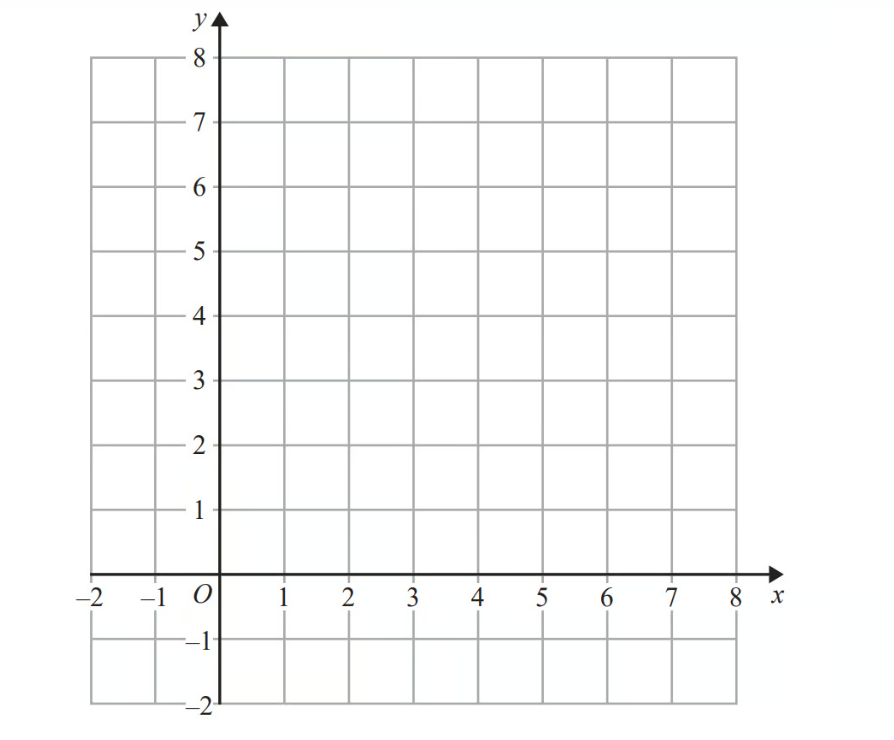
On the grid, draw and label the straight line with equation
(i)
(1 mark)
(ii)
(1 mark)
(iii)
(1 mark)
Show, by shading on the grid, the region that satisfies all three of the inequalities
x greater-than or slanted equal to 1.5 y greater-than or slanted equal to x x plus y less-than or slanted equal to 6
Label the region .
The diagram shows two straight lines drawn on a grid.
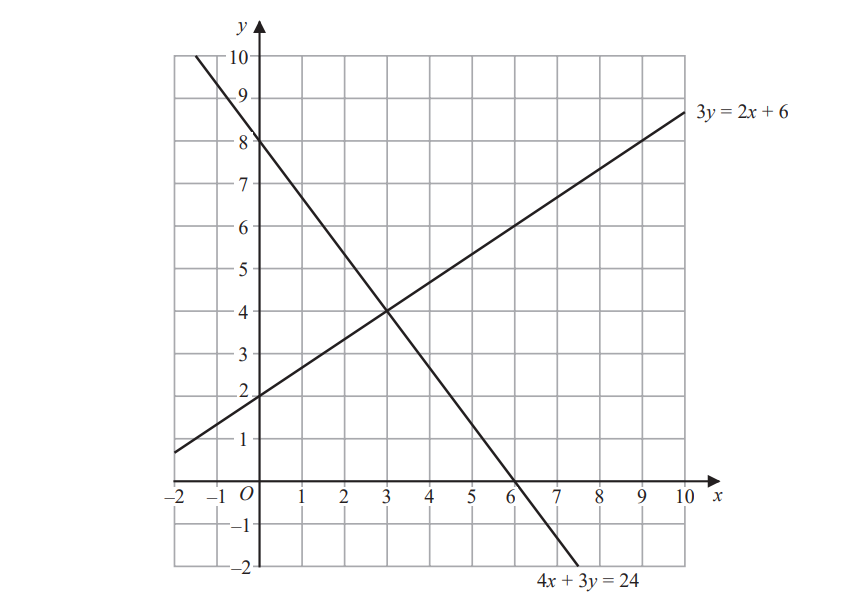
Show, by shading on the grid, the region defined by all five of the inequalities
Label the region .
The shaded region in the diagram is bounded by three lines. The equation of one of the lines is given.
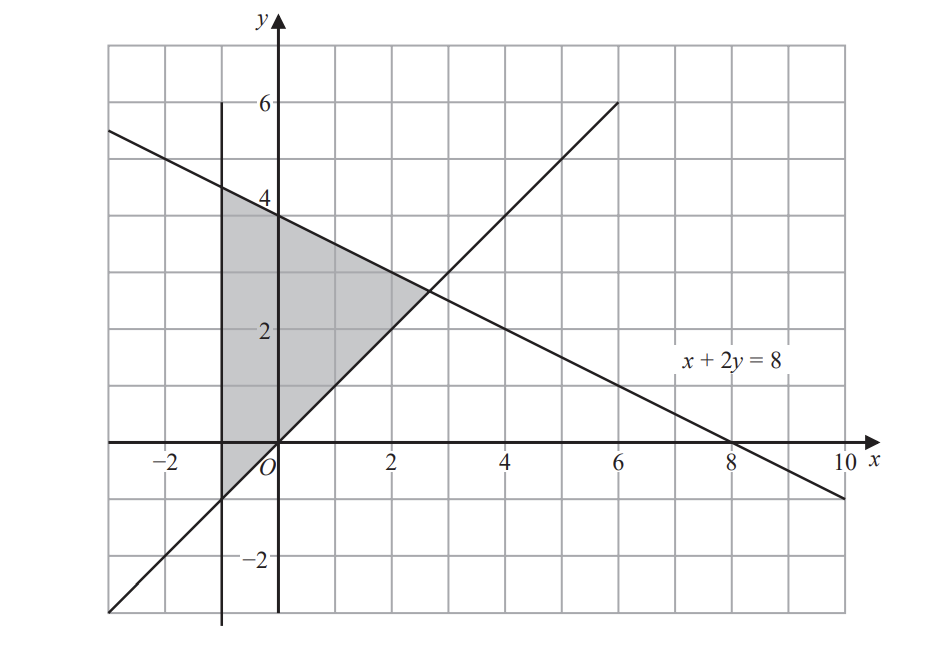
Write down three inequalities that define the shaded region.
The diagram shows two straight lines drawn on a grid.
Show, by shading on the grid, the region defined by all five of the inequalities
Label the region .
Show, by shading on the grid, the region defined by all three of the inequalities
Label the region
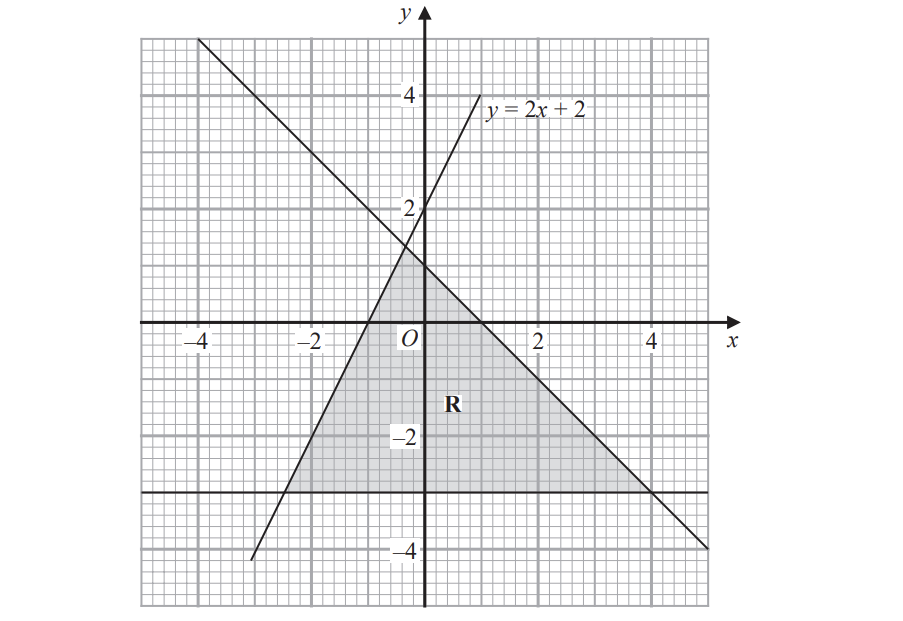
The region , shown shaded in the diagram, is bounded by three straight lines.
Write down the three inequalities that define .
The region , shown shaded in the diagram, is bounded by three straight lines.
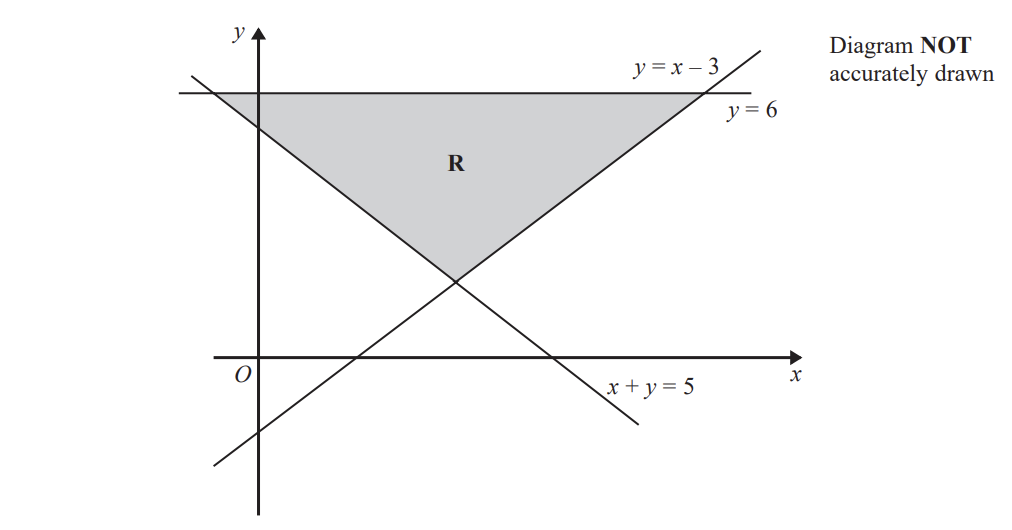
Write down the three inequalities that define the region .
The sketch shows the lines and
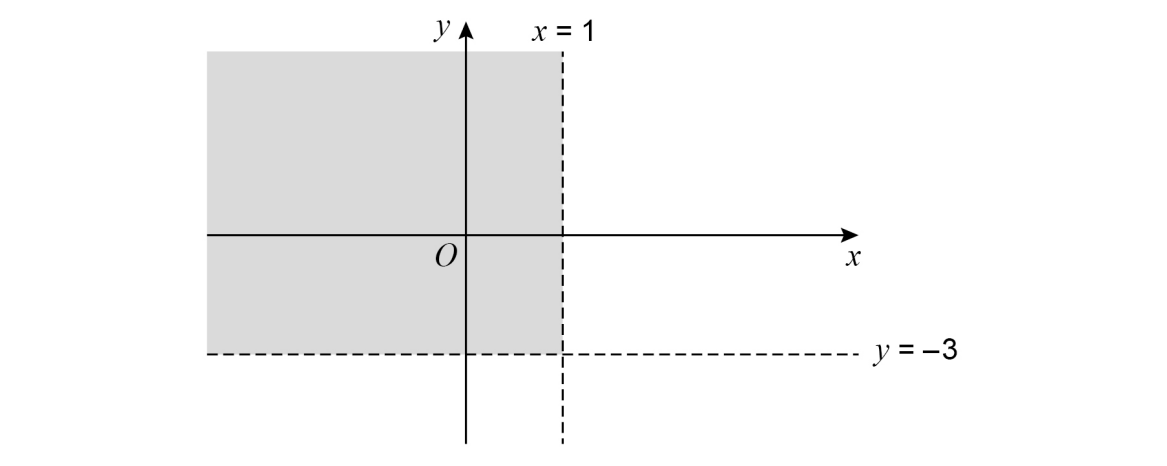
Which pair of inequalities describes the shaded region? Tick one box.
square | |
|---|---|
square | |
square | |
square |
The shaded region in the diagram is bounded by three lines.
The equation of one of the lines is given.
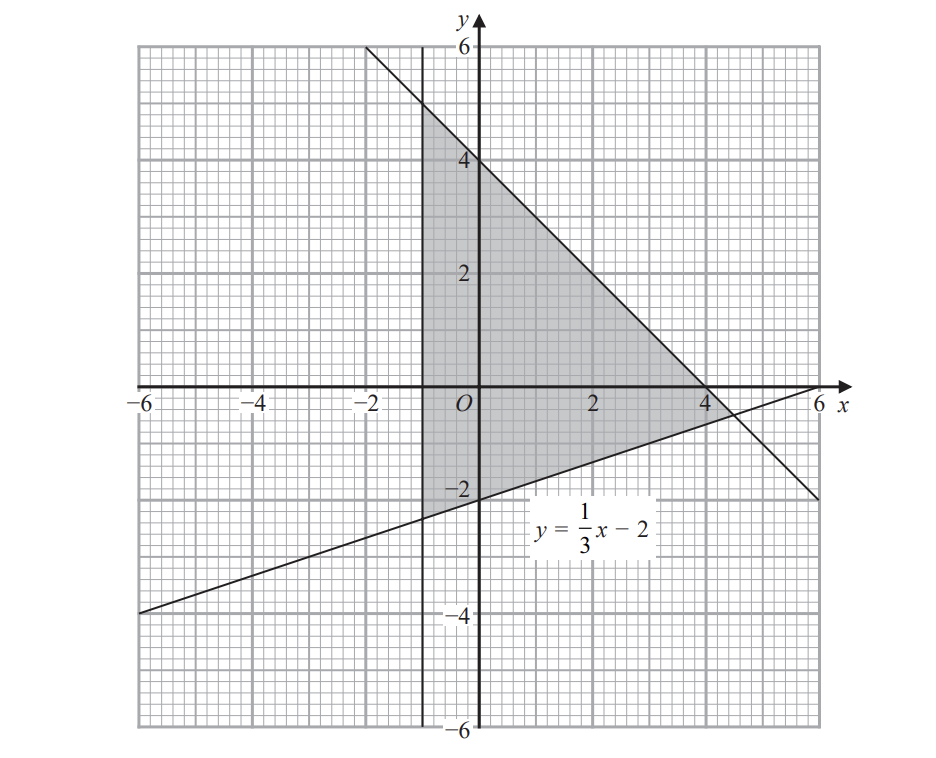
Write down the three inequalities that define the shaded region.
On the grid, identify the region represented by
Label the region R.
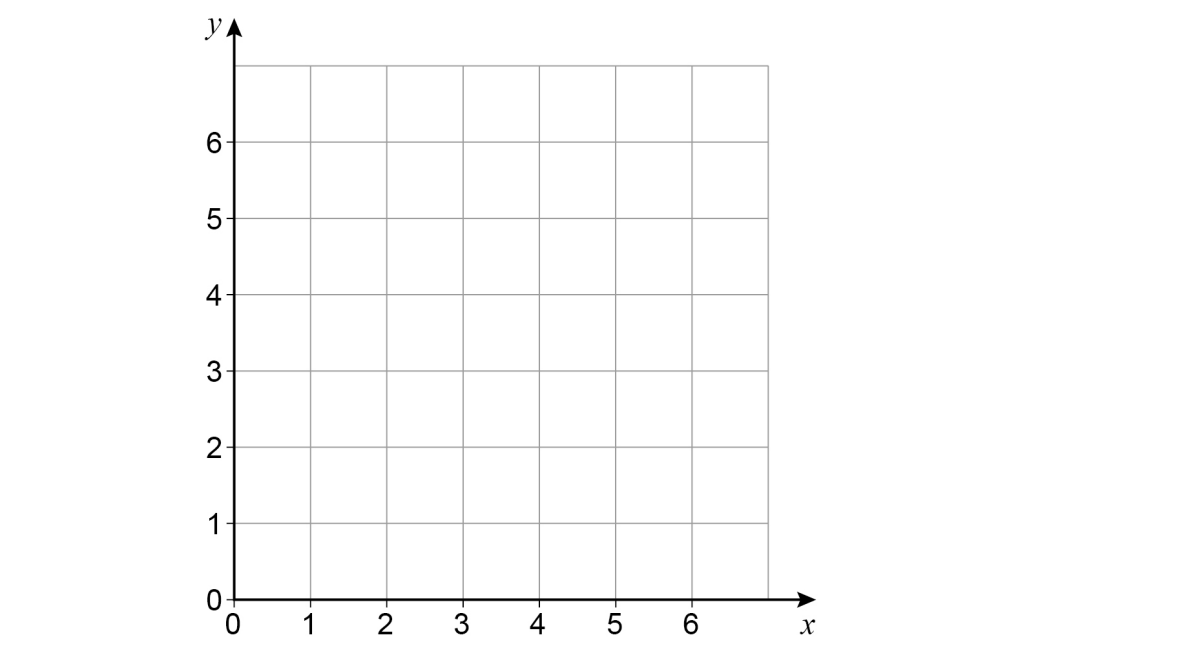
Joe draws this graph to identify the region represented by
and and
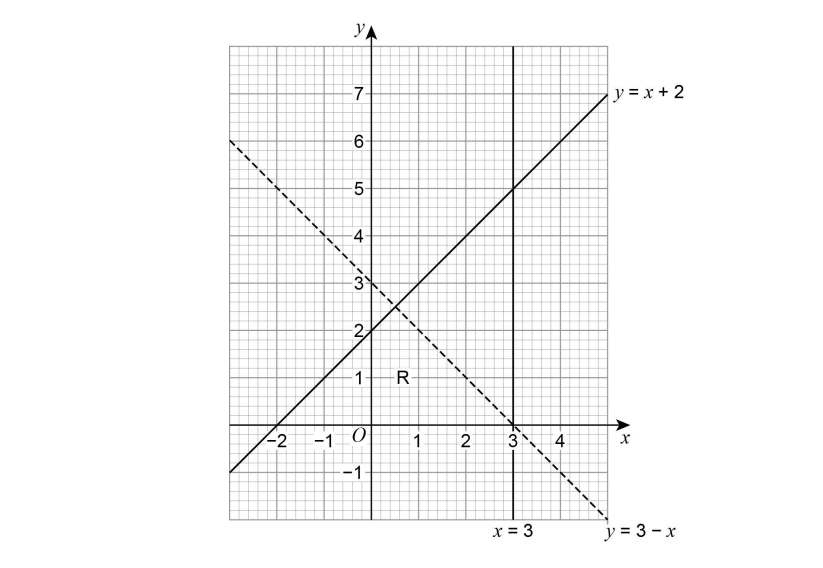
Make two criticisms of his graph.
Region R satisfies these inequalities.
By drawing three straight lines on the grid, find and label the region R.
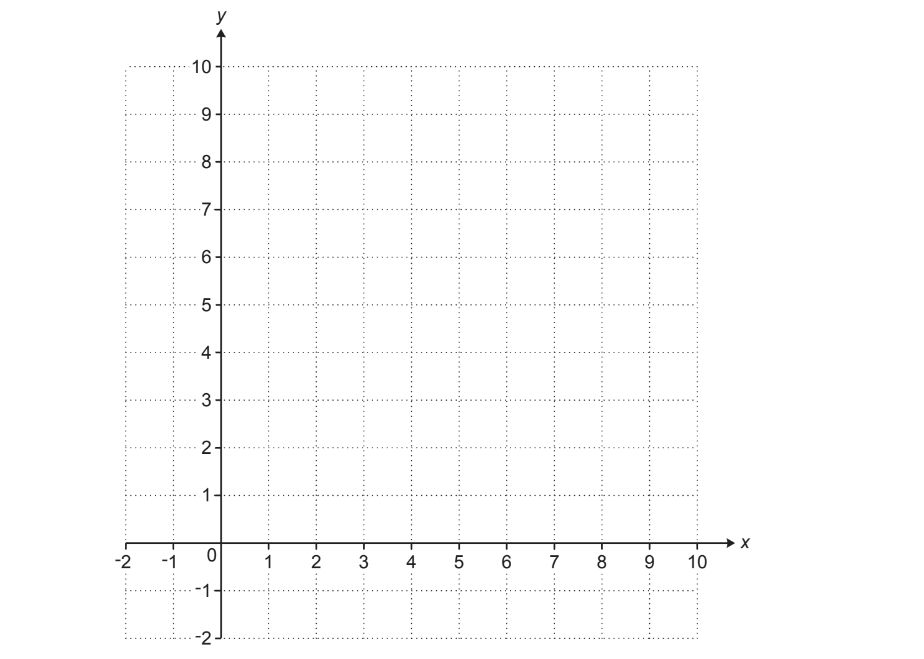
The graph of 3*y + 6x *= 13 is drawn on the grid.
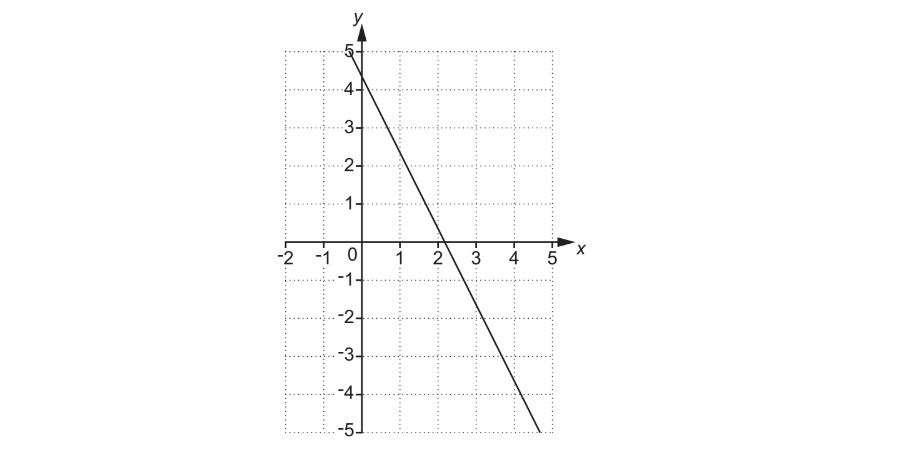
The region R satisfies these inequalities.
3 y plus 6 x greater-than or slanted equal to 13 y less-than or slanted equal to x minus 2
By drawing two more straight lines, find and label the region R.
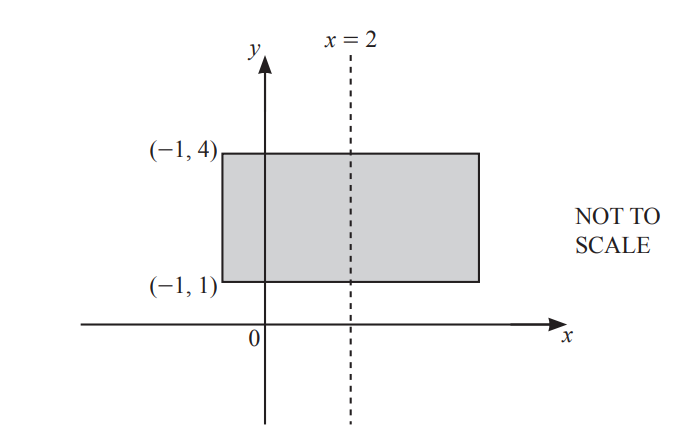
The diagram shows a rectangle with a line of symmetry at . Two vertices of the rectangle are at and .
The shaded region is defined by the inequalities and .
Find the values of and .
................................................
................................................
................................................
................................................
The diagram below shows a 1cm coordinate grid.
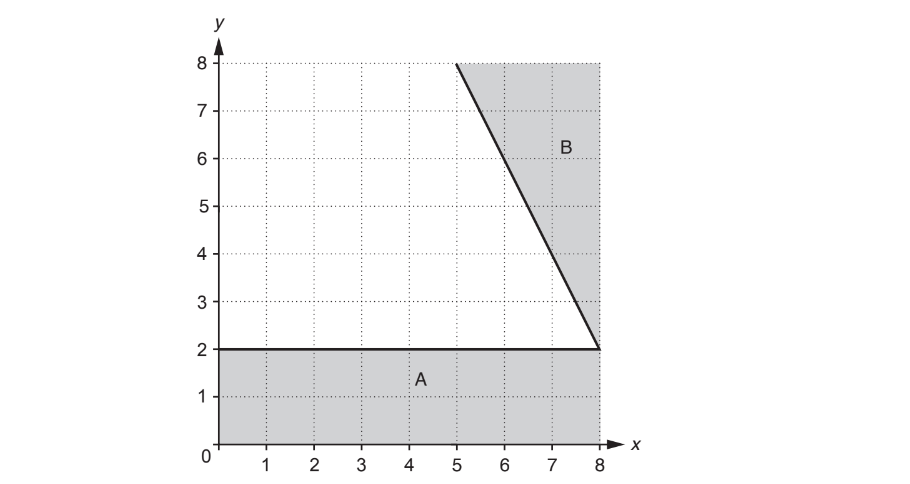
Find an inequality that defines region A and another inequality that defines region B.
Shade the region on the grid given by the inequality
A fourth shaded region, given by the inequality
is added to the grid.
The unshaded region now has area 23cm2.
Find the value of.
= ..............
The graphs of and are drawn on the grid.
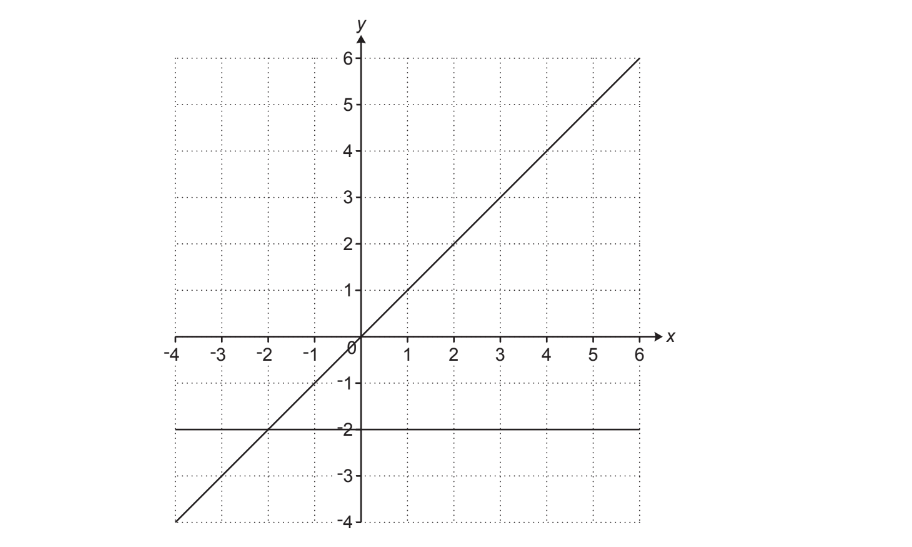
The region R satisfies the following inequalities.
y greater-than or slanted equal to negative 2 y less-than or slanted equal to x
By drawing one more line, find and label the region R.
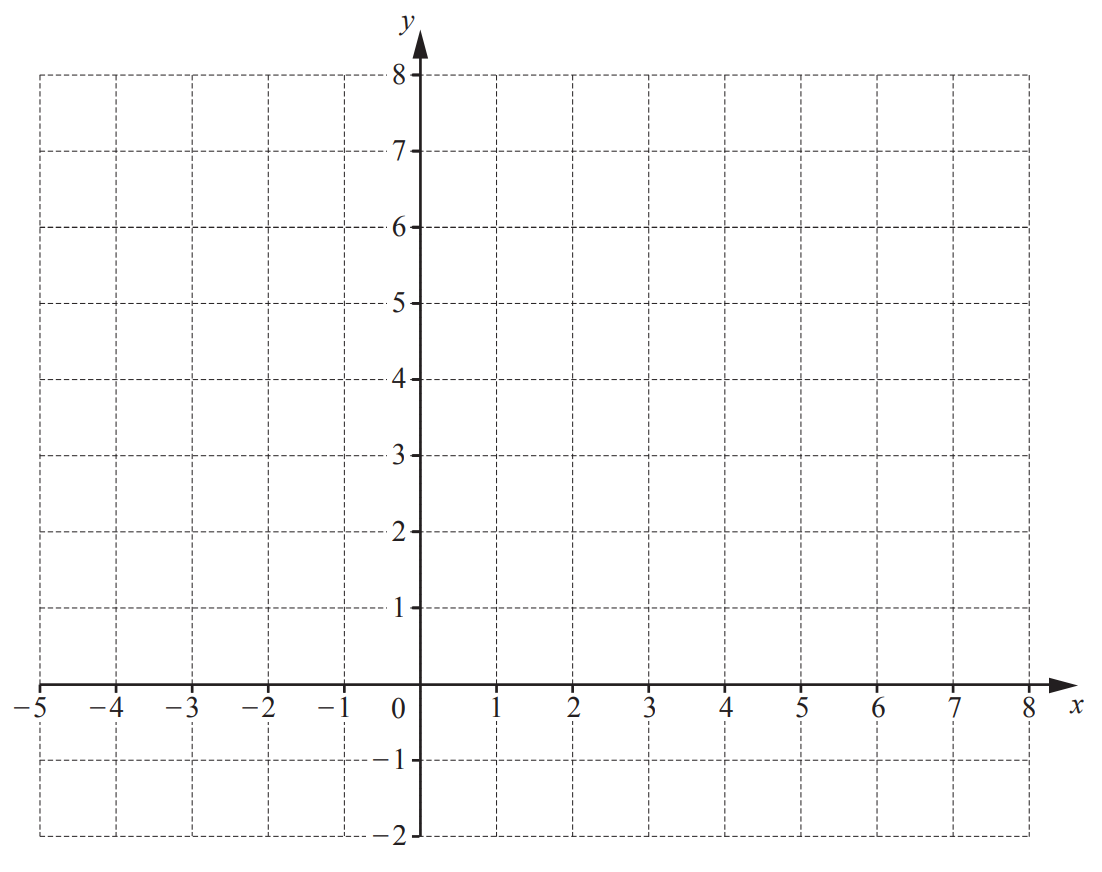
By shading the unwanted regions of the grid, draw and label the region which satisfies the following three inequalities.
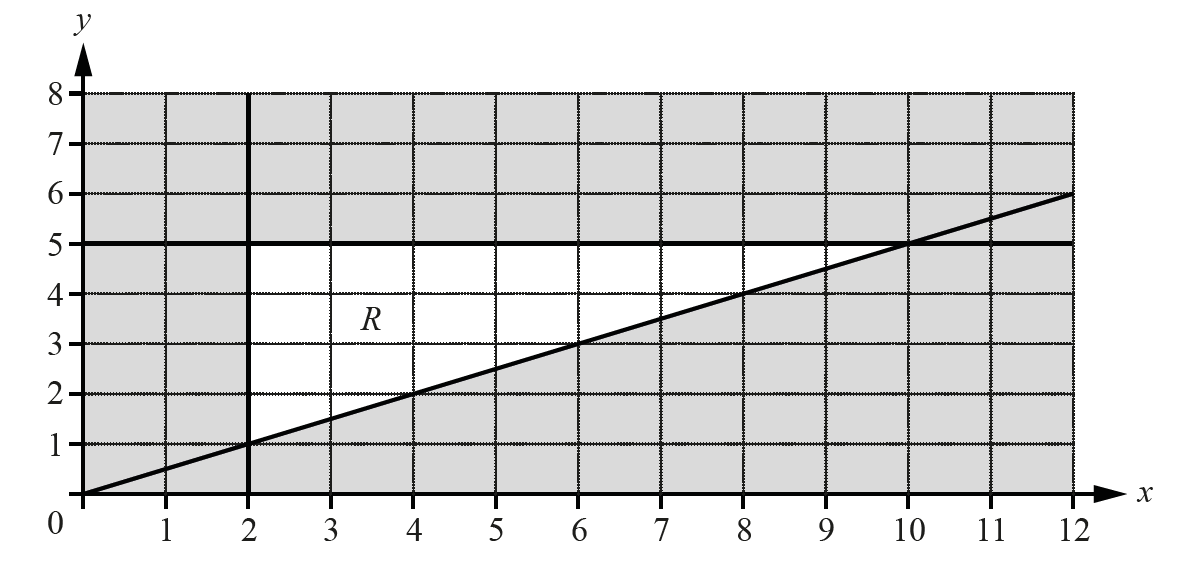
Find the three inequalities that define the region .
Find the point , with integer co-ordinates, inside the region such that .
( .............. , .............. )
The diagram shows the lines and
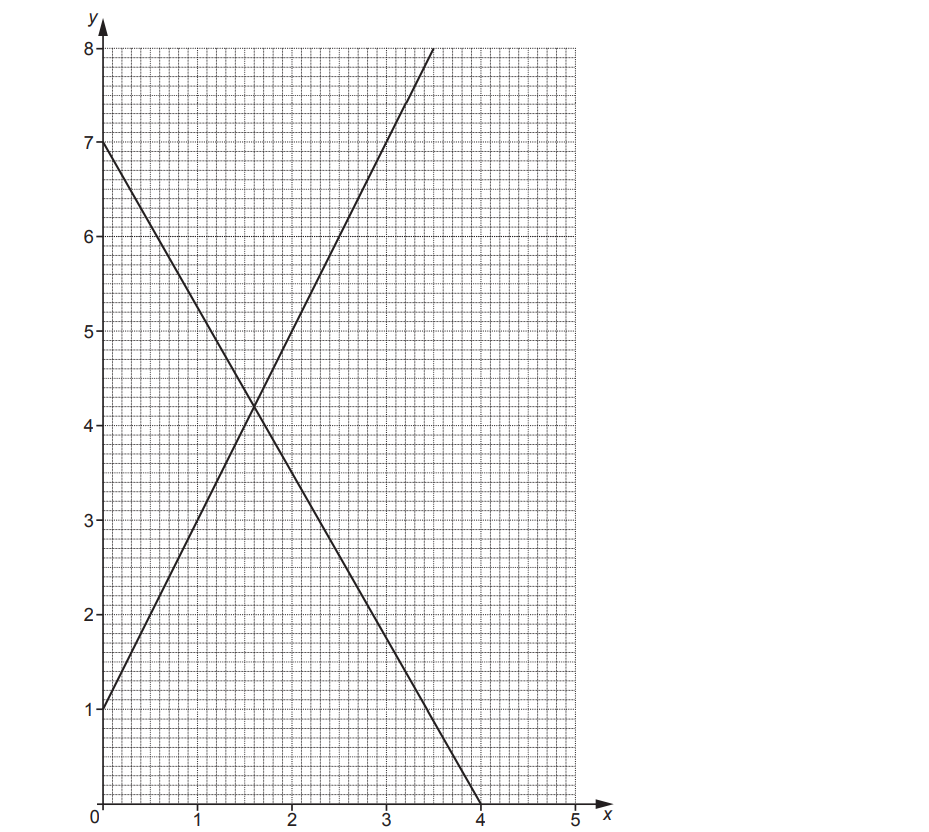
The region R satisfies these inequalities.
By drawing a third straight line, find and label the region R that satisfies these inequalities.
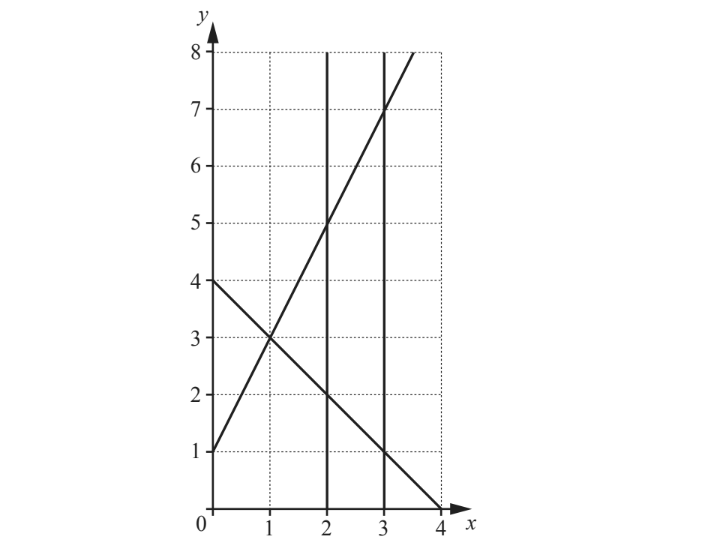
By shading the unwanted regions of the grid, find and label the region R that satisfies the following four inequalities.
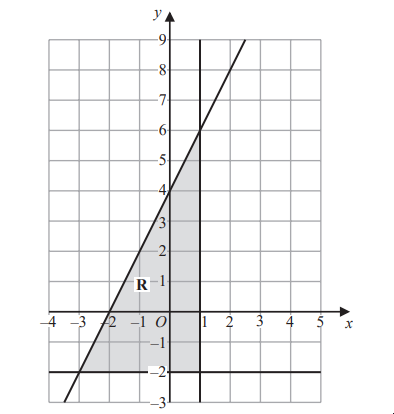
The region R, shown shaded in the diagram, is bounded by three straight lines.
Find the inequalities that define R
The region R, shown shaded in the diagram, is bounded by three straight lines.
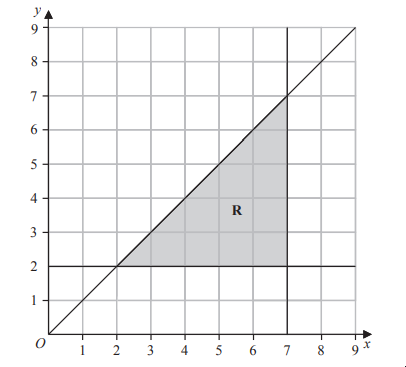
Write down the three inequalities that define the region R.