Reading & Interpreting Statistical Diagrams (Edexcel IGCSE Maths)
Spec point —
6.1C
Reading & interpreting statistical diagrams
How do I interpret statistical diagrams?
-
Read and understand the initial sentences describing the situation (context)
- Underline important words if necessary
-
Look for any keys that may help you to understand the diagram
-
For example
- 1 unit represents 20 people
- Year 10 is the solid line, Year 11 is the dotted line
- Class A is shaded, class B is striped
-
-
Read the titles of diagrams and all axes labels
- A graph for 'new students at a school' is different to 'all students at the school'
- A frequency axis that starts at 50 is different to one starting at 0
-
Understand which units are being used
- Individual lengths may be in centimetres but total length may be in metres
- Populations may be measured in thousands
-
Look out for any extreme values (outliers / anomalies)
-
One month's temperature might be unusually high
- Was it a heat wave or a recording error?
-
How do I draw conclusions from diagrams?
-
Look for overall trends in the diagram
- Prices **increase **year on year
- The temperature peaks in June
-
Use** numbers** from the graphs
-
Refer to any changes
- The steepness (gradient) of graph may change
-
Write in full sentences that copy the exact wording from the question
- 'The number of goats in farm A has decreased by 12 over the 8 month period'
- Not 'There are fewer of them now'
-
You may need to calculate the mode, median, mean or range to support any explanations
-
Understand why drawing conclusions may not be suitable
-
The data set may be too small to be representative
-
The data set may be biased
-
Consider the scope of the data
- e.g. Data for January to March cannot be used to predict August
-
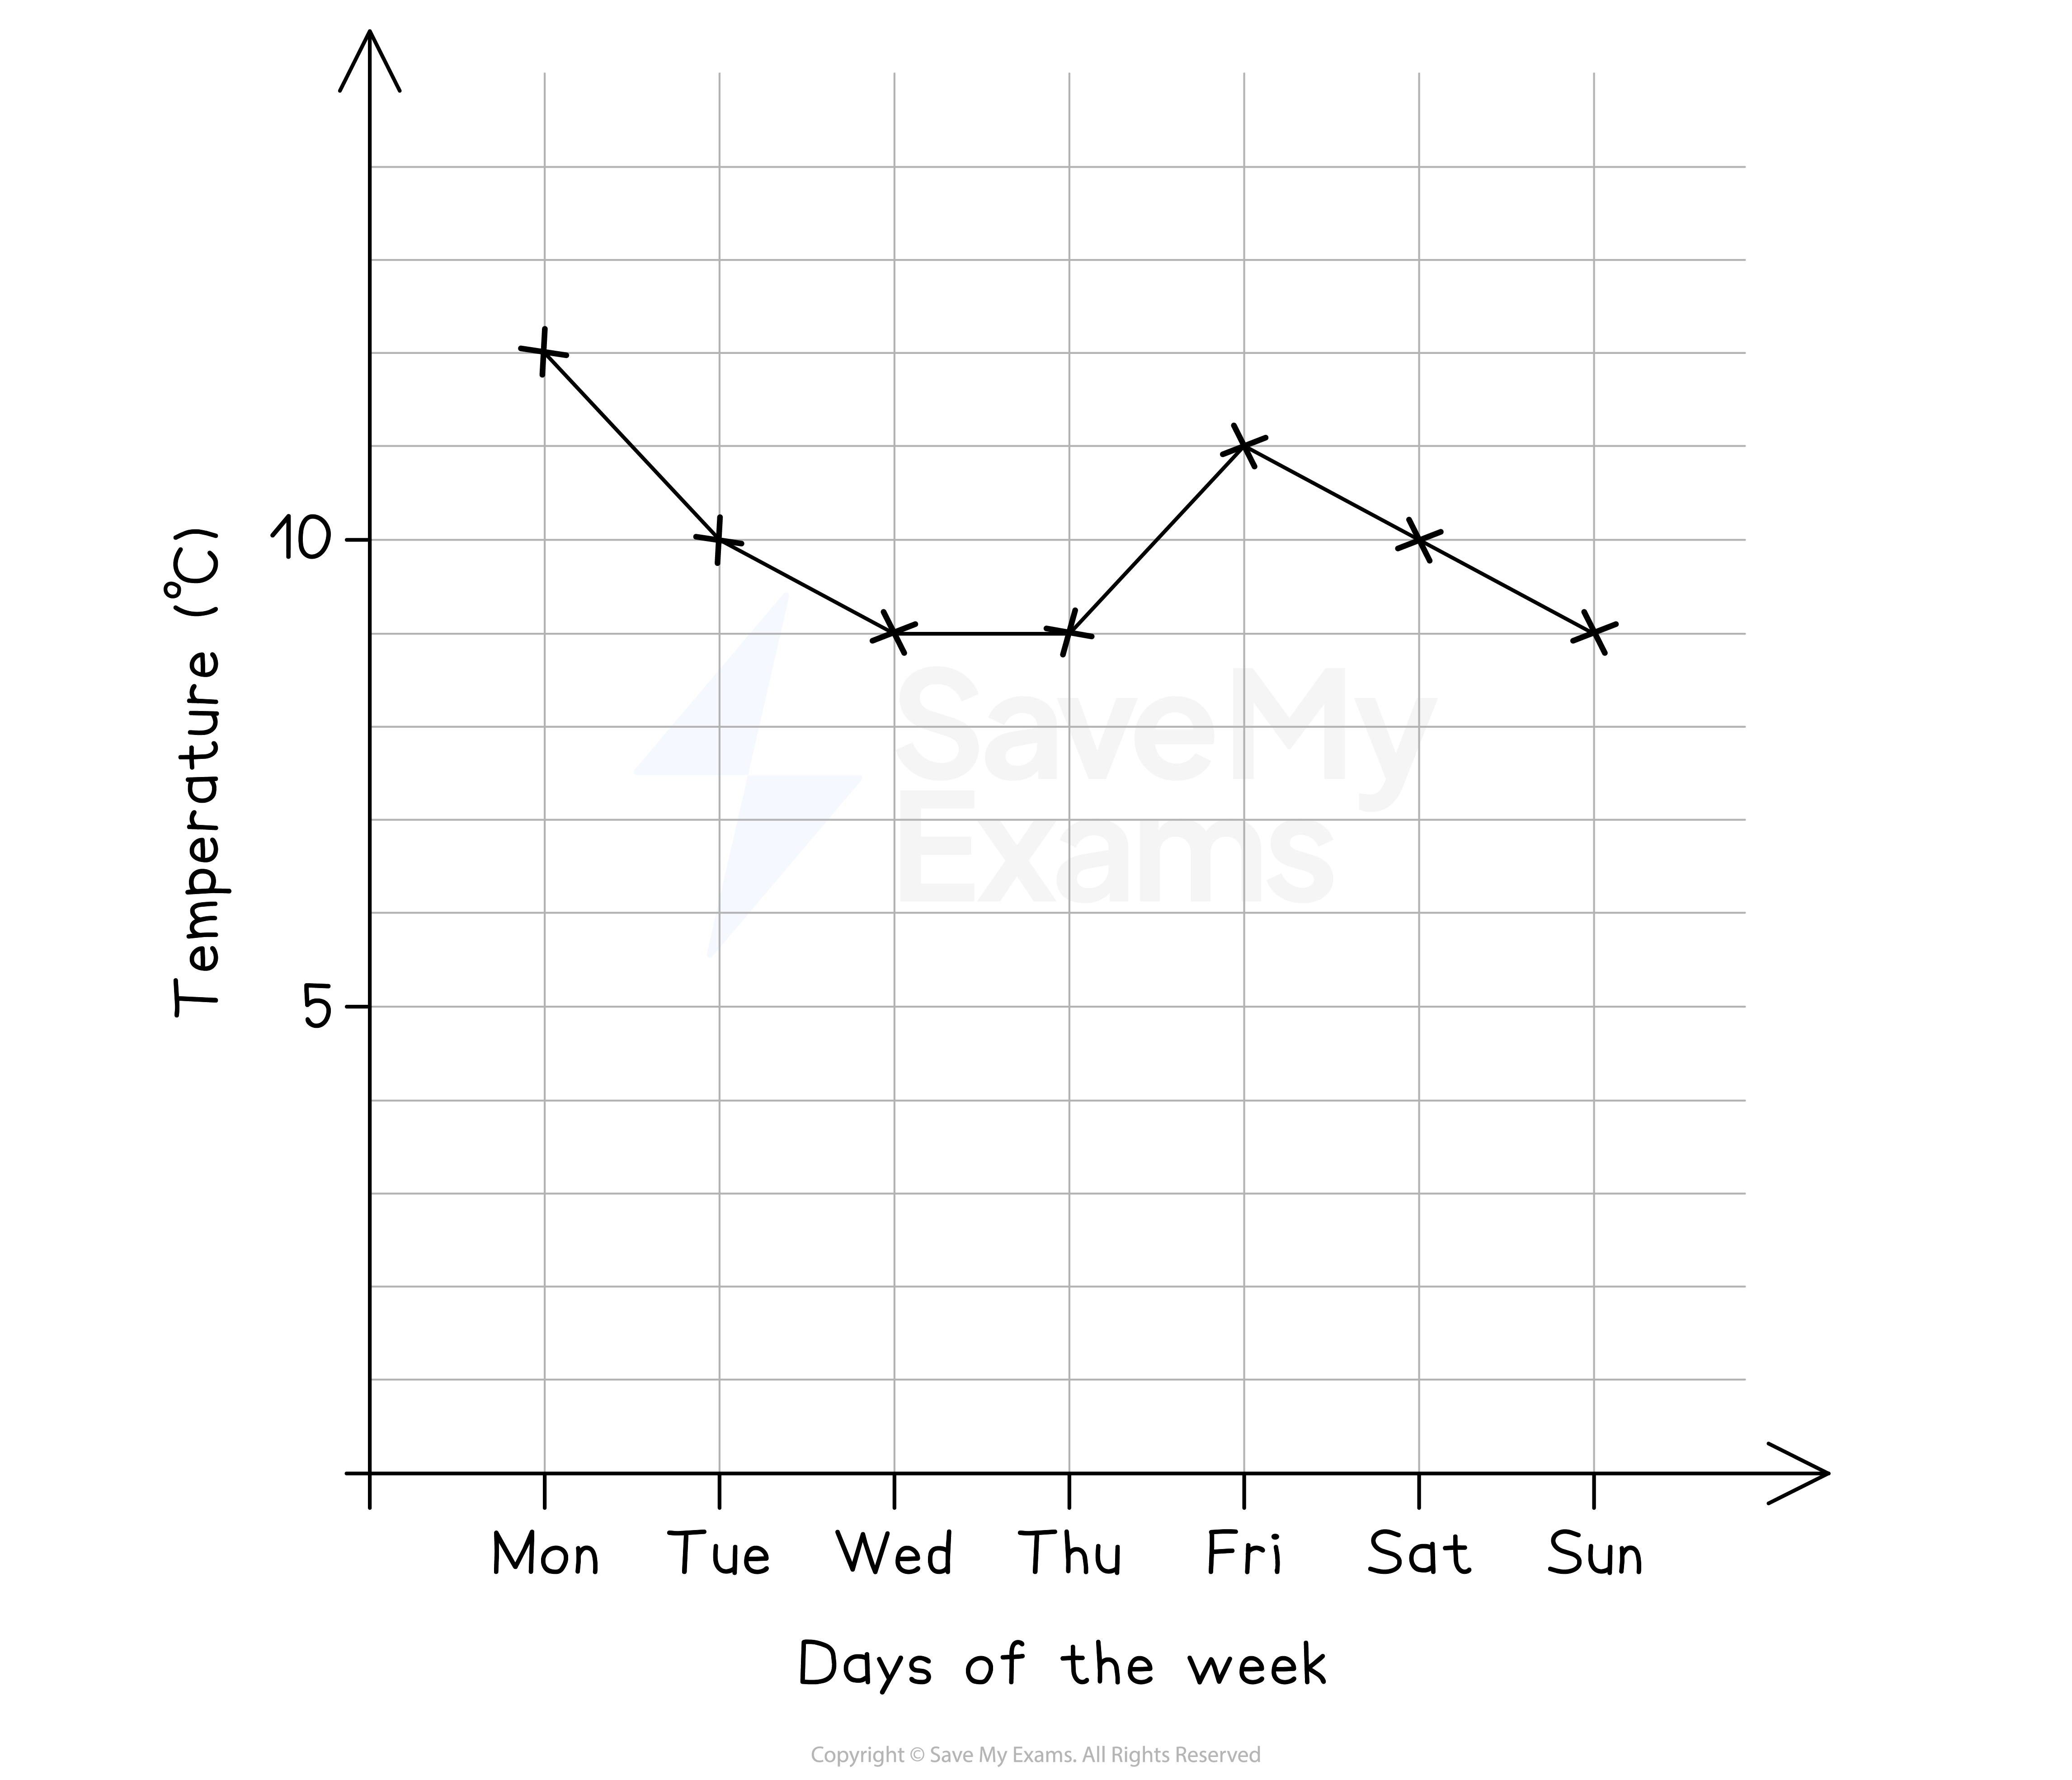
Worked Example The diagram below shows the temperature of a garden in the UK, recorded at 7am on each day of a particular week in March.
(a) Describe the change in temperature over the first four days.
Answer:
The trend shows a decrease in the first three days, then a constant temperature Find numbers from the graph to use in your answer Refer to the steepness of the change
Final answer: The temperature decreases from 12°C on Sunday to 9°C on Wednesday The decrease is steeper over the first two days There is then a constant temperature of 9°C on both Wednesday and Thursday
(b) A gardener claims that, based on the graph, Monday must have experienced the highest temperature that week.
Give a reason as to why this might not be true.
Answer:
Reread the information at the start These temperatures were recorded at 7am in the morning (we don't know how hot the rest of the day was)
Final answer: The temperatures on the graph are at 7am each day The maximum temperature may have been after 7am, on a day that was not Monday
(c) A journalist wants to use the data shown to claim that the average temperature that week was below 10°C. The mean of the temperatures shown is 10°C.
Which type of average would you suggest they use? Explain your answer.
Answer:
The mean of 10°C does not support the claim that the average temperature is below 10°C Try calculating the mode instead
12, 10, 9, 9, 11, 10, 9
The most frequent number is 9
Final answer: The modal temperature is 9°C 9°C < 10°C so using the mode would help the journalist's claim
Was this revision note helpful?
Build on this topic