Graphs of Trigonometric Functions (Edexcel IAL Maths)
Exam board Pearson Edexcel · IALUpdated 2026-07-02
Spec point —
3.3
Graphs of trigonometric functions
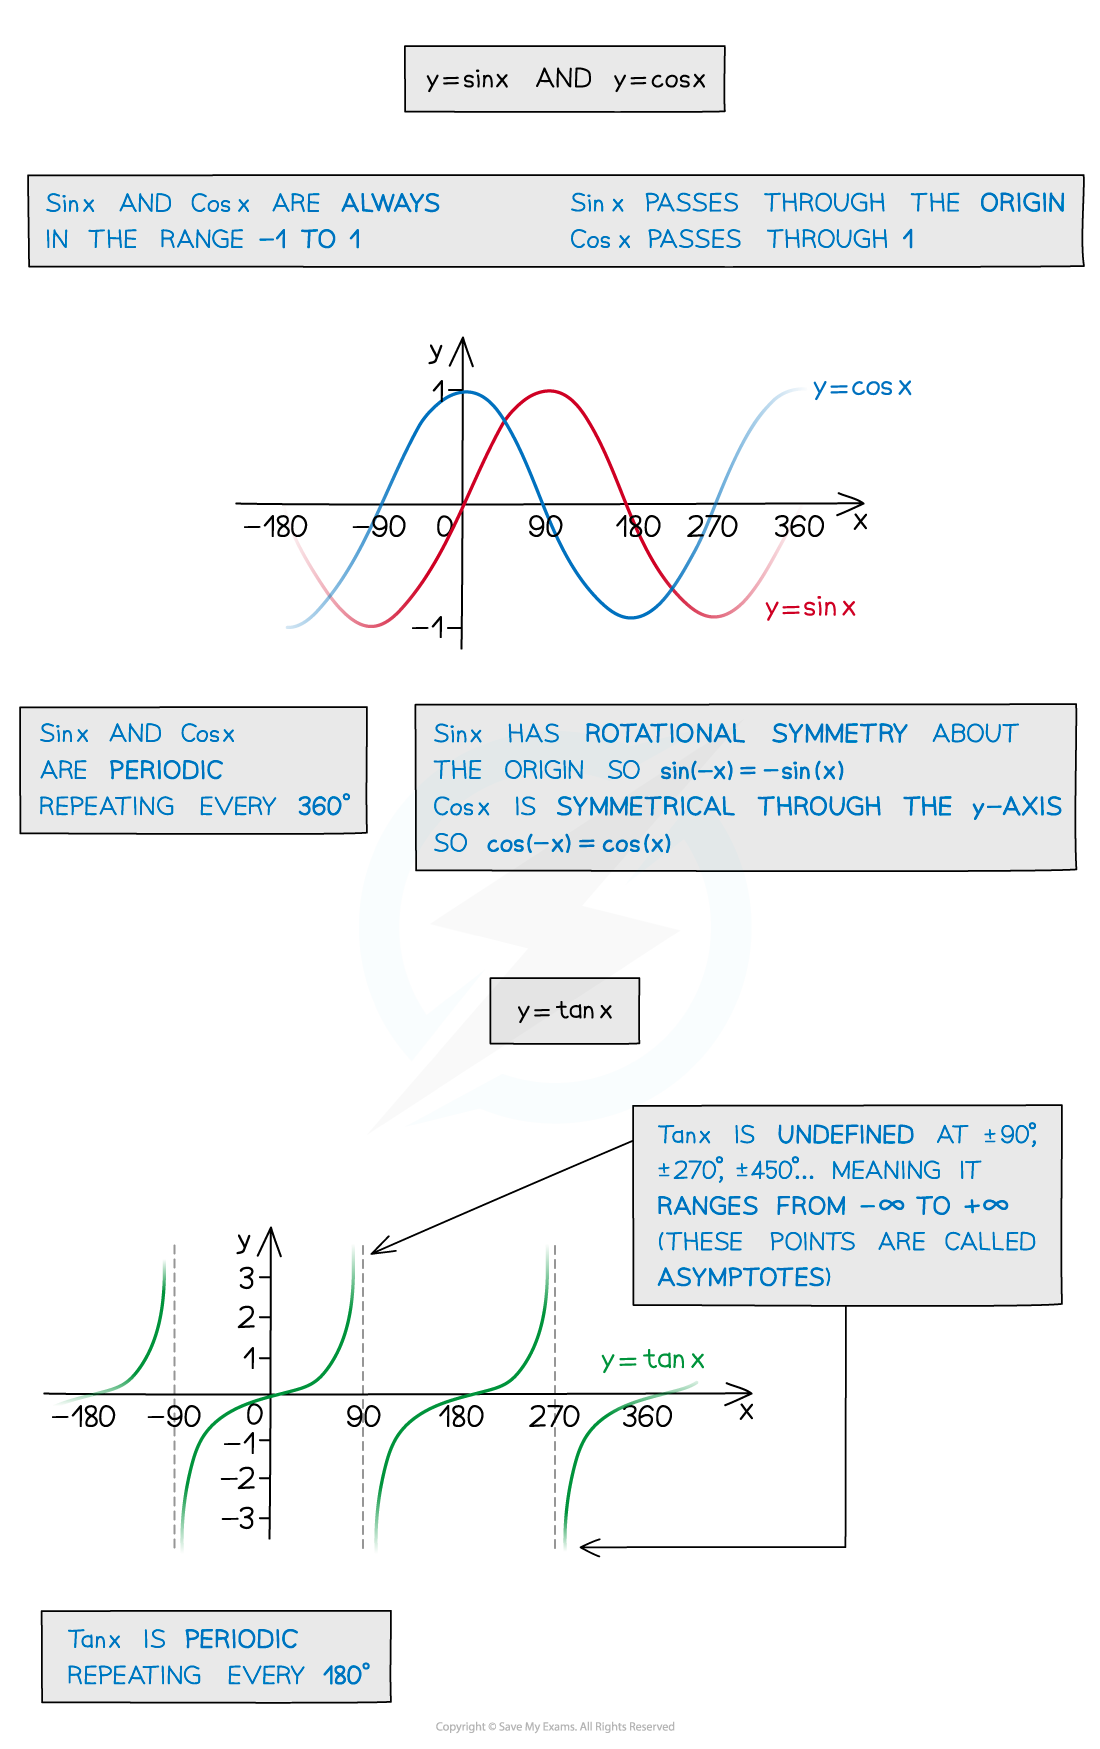
What are the graphs of trigonometric functions?
- The Trigonometric Functions Sin, Cos and Tan all have special periodic graphs that you need to be able to sketch and remember
- You’ll need to know their properties and how to sketch them to solve equations and for transforming trig functions
How do I sketch trigonometric graphs?
How do I use trigonometric graphs?
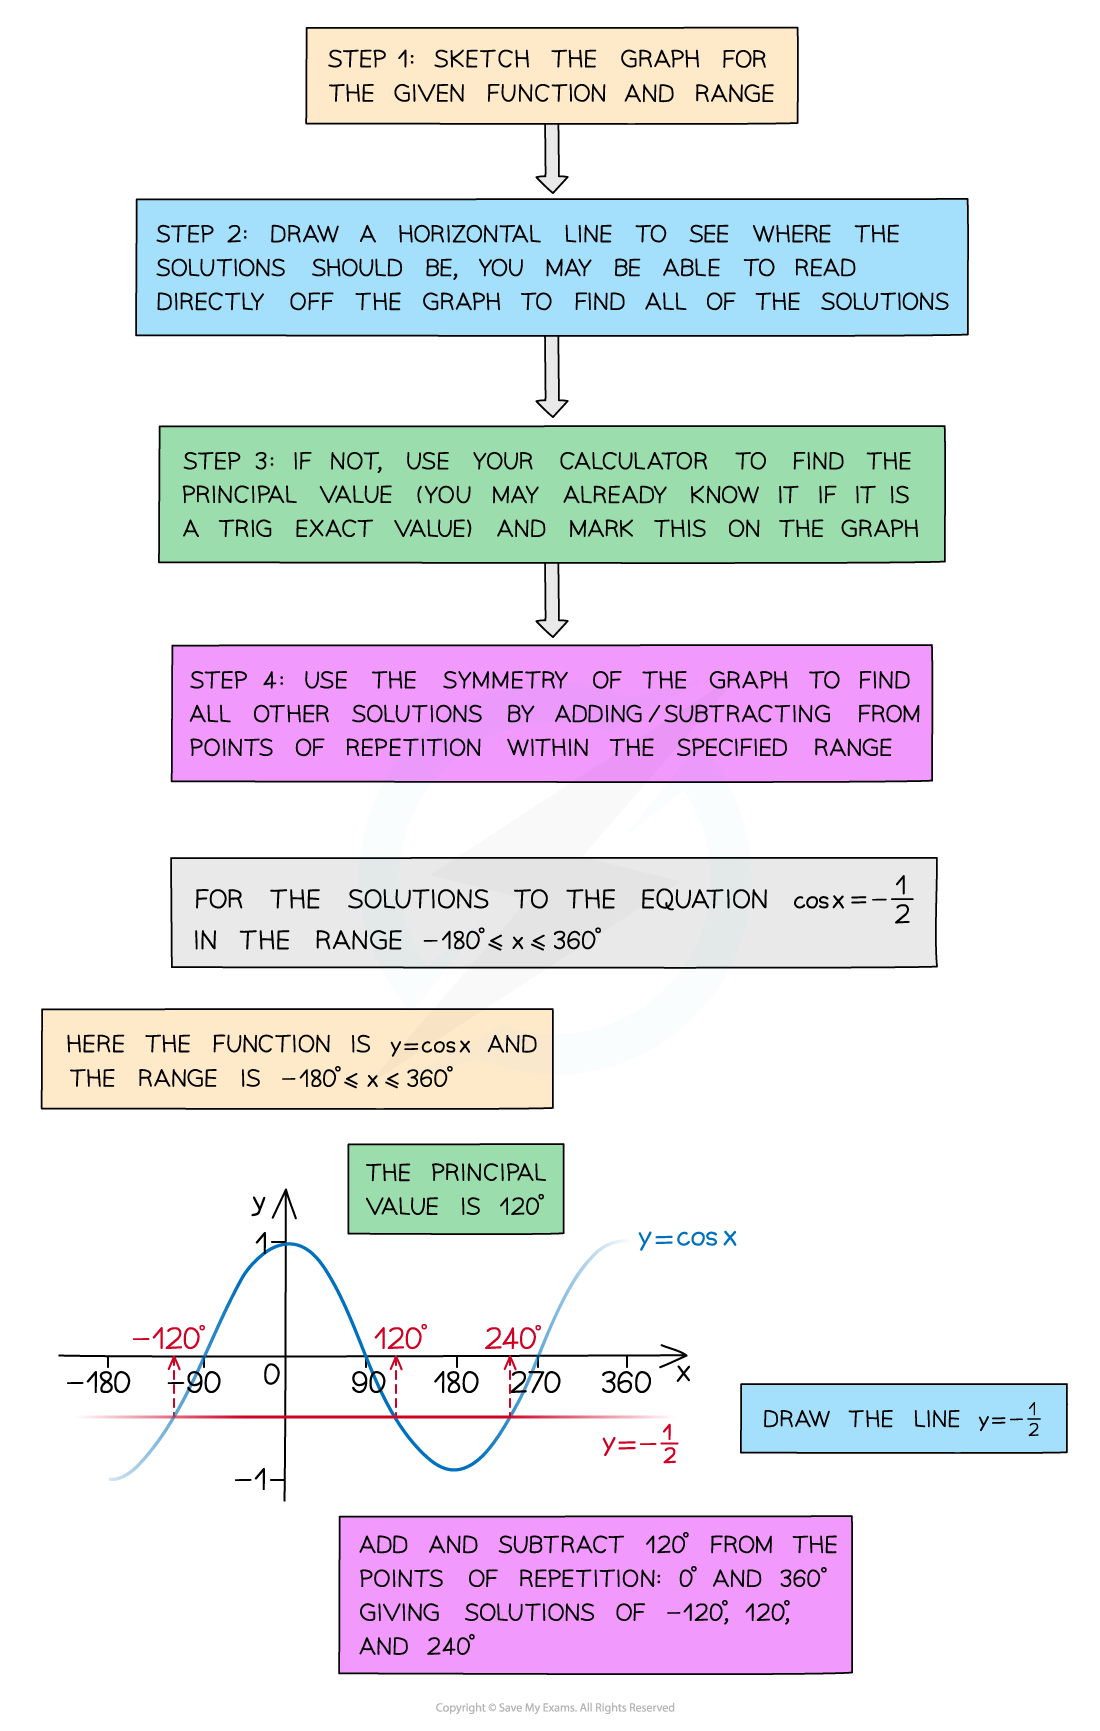
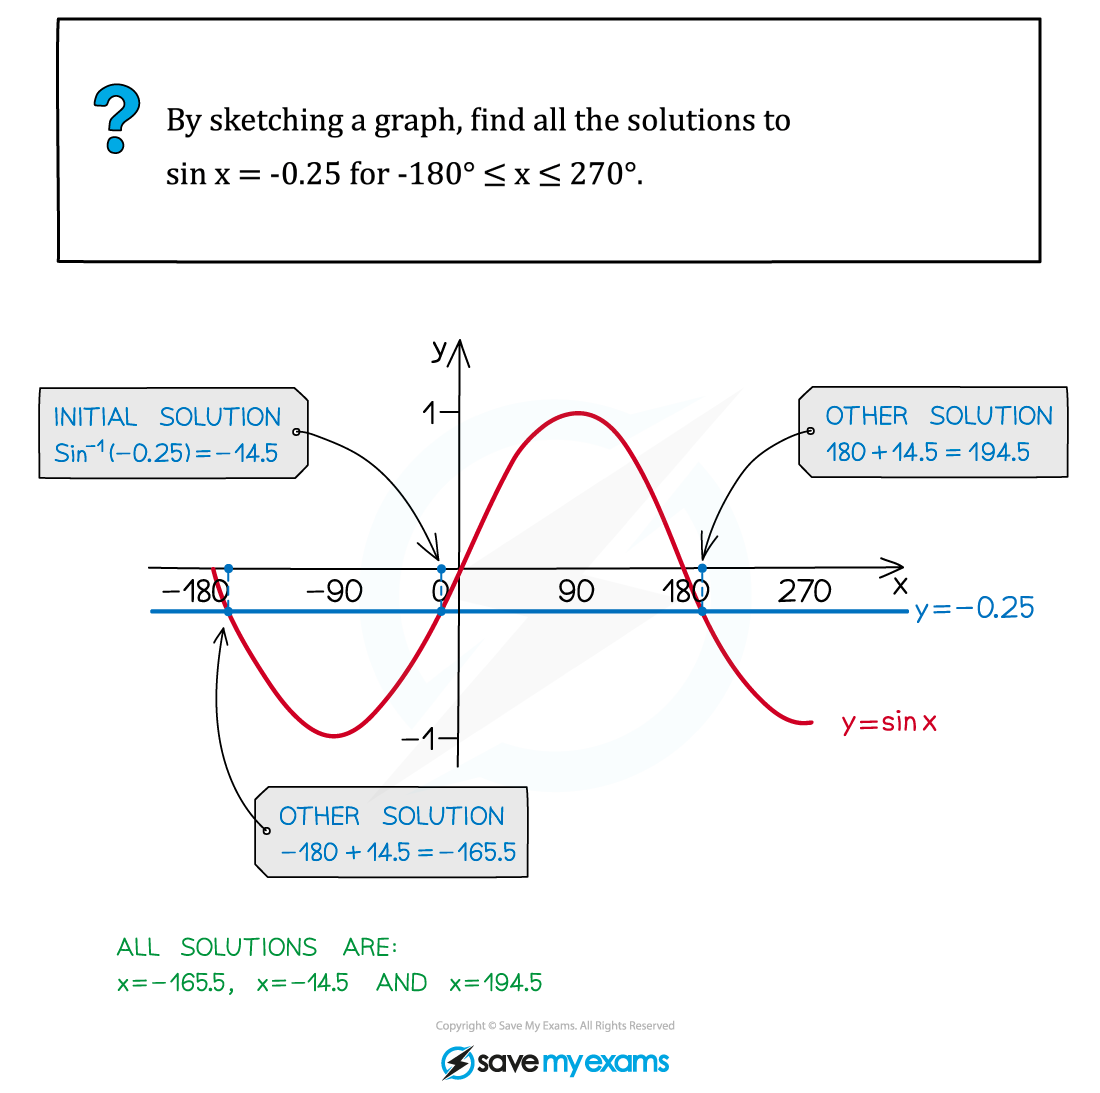
- By sketching the graph you can read off all the solutions in a given range (or interval)
- Your calculator will only give you the principal value
- You should recognise any values/angles associated with exact values
- You should be able to spot the pattern of solutions using the symmetry and periodicity of the graph
Exam Hint
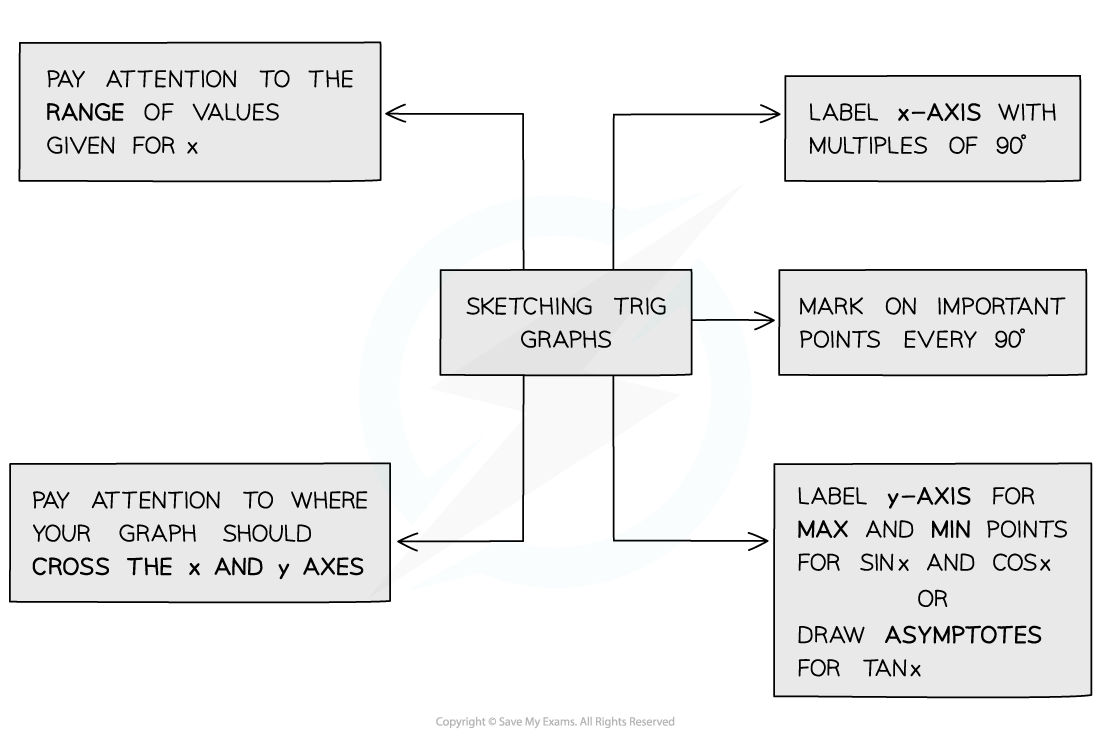
Always sketch with a pencil and draw a smooth curve and pay attention to the key features of each graph:
Where it crosses the x and y axes
- How often it repeats
- Whether it is symmetrical
Remember, when answering exam questions that ask for solutions, a sketch will help ensure you give all the appropriate solutions for a given interval.
Worked Example
Was this revision note helpful?
Build on this topic