Acceleration-Time Graphs (Edexcel IAL Maths)
Spec point —
3.1
Acceleration-Time Graphs
What is an acceleration-time graph?
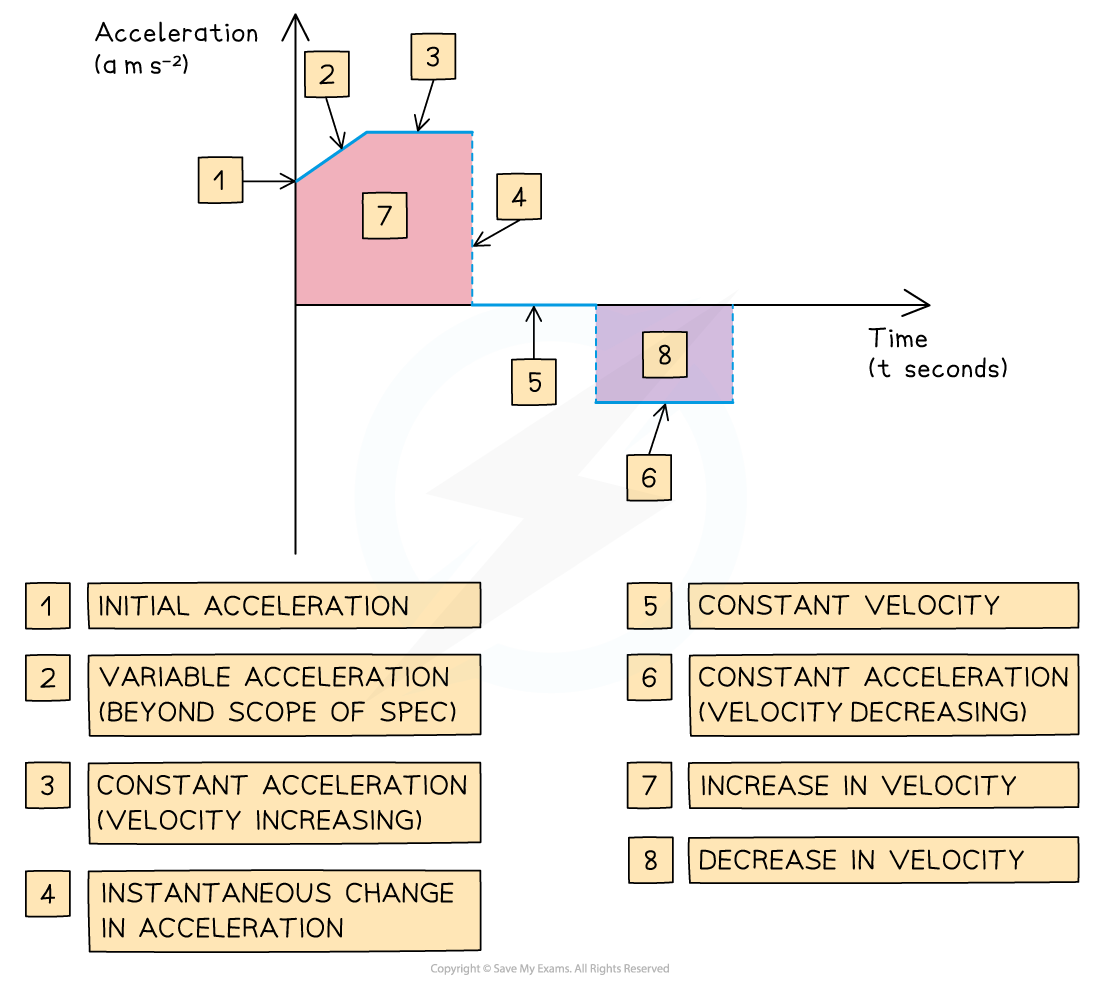
- Acceleration-time graphs show the acceleration of an object as it moves in a straight line
- They show acceleration (on the vertical axis) against time (on the horizontal axis)
- Acceleration-time graphs can go below the horizontal axis
What are the key features of an acceleration-time graph?
-
A horizontal line shows that the object is accelerating at a constant rate
-
If the graph touches the x-axis then the object is moving with constant velocity at that time
-
If the graph is above the x-axis then the object has positive acceleration and its velocity is increasing which means
- It is speeding up if it is moving forward
- It is slowing down if it is moving backwards
-
If the graph is below the x-axis then the object has negative acceleration and its velocity is decreasing which means
- It is slowing down if it is moving forward
- It is speeding up if it is moving backwards
-
The area between graph and the x-axis tells us the change in velocity of the object
- Graph above the x-axis means the velocity of the object is increasing
- Graph below the x-axis means the velocity of the object is decreasing
-
The total change in velocity of the object from its starting point is the sum of the areas above the x-axis minus the sum of the areas below the x-axis
What does an acceleration-time graph NOT show?
-
You can not tell the velocity of the object at a specific time just by looking at an acceleration-time graph
- You can calculate this using the areas between the graph and the x-axis if you know the initial velocity of the object
- If the acceleration-time graph is positive this does not guarantee that the velocity will be positive
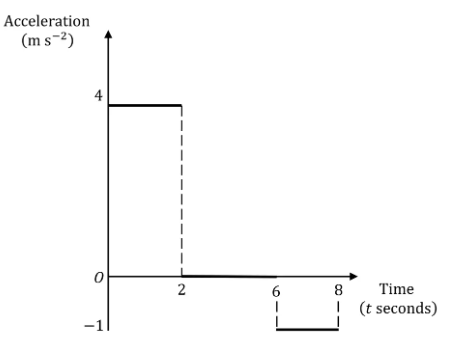
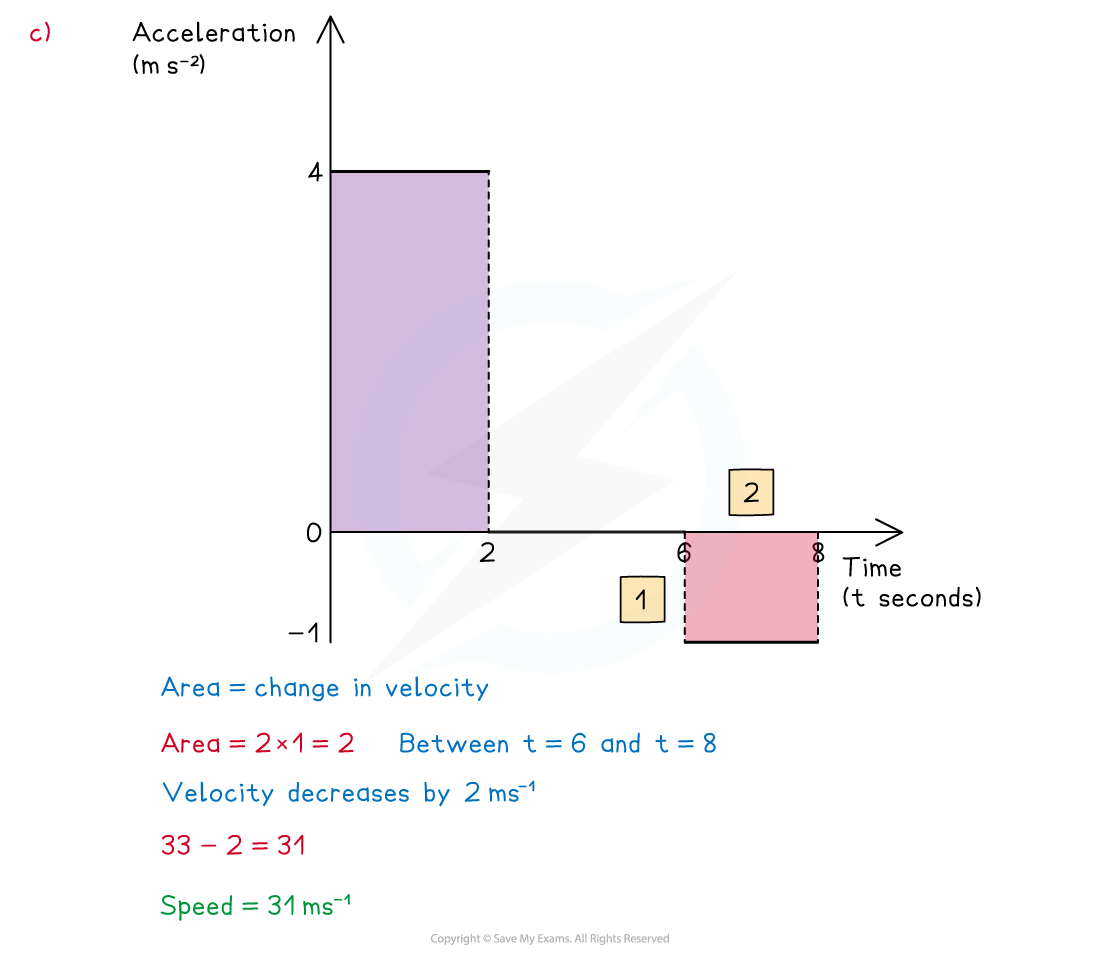
Worked Example A traffic tracks a car on the road for an 8-second period. The acceleration-time graph shows the journey of the car.
Given that the car is travelling with speed 25 m s-1 when the traffic officer starts tracking the car, find:
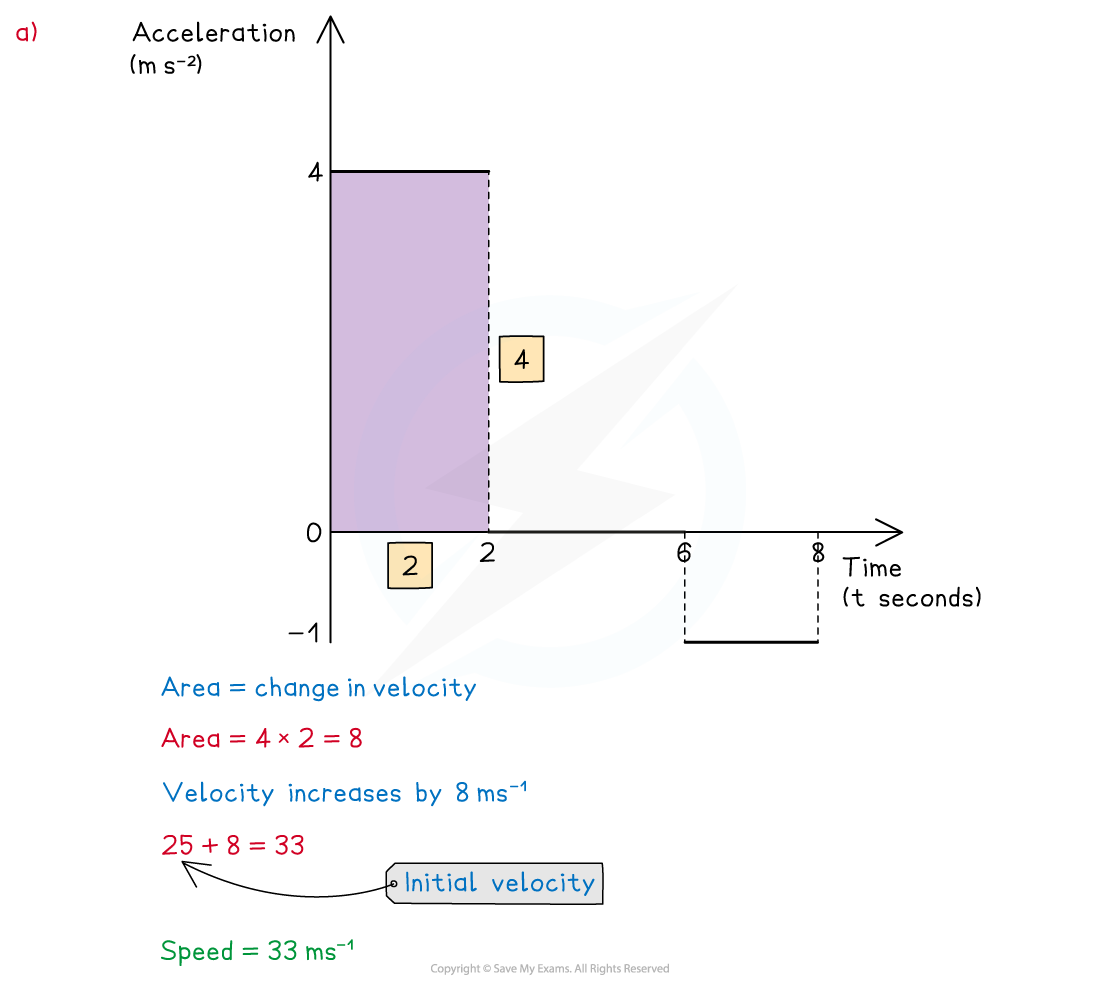
(i) the speed of the car after 2 seconds,
Answer:
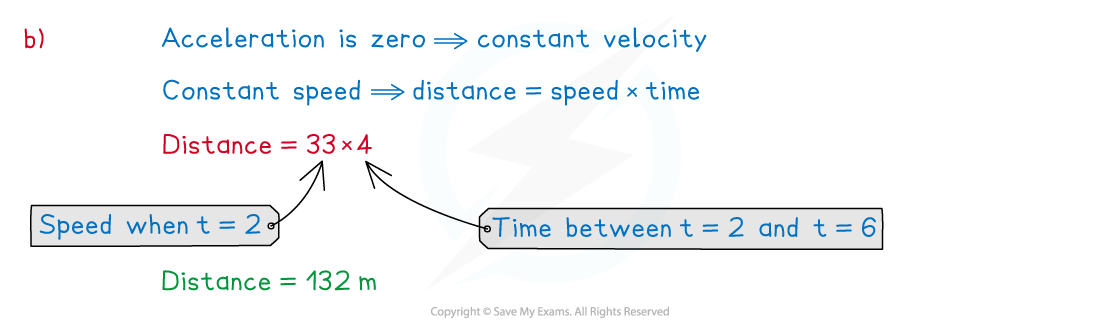
(ii) the distance travelled between the times and ,
Answer:
(iii) the speed of the car after 8 seconds.
Answer:
Exam Hint
- Most of the time the acceleration-time graphs you will encounter will comprise of three disjointed horizontal lines, acceleration-time graphs will not have curved or diagonal lines for this course. Though in real life acceleration is likely to vary.
Was this revision note helpful?