12 markseasy
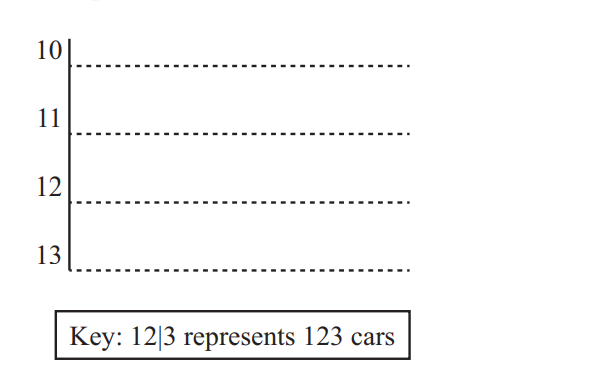
The number of cars parked in a car park at 9 am is recorded for 10 days.
124 130 129 116 132 120 127 107 118 114
Complete the stem-and-leaf diagram.
17 questions · 53 marks · ≈ 53 min
The number of cars parked in a car park at 9 am is recorded for 10 days.
124 130 129 116 132 120 127 107 118 114
Complete the stem-and-leaf diagram.
The table shows how children in Ivan’s class travel to school.
| Travel to school | Number of children |
|---|---|
| Walk | 12 |
| Car | 7 |
| Bicycle | 9 |
| Bus | 4 |
Ivan wants to draw a pie chart to show this information.
Find the sector angle for children who walk to school.
40 people were asked how many times they visited the cinema in one month. The table shows the results.
| Number of cinema visits | 0 | 1 | 2 | 3 | 4 | 5 | 6 | 7 |
|---|---|---|---|---|---|---|---|---|
| Frequency | 5 | 6 | 6 | 6 | 7 | 3 | 6 | 2 |
Omar wants to show the information from the table in a pie chart.
Calculate the sector angle for the people who visited the cinema 5 times.
Sixteen babies are born in a hospital. Here are the weights of the babies in kilograms.
2.4 2.7 3.5 4.4 4.5 4.1 4.4 2.8
4.1 3.8 3.8 4.2 3.3 3.0 3.7 3.3
Show this information in an ordered stem and leaf diagram.
You must write down all stages in your working.
Here are the ages, in years, of 15 students.
19 18 20 25 37
33 21 17 29 20
42 18 23 37 22
Show this information in an ordered stem and leaf diagram.
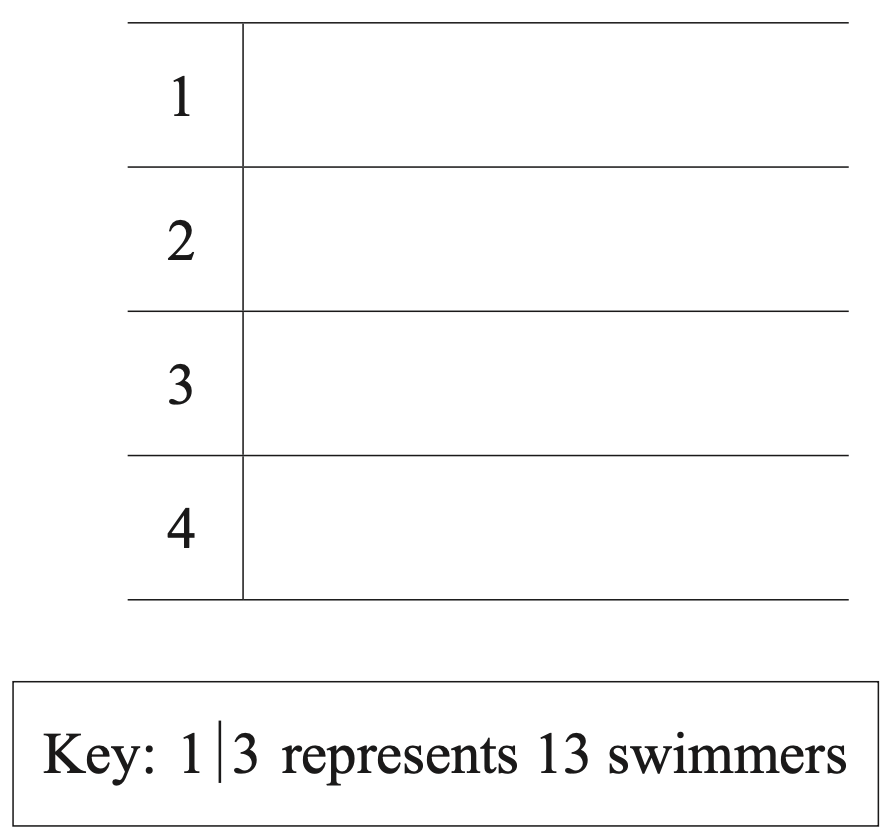
The number of people swimming in a pool is recorded each day for 12 days.
Complete the stem-and-leaf diagram.
Extract:
Find the median number of swimmers.
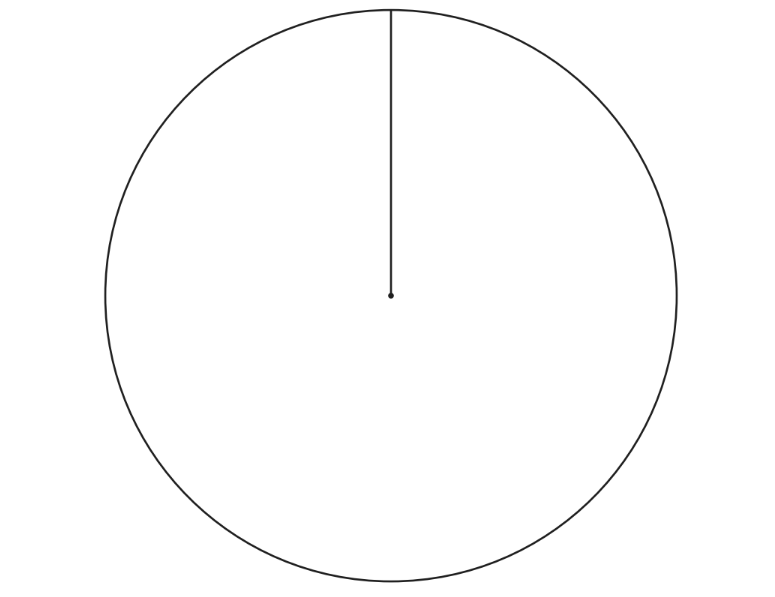
120 students choose what they want to do when they leave school. Their choices are shown in the table.
| Choice | Number of students |
|---|---|
| University | 57 |
| Training | 45 |
| Work | 18 |
Complete the pie chart to show this information. Label each sector clearly.
Here are the times, in minutes, that 20 children took to walk to school.
13 21 19 27 31 5 23 29 18 25
34 15 28 23 22 40 16 19 32 9
Draw an ordered stem and leaf diagram for these times.
Here are the heights, in cm, of 18 children.
98 90 84 102 115 91
88 91 108 110 97 93
90 89 103 95 92 106
Show this information in an ordered stem and leaf diagram.
Here are the heights, in mm, of 20 plants.
53 44 48 56 48 64 51 33 41 44
31 52 55 63 60 56 47 61 37 56
Draw an ordered stem and leaf diagram for these heights.
Here are the speeds, in miles per hour, of 16 cars.
31 52 43 49 36 35 33 29
54 43 44 46 42 39 55 48
Draw an ordered stem and leaf diagram for these speeds.
Here are the lengths, in cm, of 15 tables.
28 51 42 23 63
38 44 29 32 37
61 35 39 41 25
Draw an ordered stem and leaf diagram for these lengths.
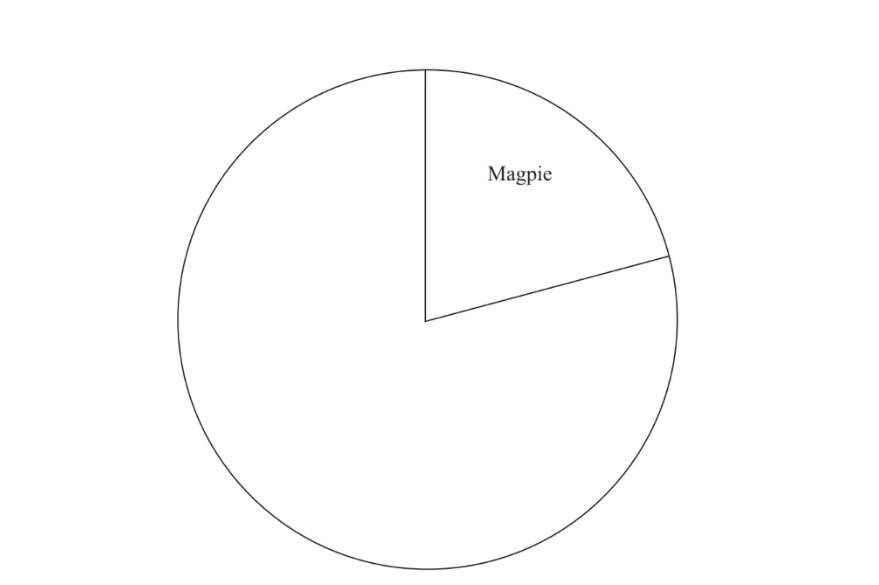
The table gives some information about the birds Paula sees in her garden one day.
| Bird | Frequency |
|---|---|
| Magpie | 15 |
| Thrush | 10 |
| Startling | 20 |
| Sparrow | 27 |
Complete the accurate pie chart.
Here are the heights in centimetres of 20 men.
| 165 | 164 | 176 | 179 | 188 | 178 | 183 | 172 | 180 | 190 |
|---|---|---|---|---|---|---|---|---|---|
| 167 | 159 | 156 | 176 | 173 | 168 | 169 | 182 | 167 | 192 |
Show this information in an ordered stem and leaf diagram.
Extract:
Here are the heights in centimetres of 20 men.
| 165 | 164 | 176 | 179 | 188 | 178 | 183 | 172 | 180 | 190 | | 167 | 159 | 156 | 176 | 173 | 168 | 169 | 182 | 167 | 192 |
Work out the percentage of these men with a height greater than 184 cm.
Chloe recorded the test marks of 20 students.
| 22 | 29 | 38 | 16 | 36 | 18 | 30 | 21 | 27 | 43 |
|---|---|---|---|---|---|---|---|---|---|
| 14 | 41 | 25 | 38 | 46 | 19 | 48 | 34 | 23 | 46 |
Show this information in an ordered stem and leaf diagram.
Extract:
22, 29, 38, 16, 36, 18, 30, 21, 27, 43, 14, 41, 25, 38, 46, 19, 48, 34, 23, 46
One of these students is going to be chosen at random.
Find the probability that this student has a test mark less than 28
The pie chart shows information about voters in an election.
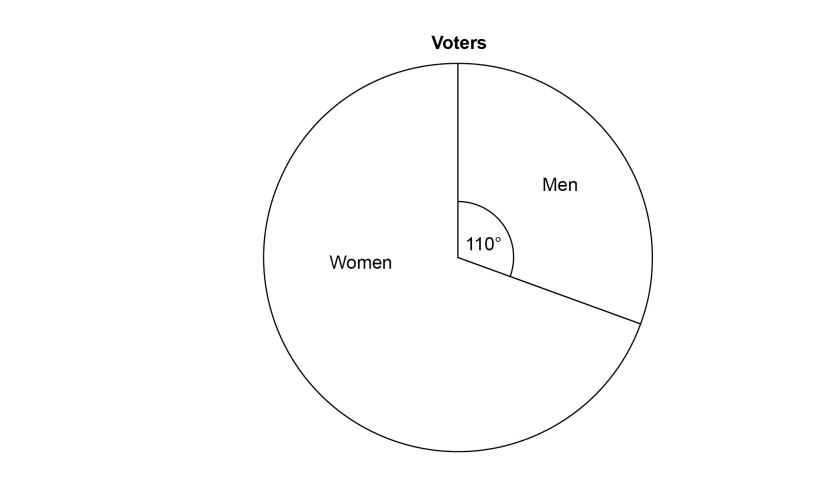
3360 more women voted than men. Work out the total number of voters.
The pie charts give information about the ages, in years, of people living in two towns, Adley and Bridford.
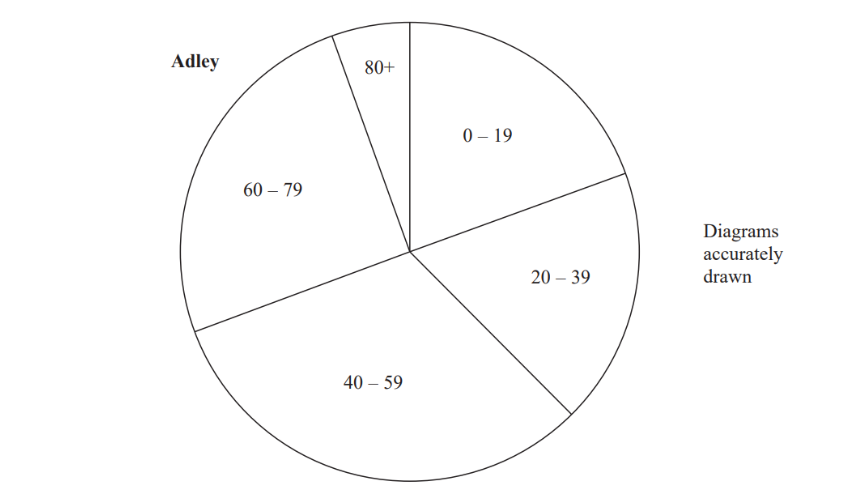
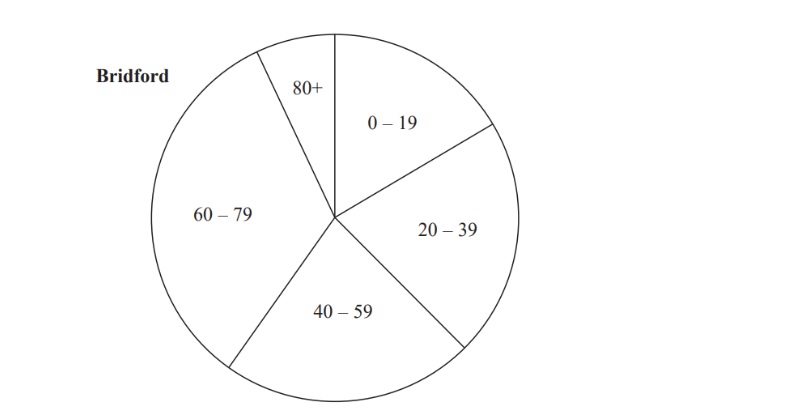
The ratio of the number of people living in Adley to the number of people living in Bridford is given by the ratio of the areas of the pie charts.
What proportion of the total number of people living in these two towns live in Adley and are aged 0 -19? Give your answer correct to 3 significant figures.