Pie Charts (Cambridge International IGCSE Maths)
Pie charts
What is a pie chart?
-
A pie chart is a circle divided into sectors which is used to present data
-
The sectors represent different categories
- They show the relative proportions of the categories
- They do not show the actual frequencies of each category
How do I draw a pie chart?
- This is easiest explained through an example
- The following data shows the favourite colours of a class of students
| Colour | Red | Purple | Blue | Green | Yellow | Orange |
|---|---|---|---|---|---|---|
| Students | 11 | 4 | 9 | 3 | 2 | 1 |
- Write the frequencies as fractions of the total number of students, 30
| Colour | Red | Purple | Blue | Green | Yellow | Orange |
|---|---|---|---|---|---|---|
| Students | 11 | 4 | 9 | 3 | 2 | 1 |
| Fractions |
-
Find the angles of the sectors by multiplying each fraction by 360°
- Then check all angles add up to 360°
| Colour | Red | Purple | Blue | Green | Yellow | Orange |
|---|---|---|---|---|---|---|
| Students | 11 | 4 | 9 | 3 | 2 | 1 |
| Fractions | ||||||
| Angles | 132° | 48° | 108° | 36° | 24° | 12° |
-
Draw a vertical line from the circle's centre to the top, then use a protractor to mark off the first angle
-
Draw a line from the centre to this first mark
- Then, from this line, mark off the next angle (and so on)
-
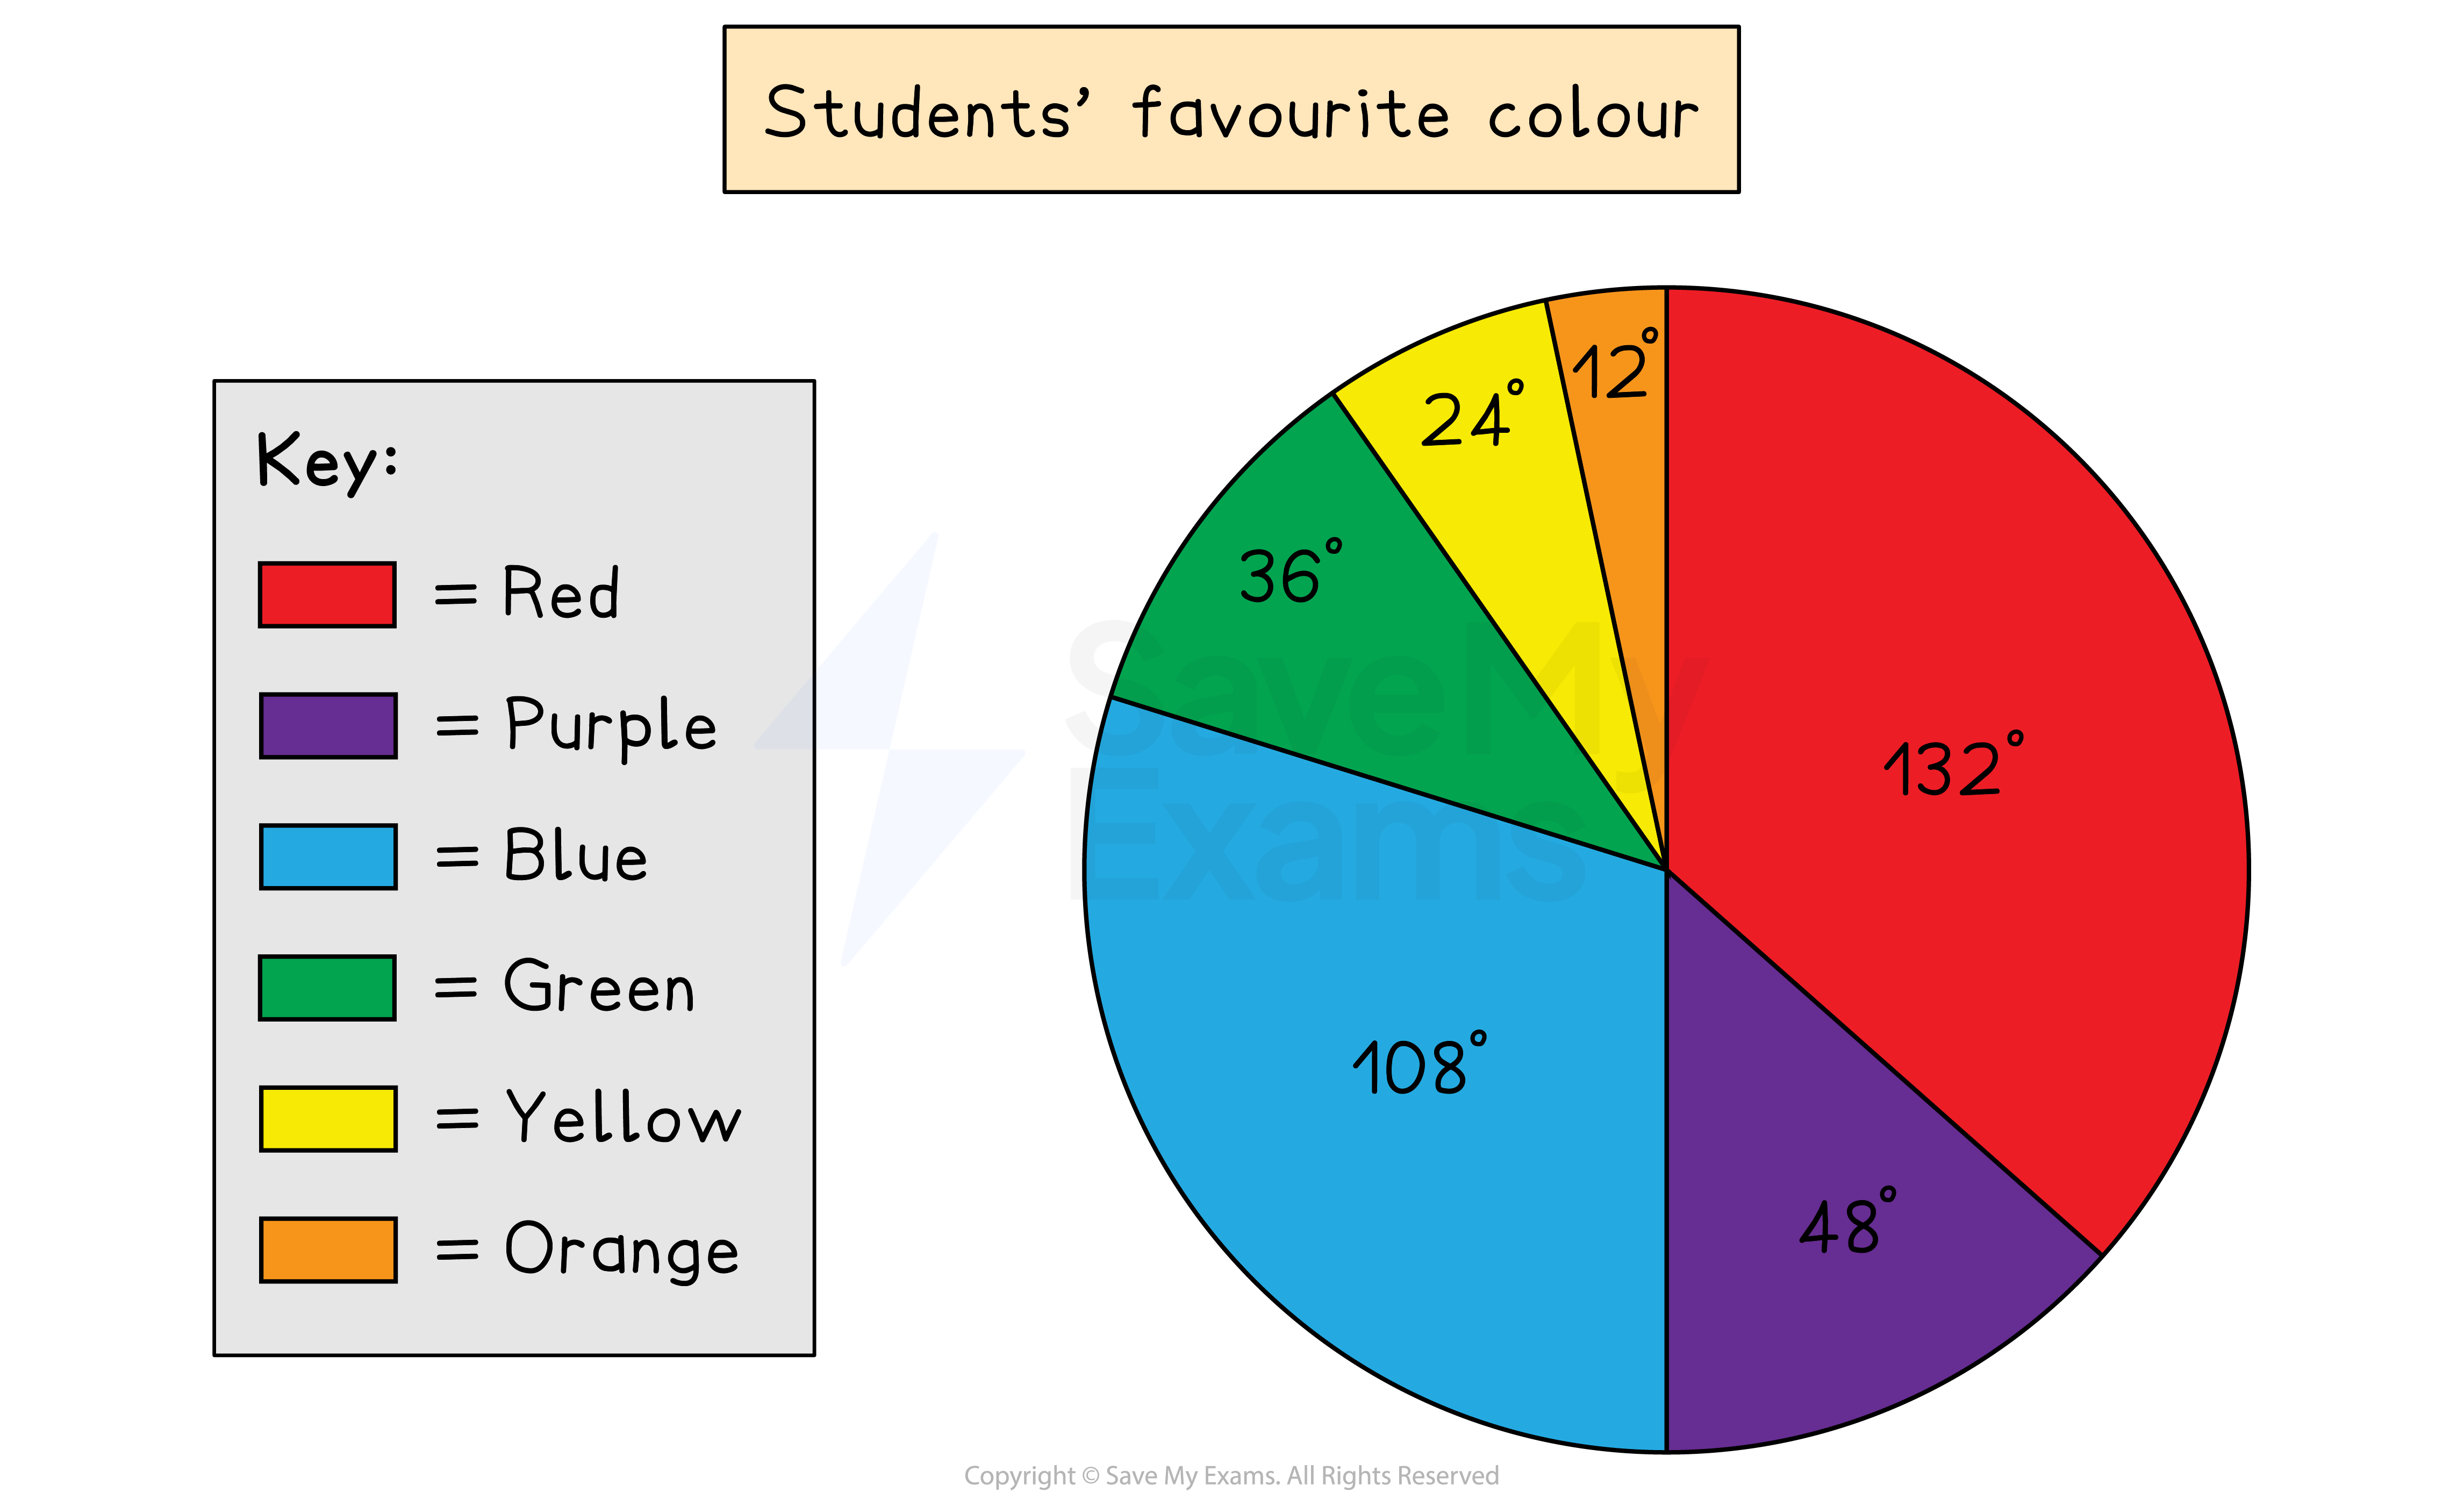
Example of a pie chart
How do I solve problems with pie charts?
-
Use the following facts
- angles are proportional to the frequencies of each category
- 360° represents the total frequency
-
For harder problems, it helps to work out
- what frequency is represented by 1°
- what angle is represented by 1 unit of frequency
-
For example, if a sector of 30° represents 15 people, then
- 1° = 0.5 people (dividing by 30)
- 2° = 1 person (multiplying by 2)
-
These relationships can then be scaled up or down accordingly
-
If 1° = 0.5 people
- then 360° = 180 people (multiplying by 360)
-
Exam Hint If the pie chart says 'not to scale', then examiners want you to use ratio and proportion methods to answer the questions. Don't measure angles using a protractor!
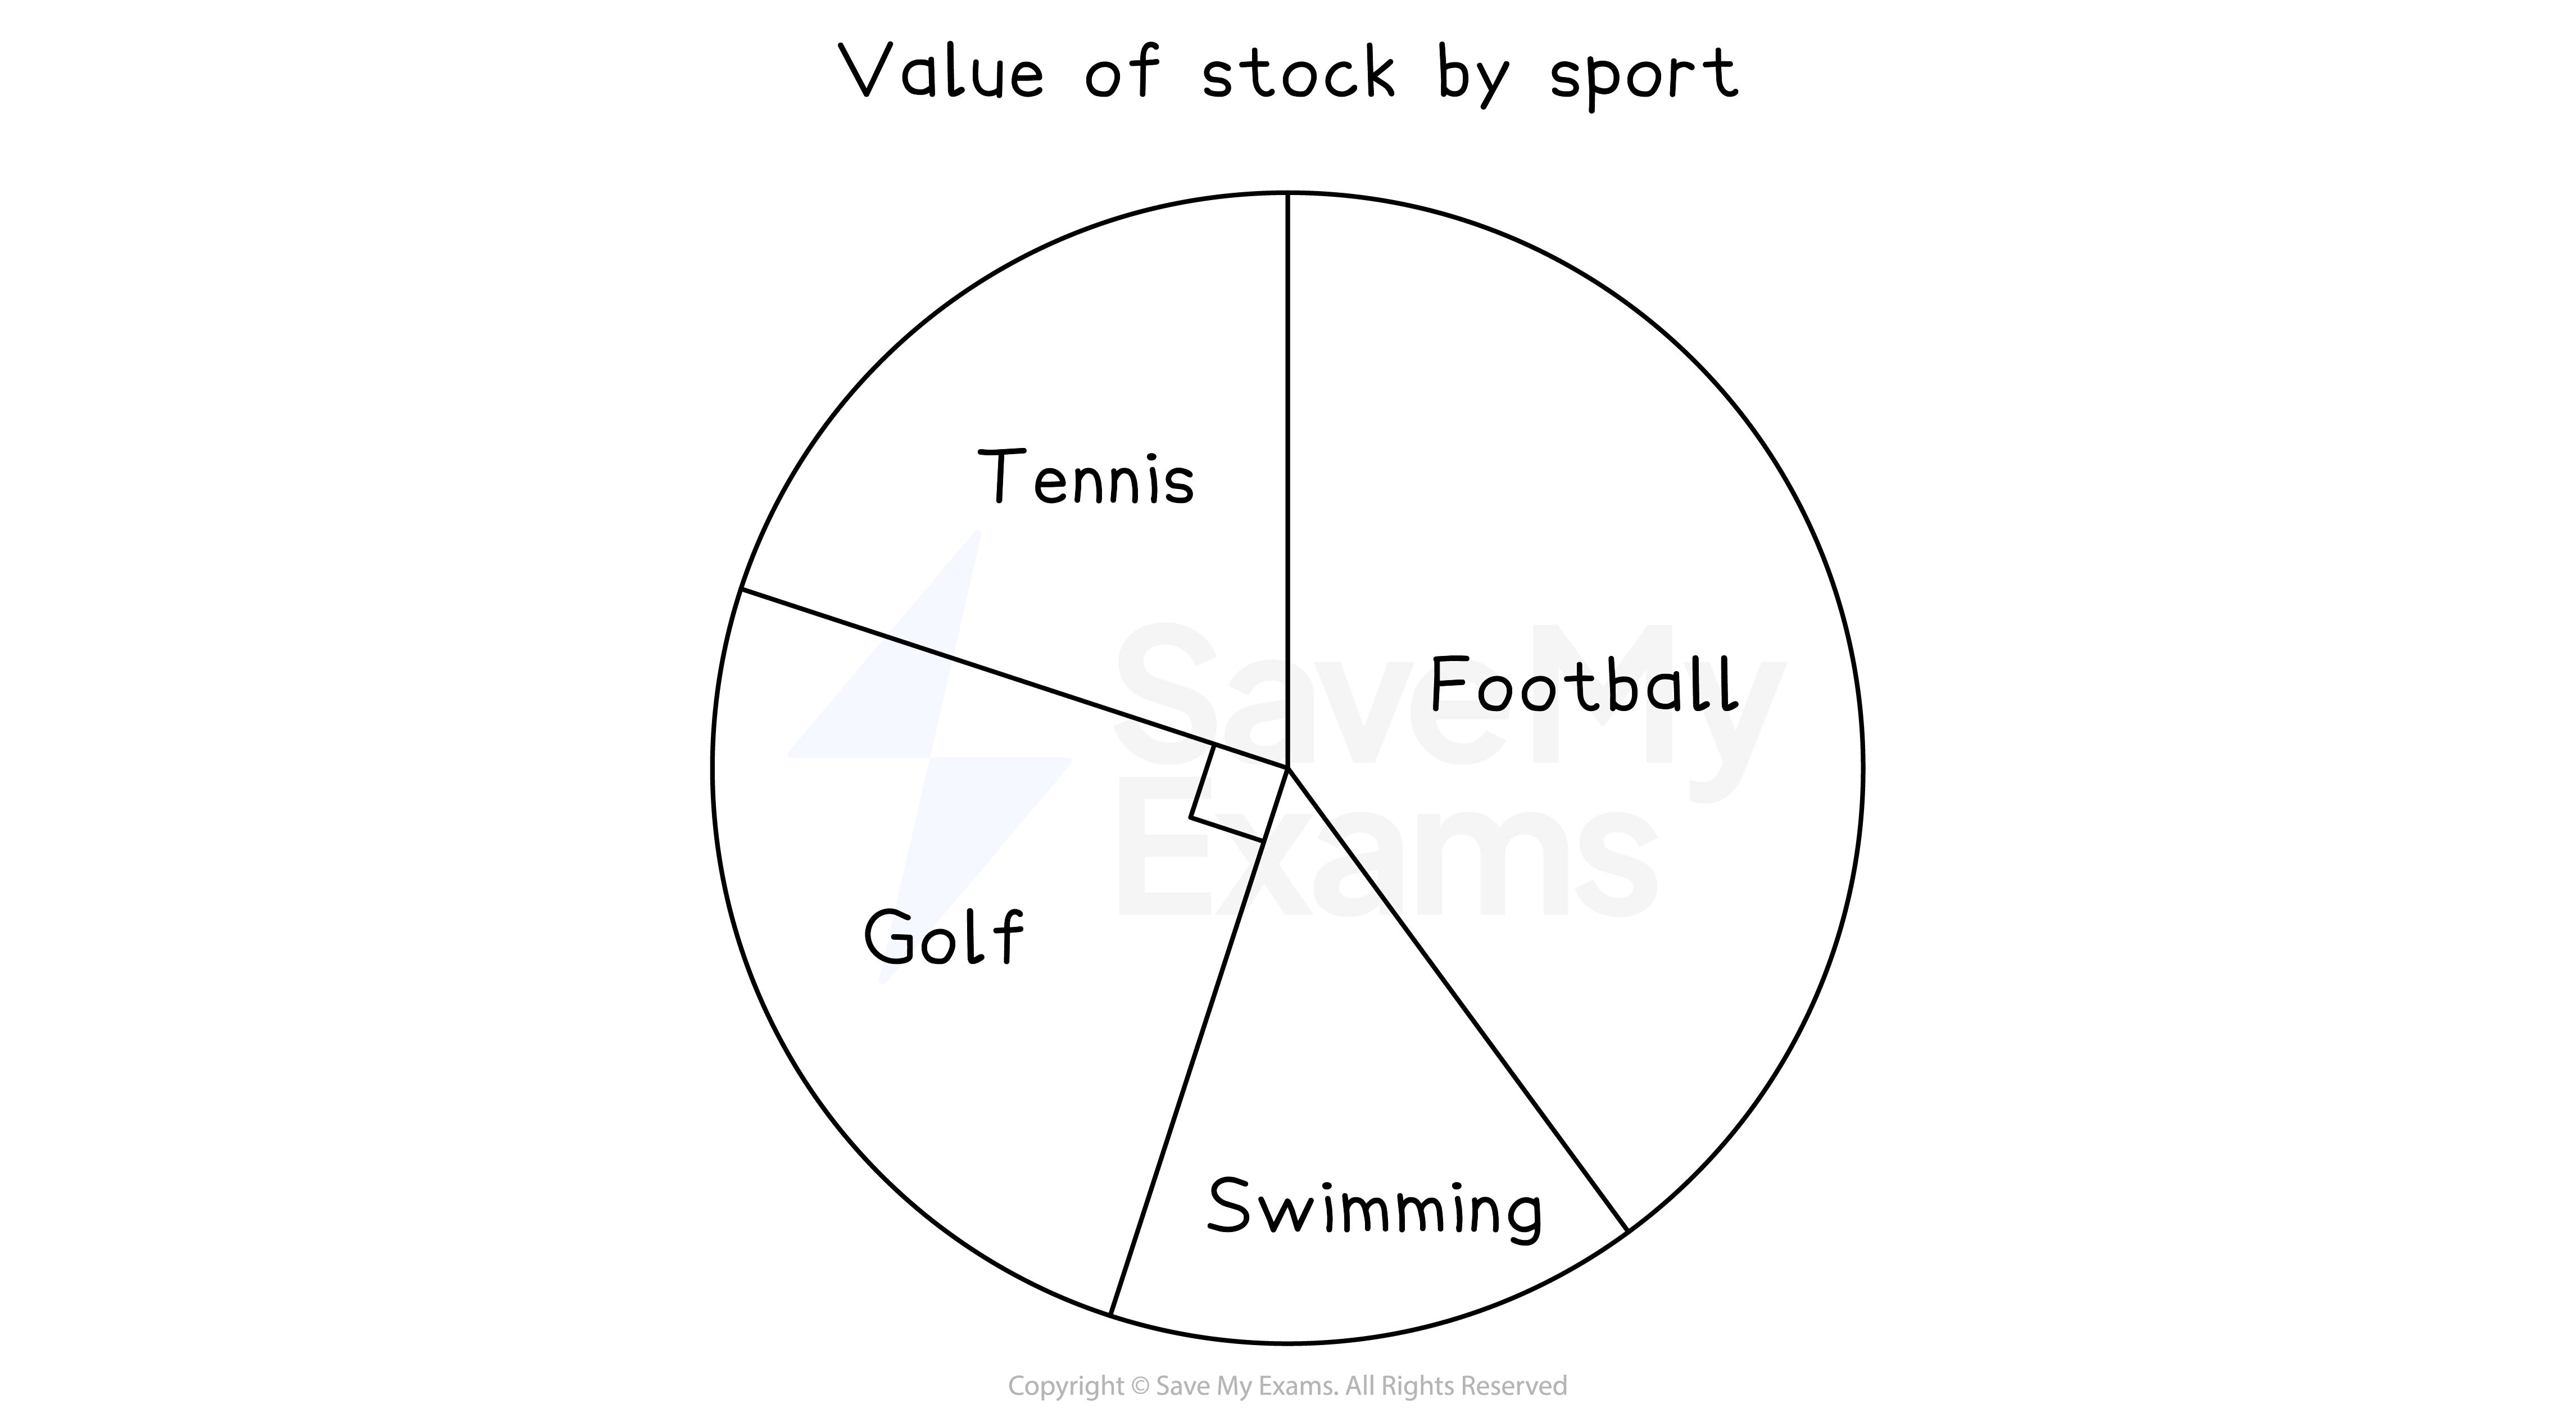
Worked Example The following pie chart represents the values of items stocked in a sports shop.
The diagram is not to scale.
(a) Given that the shop stocks £12 000 of golf items, find the total value of the shop’s stock.
Answer:
Find a relationship between an angle and a value
90° = £12 000
The total value is represented by 360° Multiply by 4 to get from 90° to 360°
360° = 4 ×12 000
Final answer: Total value is £48 000
You can also do this question by finding 1° first
(b) If the angle on the pie chart for tennis is 72°, find the value of tennis items that are stocked by the shop.
Answer:
It is quickest to find the fraction of the total value, found in part (a)
Final answer: The value of tennis items is £9 600
Was this revision note helpful?