Lines of Best Fit (Cambridge International IGCSE Mathematics)
Line of Best Fit
What is a line of best fit?
-
If a scatter graph suggests that there is a positive or negative correlation
-
a line of best fit can be drawn on the scatter graph
- This can then be used to make predictions
-
How do I draw a line of best fit?
-
A line of best fit is drawn on by eye
- It is a single-ruled straight line
- It must extend across the **full **data set
- It does not need to pass through any particular point(s)
- There should roughly be as many points on** either side** of the line (along its whole length)
-
If there is one extreme value (outlier) that does not fit the general pattern
- then ignore this point when drawing a line of best fit
How do I use a line of best fit?
-
Once the line of best fit is drawn, you can use it to predict values
-
E.g. to estimate y when x = 5
- Use the line to read off the y value when x is 5
-
-
It is best to use your line to predict values that lie within the region covered by the data points
- This is called interpolation
-
Be careful: if you extend your line too far away from the data points and try to predict values, those parts of the line are unreliable!
- This is called extrapolation
Exam Hint Sliding a ruler around a scatter graph can help to find the right position for the line of best fit! It is best to use a transparent ruler so that you can see all the points.
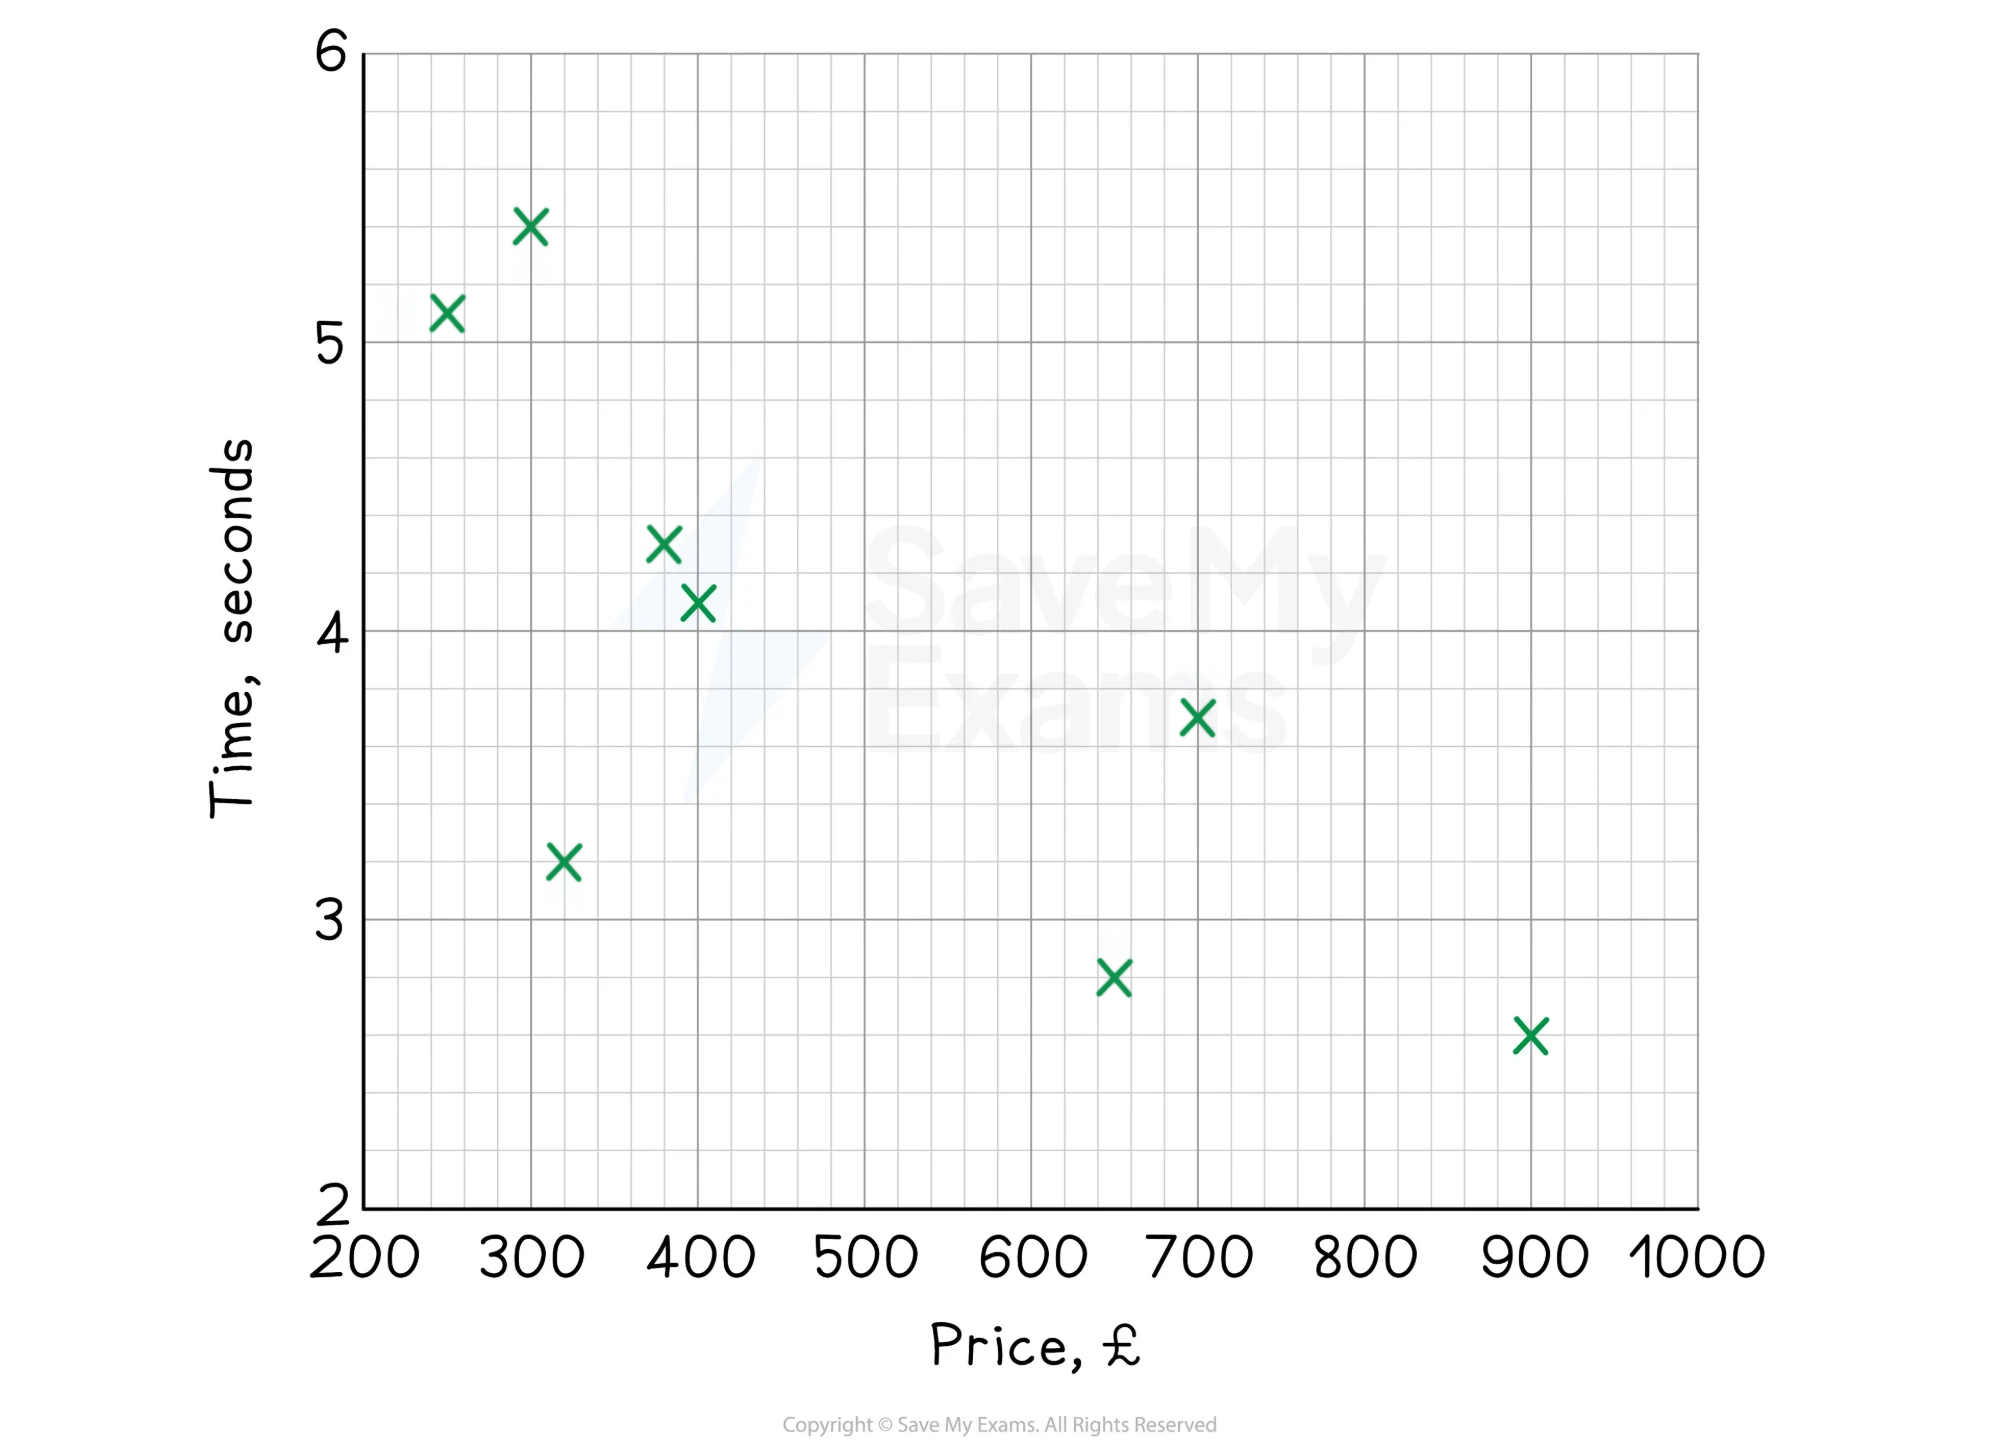
Worked Example Sophie wants to know if the price of a computer is related to the speed of the computer. She tests 8 computers by running the same program on each, measuring how many seconds it takes to finish. Sophie's results are shown in the table below.
Price (£) 320 300 400 650 250 380 900 700 Time (secs) 3.2 5.4 4.1 2.8 5.1 4.3 2.6 3.7 (a) Draw a scatter diagram, showing the results on the axes below.
Answer:
Plot each point carefully using crosses
(b) Write down the type of correlation shown and use it to form a suitable conclusion.
Answer:
The shape formed by the points goes from top left to bottom right (a negative gradient) This is a negative correlation As one quantity increases (price), the other decreases (time)
Final answer: The graph shows a negative correlation This means that the more a computer costs, the quicker it is at running the program
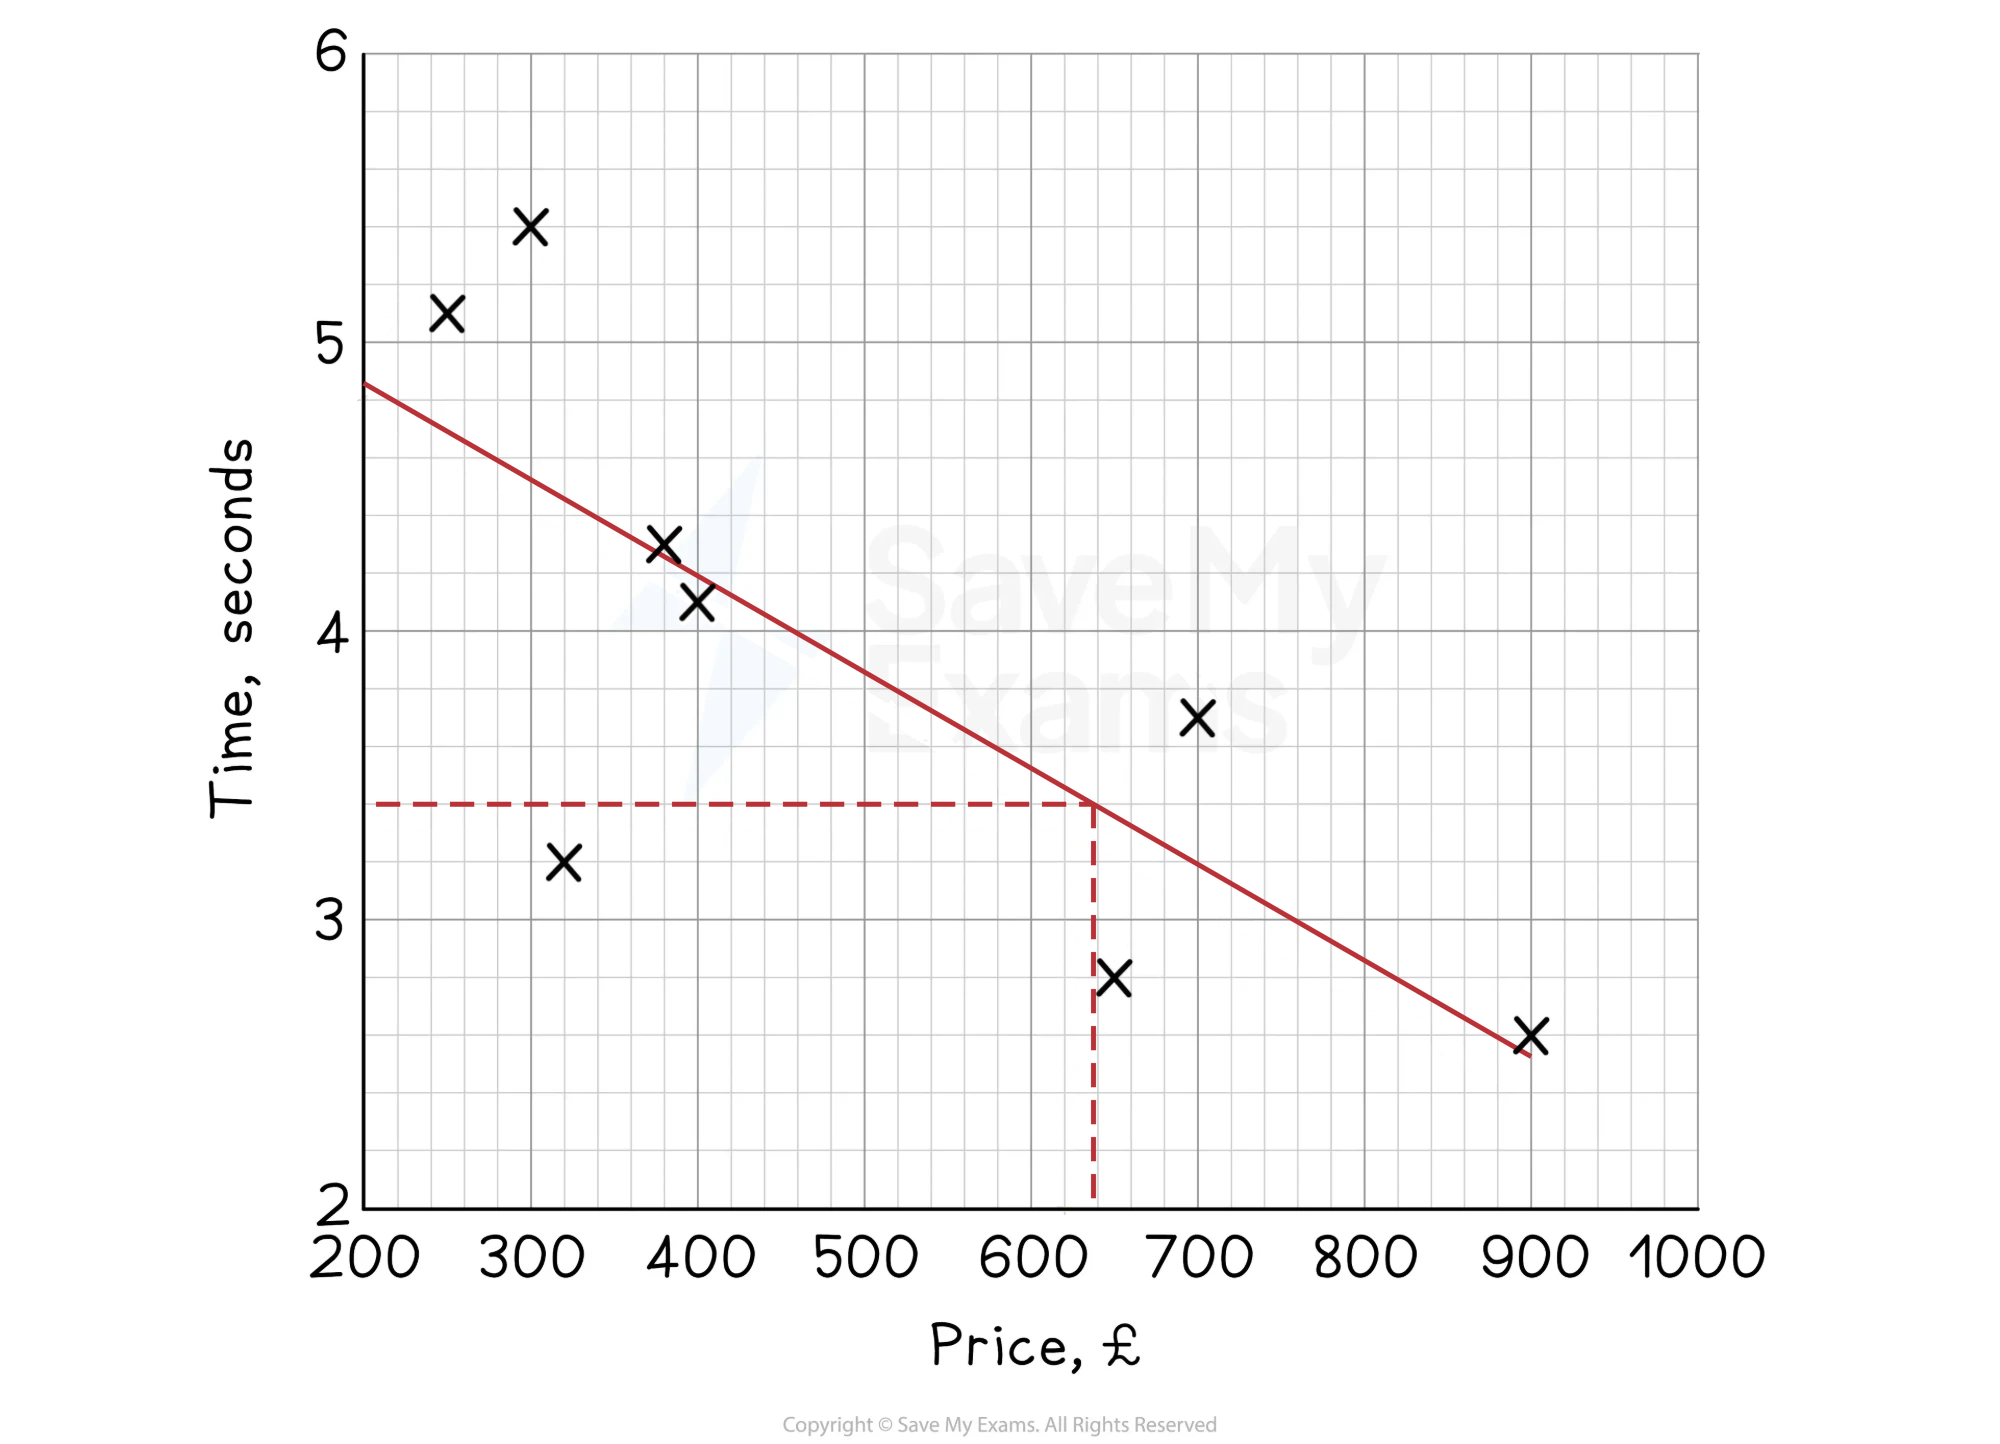
(c) Use a line of best fit to estimate the price of a computer that completes the task in 3.4 seconds.
Answer:
First draw a line of best fit, by eye Then draw a horizontal line from 3.4 seconds to the line of best fit Draw a vertical line down to read off the price
Final answer: A computer that takes 3.4 seconds to run the program should cost around £640
Was this revision note helpful?