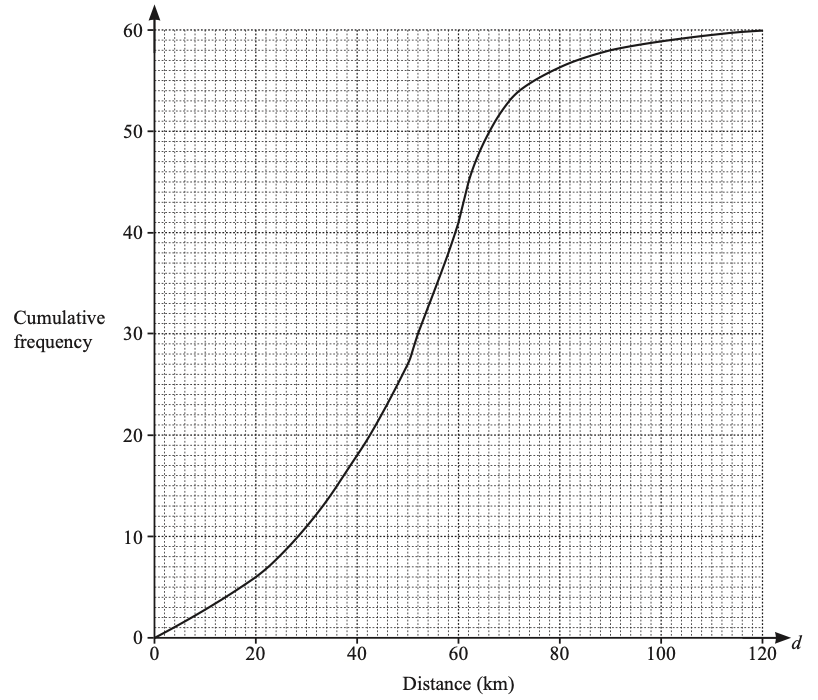
Sue works for a company that delivers parcels.
One day the company delivered parcels. The table shows information about the weights, in kg, of these parcels.
| Weight (kg) | Frequency |
|---|---|
0 less than w less-than or slanted equal to 1 | |
1 less than w less-than or slanted equal to 2 | |
2 less than w less-than or slanted equal to 3 | |
3 less than w less-than or slanted equal to 4 | |
4 less than w less-than or slanted equal to 5 | |
5 less than w less-than or slanted equal to 6 |
Complete the cumulative frequency table.
| Weight (kg) | Cumulative frequency |
|---|---|
0 less than w less-than or slanted equal to 1 | |
0 less than w less-than or slanted equal to 2 | |
0 less than w less-than or slanted equal to 3 | |
0 less than w less-than or slanted equal to 4 | |
0 less than w less-than or slanted equal to 5 | |
0 less than w less-than or slanted equal to 6 |
Extract:
| Weight ( w kg) | Frequency | | 0 < w ≤ 1 | 19 | | 1 < w ≤ 2 | 17 | | 2 < w ≤ 3 | 15 | | 3 < w ≤ 4 | 12 | | 4 < w ≤ 5 | 10 | | 5 < w ≤ 6 | 7 |
Complete the cumulative frequency table.
| Weight ( w kg) | Cumulative frequency | | 0 < w ≤ 1 | | | 0 < w ≤ 2 | | | 0 < w ≤ 3 | | | 0 < w ≤ 4 | | | 0 < w ≤ 5 | | | 0 < w ≤ 6 | |
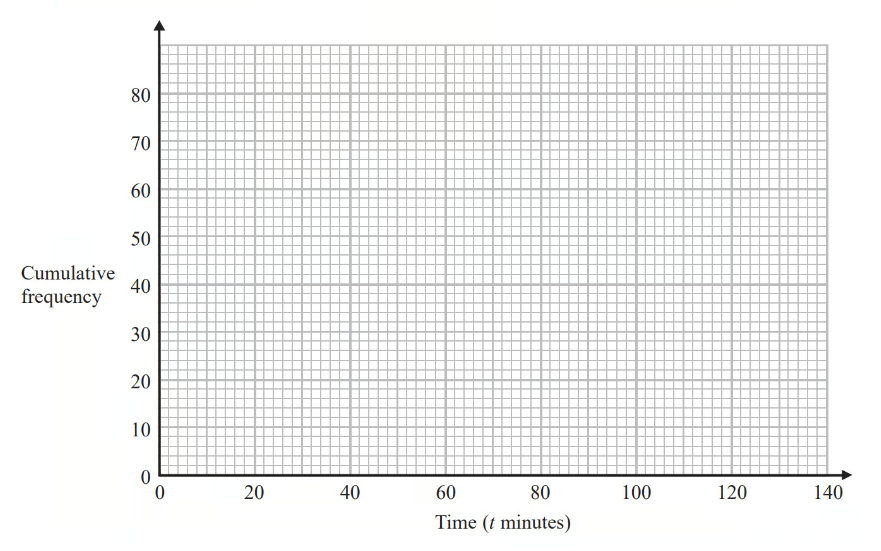
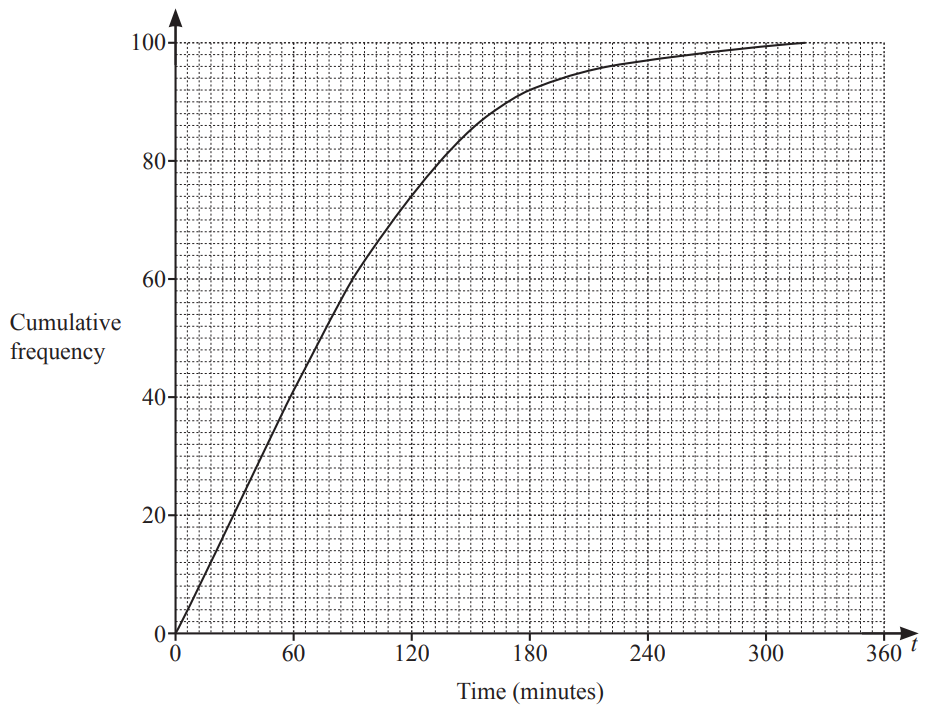
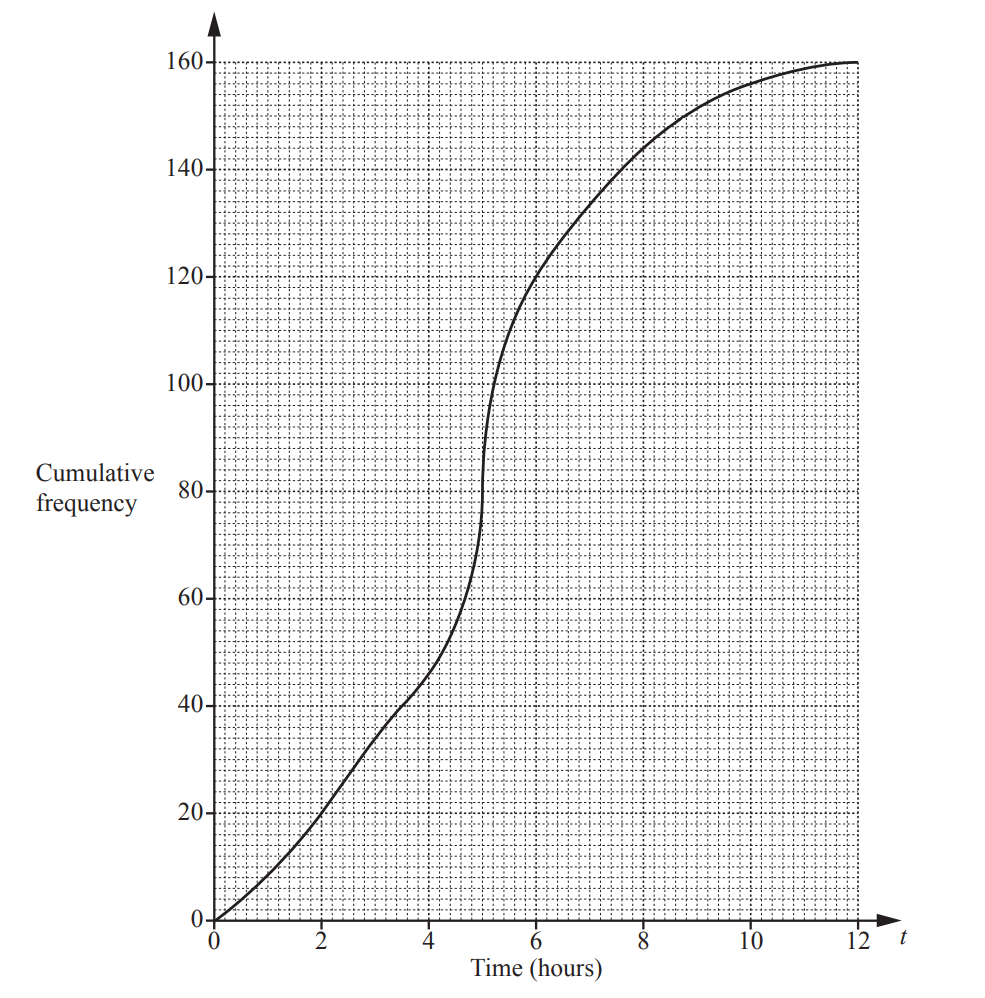
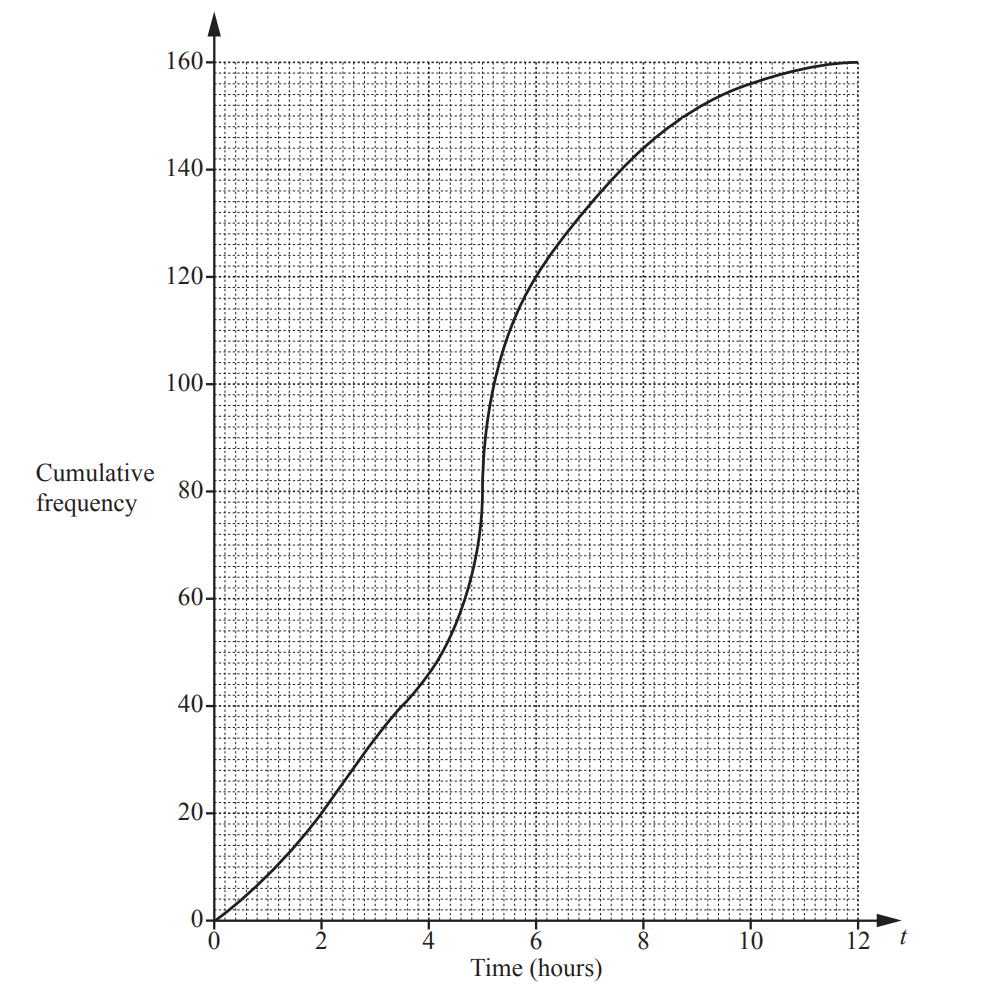
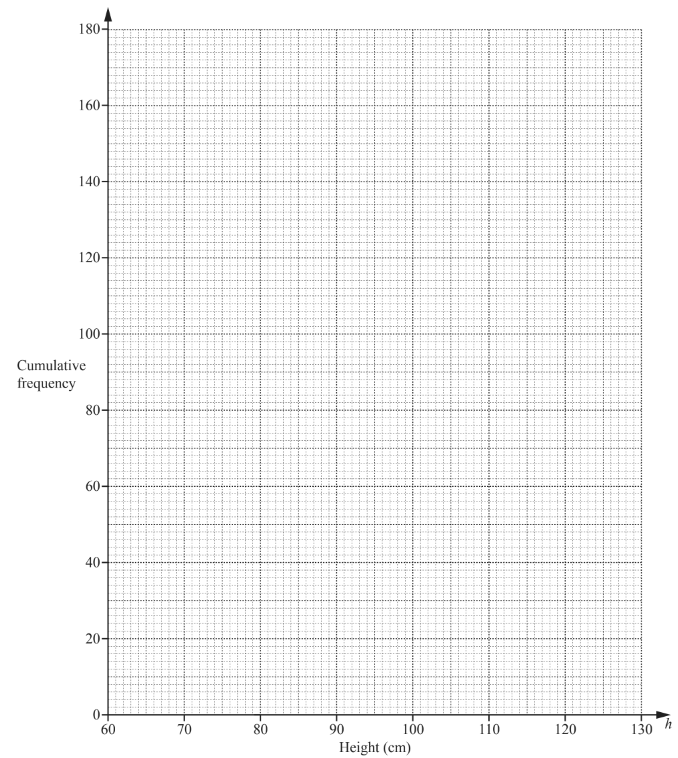
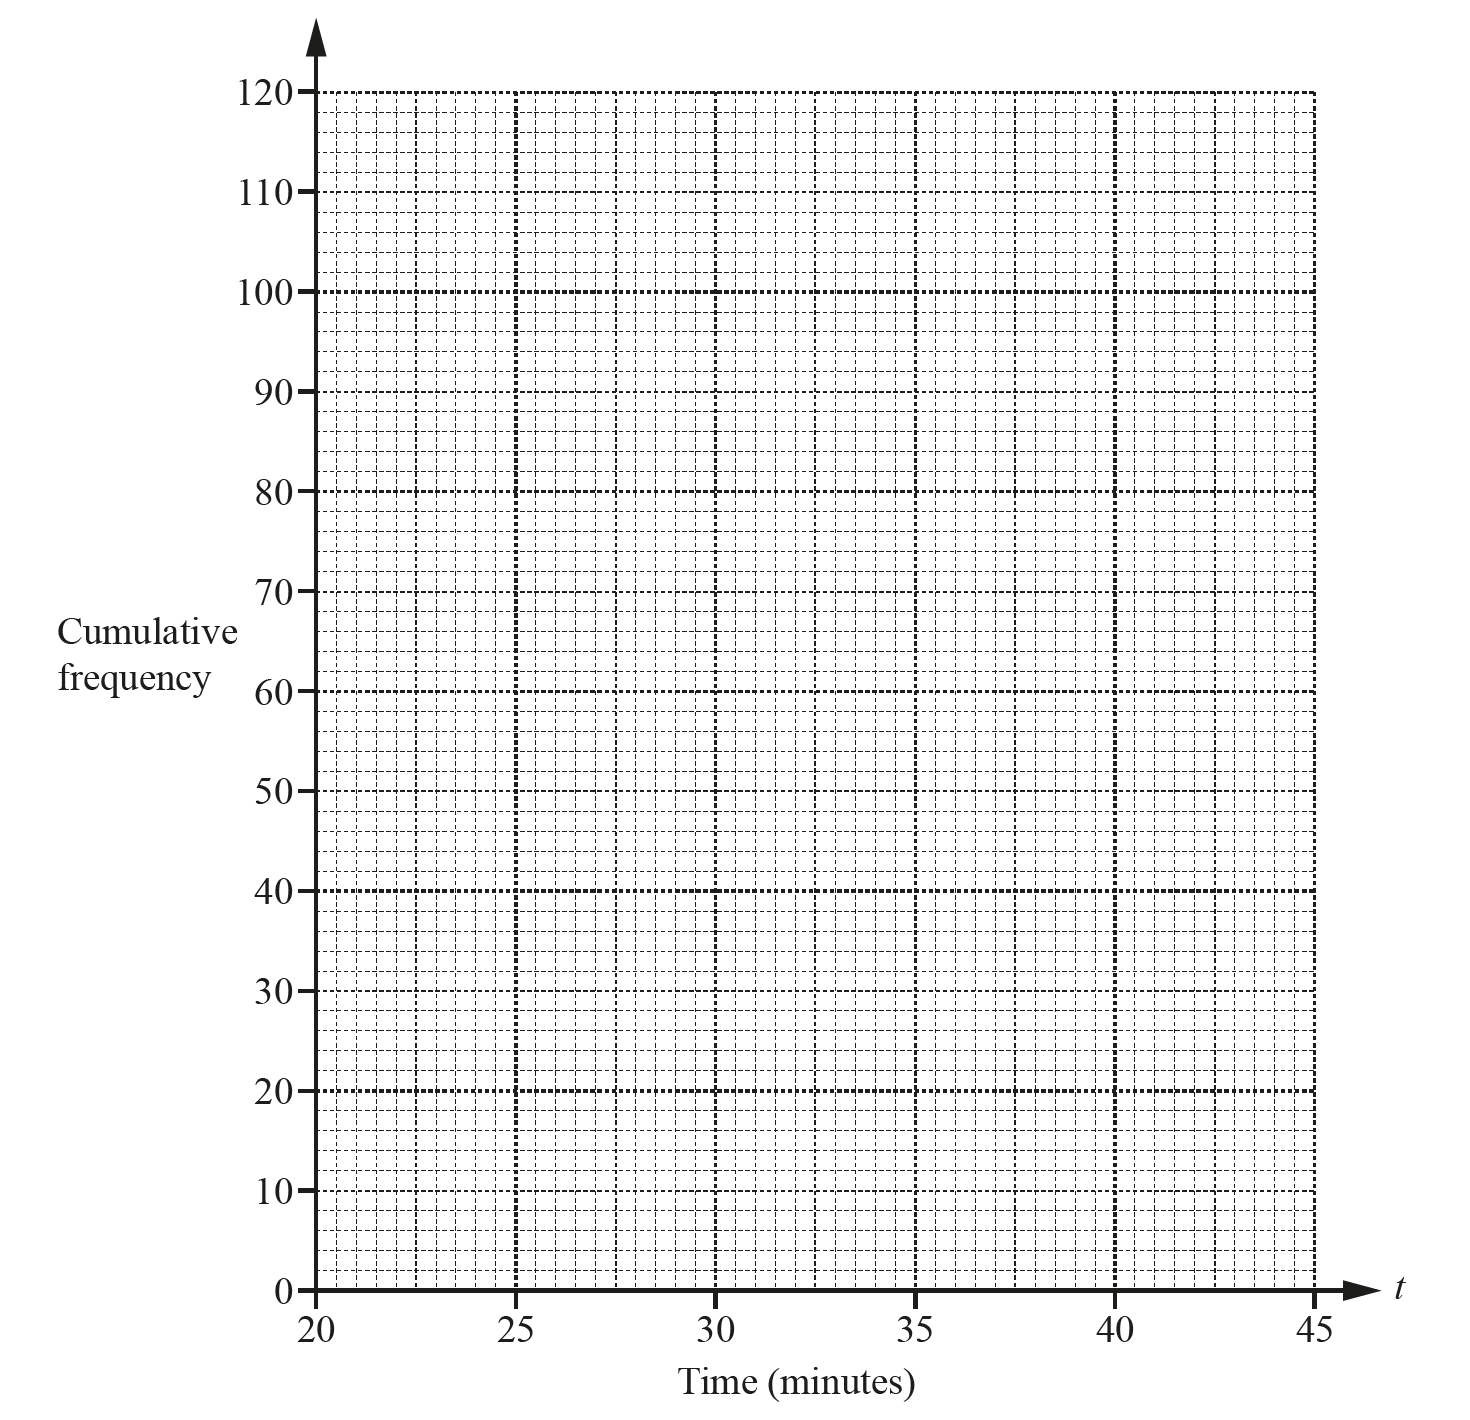
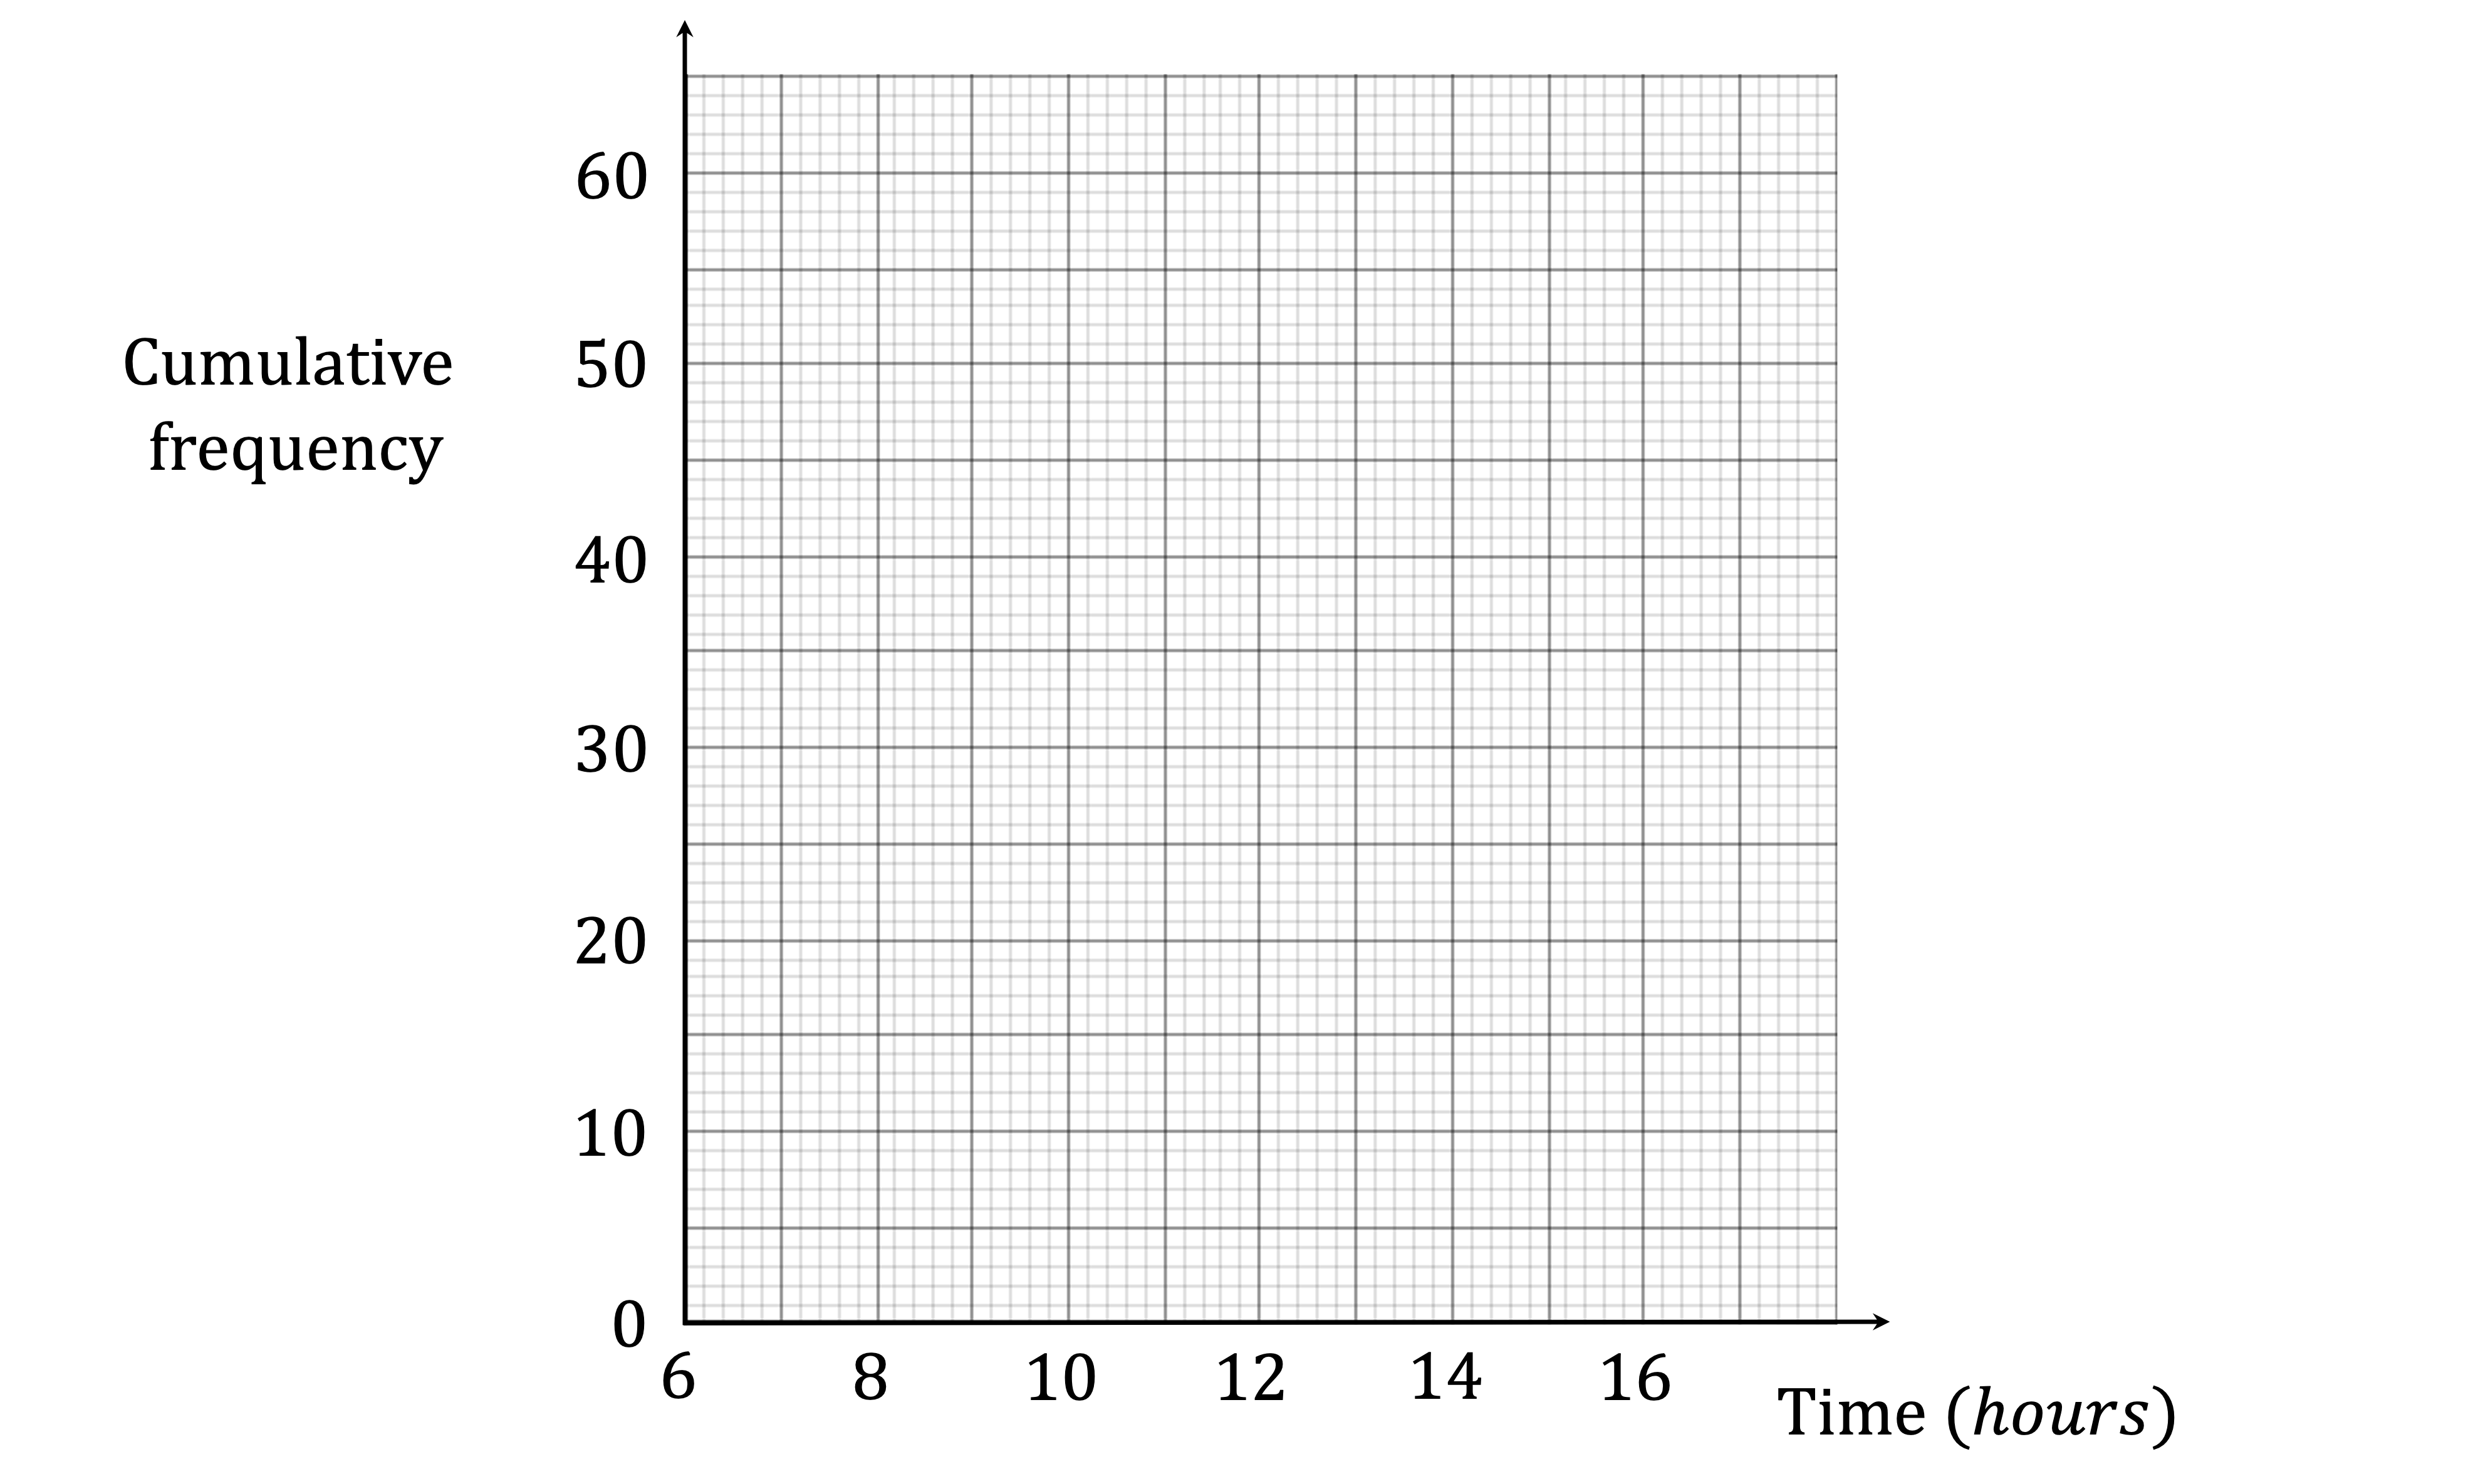
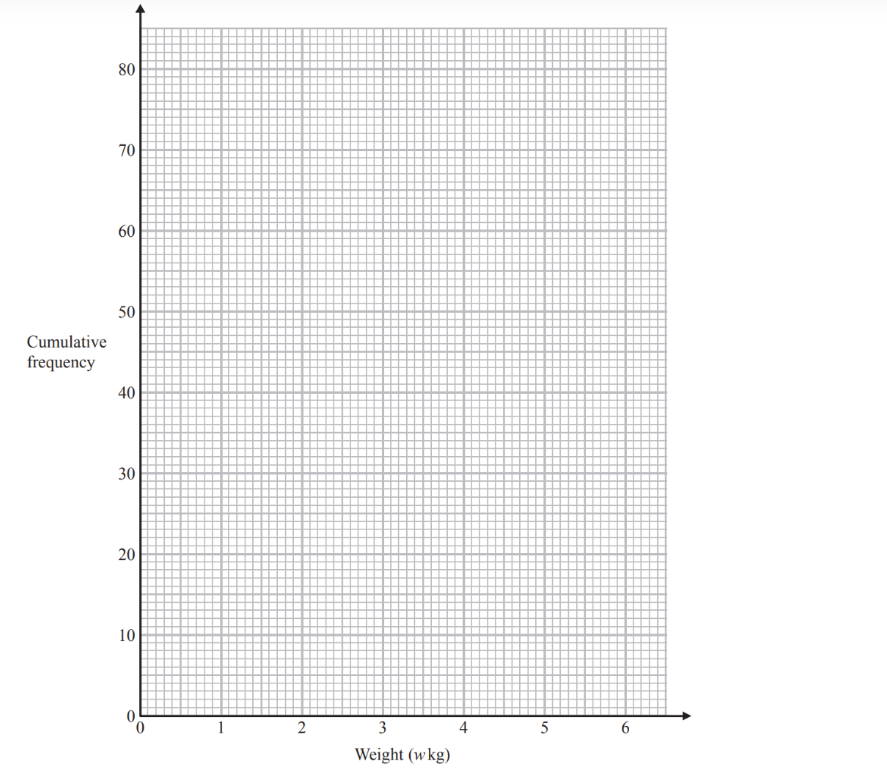
On the grid opposite, draw a cumulative frequency graph for your table.
Extract:
The table shows information about the weights, in kg, of these parcels.
| Weight ( w kg) | Frequency | | 0 < w ≤ 1 | 19 | | 1 < w ≤ 2 | 17 | | 2 < w ≤ 3 | 15 | | 3 < w ≤ 4 | 12 | | 4 < w ≤ 5 | 10 | | 5 < w ≤ 6 | 7 | Complete the cumulative frequency table.
| Weight ( w kg) | Cumulative frequency | | 0 < w ≤ 1 | | | 0 < w ≤ 2 | | | 0 < w ≤ 3 | | | 0 < w ≤ 4 | | | 0 < w ≤ 5 | | | 0 < w ≤ 6 | |
Sue says,
" % of the parcels weigh less than kg."
Is Sue correct? You must show how you get your answer.