Population Structure by Income Groups (Cambridge International IGCSE Environmental Management)
Income groups
- Countries around the world are at very different stages of economic development
- To help compare economies fairly, the World Bank groups countries based on their income per person
- These income levels strongly influence population structure, including birth rates, life expectancy and age distribution
- By comparing an LIC and an HIC, clear patterns can be seen
Low-income countries (LICs)
-
Low-income countries have the lowest average income per person
- $2.87 per day or $1,045 or less per annum
-
Many people live close to or below the poverty line
-
Economies are often based on agriculture and low-paid primary industries
-
Access to healthcare, education and clean water may be limited
-
Birth rates are usually high and life expectancy is often lower
-
Examples include Chad, Ethiopia, Burundi, Mali, Niger, Somalia, and Yemen
Middle-income countries (MICs)
-
Middle-income countries have moderate average incomes per person
- Approximately $10.01–$20 per day or $3,654 to $7,300 per annum
-
The World Bank (WB) splits this group into lower-middle and upper-middle
-
Many are experiencing rapid industrialisation and urban growth, but still face inequality
- A phenomenon known as the middle-income trap, where a country stagnates after rapid growth and cannot transition into a high-income economy due to rising wages and a lack of innovation
-
Living standards are improving, but income inequality may still be high
-
Healthcare and education are more widely available than in LICs
-
Birth rates are falling, but population growth often continues
-
Examples include India, Nigeria, Pakistan (lower-middle), China, Brazil, South Africa, Mexico, Indonesia, Russia (upper-middle)
High-income countries (HICs)
-
High-income countries have the highest average income per person
- $20+ a day
-
Most people have a high standard of living
-
Economies are dominated by tertiary and quaternary industries
-
Healthcare, education and infrastructure are well developed
-
Birth rates are low and life expectancy is high
-
Examples include USA, Germany, Japan, UK, Canada, Australia, Singapore, and Switzerland
Population structure of HICs and LICs
- Population structure varies greatly between countries at different stages of economic development
- By comparing Nepal, a low-income country, with the USA, a high-income country, clear contrasts can be seen in age structure, dependency and future population challenges
- These differences are best shown using population pyramids
Population structure of an LIC: Nepal
- Nepal has a mainly expansive population pyramid, although the base is beginning to narrow slightly
- The relatively wide base shows a moderately high birth rate, meaning many children are born each year
- A large proportion of the population is under 15, creating a high youth dependency ratio
- The pyramid narrows quickly with age, showing lower life expectancy compared to HICs
- Limited access to healthcare, lower incomes and rural living conditions reduce survival into old age
- This structure places pressure on education, healthcare and future employment opportunities
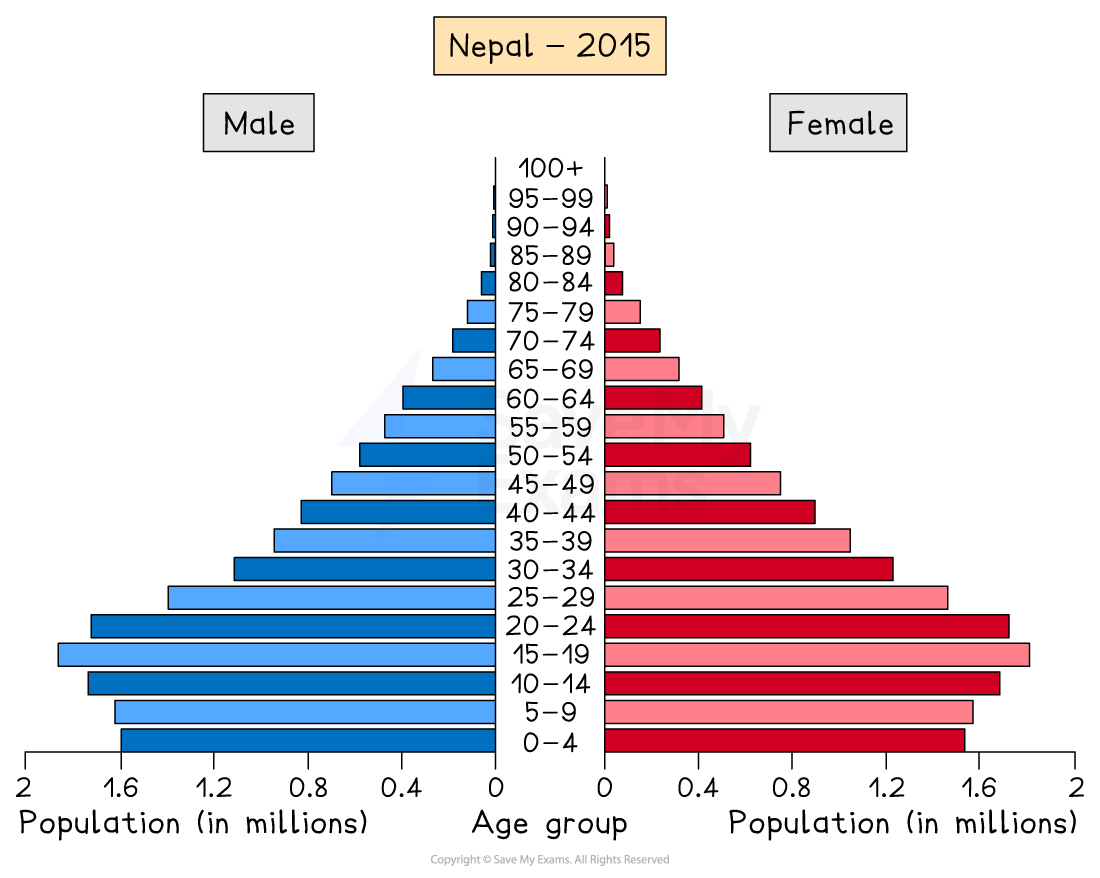
Expansive population pyramid
Population structure of an HIC: USA
- The USA has a stationary moving to a slightly constrictive population pyramid
- The narrower base shows lower birth rates, linked to family planning, higher living costs and female employment
- A large working-age population supports the economy
- Wider upper age groups show high life expectancy, due to advanced healthcare and nutrition
- An increasing elderly population raises the old-age dependency ratio
- This creates pressure on healthcare systems, pensions and social care services
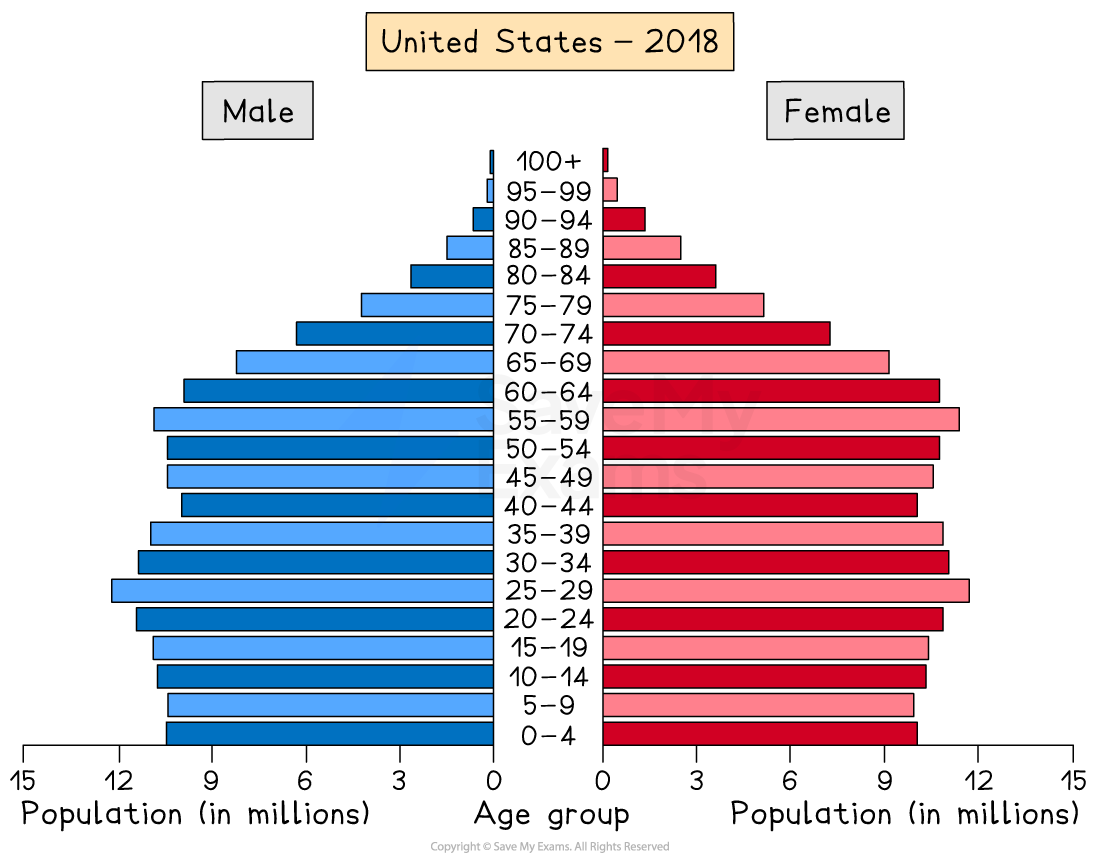
Stationary moving to constrictive population pyramid
Direct comparison of population structure
- Nepal has a younger population, while the USA has an ageing population
- Nepal faces challenges linked to providing schools, jobs and healthcare for a growing population
- The USA faces challenges linked to supporting an elderly population and maintaining a large workforce
- These contrasts reflect differences in income levels, healthcare access, education and economic development
Worked Example Compare the population structure of Nepal and the USA.
[6 marks]
Answer
Nepal has an expansive population pyramid [1] with a relatively wide base, showing a high proportion of young people. **[1] **This creates a high youth dependency ratio and pressure on education and future employment. [1] In contrast, the USA has a more stationary population pyramid with a narrower base, showing lower birth rates. [1] The wider upper age groups show high life expectancy and an ageing population. [1] As a result, Nepal faces challenges linked to population growth, while the USA faces challenges linked to supporting elderly dependants. [1]
Marking guidance
The command word ‘compare’ means the answer needs to identify both similarities and differences between two or more things.
Mark allocation
- Up to** 3 marks **for the accurate description of Nepal’s population structure.
- Up to** 2 marks** for the accurate description of the USA’s population structure.
- 1 mark for a clear comparison or consequence.
Examiner tips
- Always name the case study countries.
- Refer to specific features of the population pyramid.
- Make direct comparisons rather than writing two separate descriptions.
- Link population structure to real-life challenges.
Was this revision note helpful?