Individual & Market Supply (Cambridge International IGCSE Economics)
Defining supply
Spec point — "Definition of supply; The link between individual supply and market supply"
Defining supply
-
Supply is the amount of a good/service that a producer is willing and able to supply at a given price in a given time period
-
The law of supply states that there is a positive (direct) relationship between quantity supplied and price, ceteris paribus
- When the price rises, the quantity supplied rises
- When the price falls, the quantity supplied falls
Individual and market supply
-
Market supply is the combination of all the individual supply for a good/service
- It is calculated by adding up the individual supply at each price level
The monthly market supply of bread from 4 bakeries in a small town
| Bakery 1 | Bakery 2 | Bakery 3 | Bakery 4 | Market Supply |
|---|---|---|---|---|
| 300 | 600 | 180 | 320 | 1400 loaves |
Drawing and interpreting a supply diagram
Spec point — Drawing and interpreting a supply diagram
-
A supply curve is a graphical representation of the price and quantity supplied by producers
- If data were plotted, it would be an actual curve
- Economists, however, use straight lines to make analysis easier
-
The supply curve is sloping upward, as there is a positive relationship between the price and quantity supplied
- Rational profit maximising producers would want to supply more as prices increase in order to maximise their profits
-
Individual and market supply can also be represented graphically
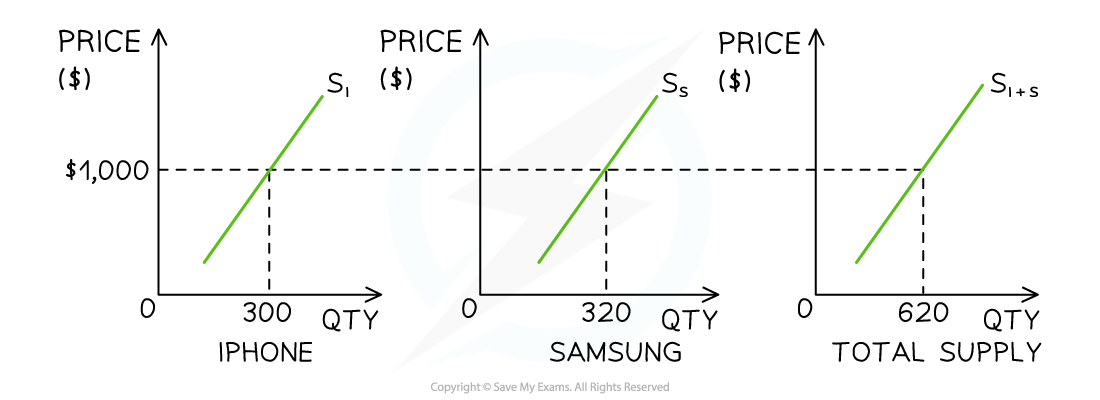
Market supply for smart phones in December is predominantly the combination of iPhone and Samsung supply
Diagram analysis
- In New York City, the market supply for smartphones in December is predominantly the combination of iPhone and Samsung supply
- At a price of $1000, the supply of iPhones is 300 units and the supply of Samsung phones is 320 units
- At a price of $1,000, the market supply of smartphones in New York City during December is 620 units
Was this revision note helpful?
Build on this topic