Analysis of Market Research Data (Cambridge International IGCSE Business)
Quantitative and qualitative data
-
Once market research data has been gathered, it need to be converted into a form which is easy to understand and capable of being used to support business decision-making
-
Quantitative data is statistical numeric data that can be used to support decision making
-
Quantitative data needs to be accurate and interpreted correctly if it is to be useful
-
It may be collected from primary or secondary sources
-
Sources of quantitative data include
- Financial reports
- Survey findings
- Marketing or sales data
- Statistical research from the government or research organisations
-
-
Qualitative research data often requires considerable skill and insight to be interpreted appropriately
- It involves comparing and drawing conclusions from opinions, insights, feelings and preferences
- It is mainly collected from primary sources such as focus groups, detailed surveys/interviews and test marketing
-
Both forms of data can help business managers forecast sales, identify trends and make decisions about product development, promotional planning, pricing tactics and other important marketing mix elements
Analysis of graphs and charts
-
Information presented in graphs and charts is often easy to understand because it is presented visually
-
Common methods of presenting data include:
- Tally charts
- Bar charts
- Pie graphs
- Scatter graphs
Tally charts
-
A table or tally chart, is a simple method used to record data in its original form
-
It is particularly useful for recording frequency of an event as it is happening
- E.g., It may be used to record the number of customers entering a retail store
-
Each time a particular event happens, a small vertical line is drawn
- Groups of five occurrences are recorded with a diagonal line **through four vertical lines **
- These groups of five can be easily** totalled to identify frequency**
-
-
In many cases, tally chart data is converted into a chart or graph to make it more visually appealing
Worked Example Susie asks her friends to select their favourite type of pet.
Dog Cat Dog Dog Dog Rabbit Dog Rabbit Cat Cat Cat Dog Dog Rabbit Dog Cat Cat Dog Dog Dog Represent the data in a frequency table. You can use a tally chart to help
Step 1: Draw a table with a tally and frequency column with types of pet as row headers
Type of pet Tally Frequency Dog Cat Rabbit Step 2: Tally the data
Type of pet Tally Frequency Dog Cat Rabbit Step 3: Total the tally data and add to the frequency column
Type of pet Tally Frequency Dog 11 Cat 6 Rabbit 3



Bar charts
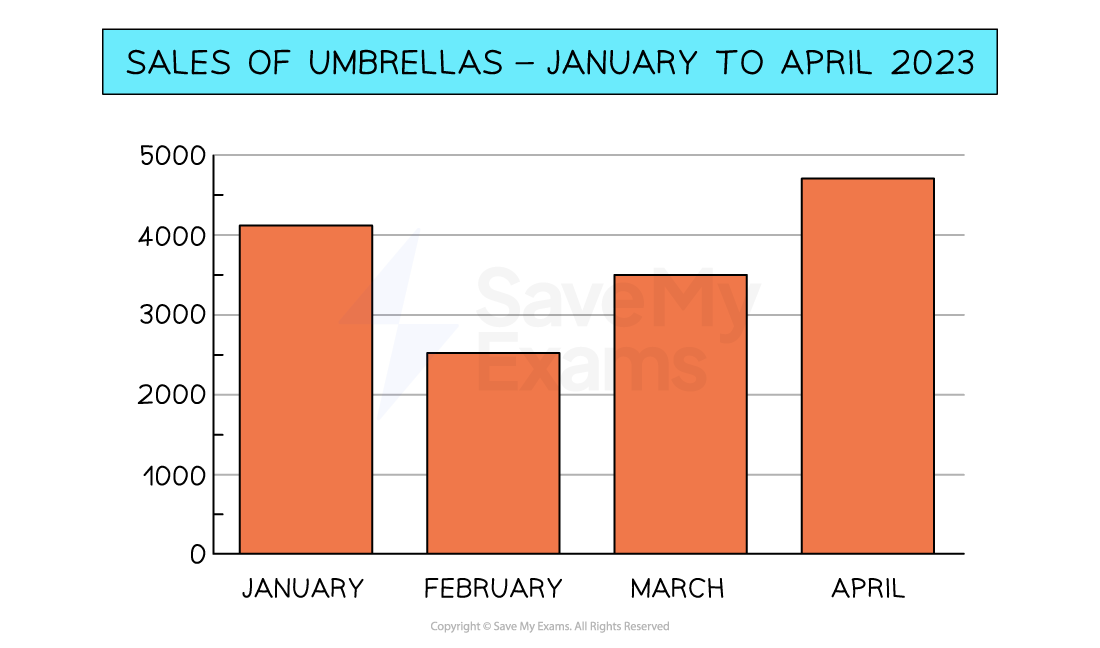
- This bar graph provides a clear picture of umbrella sales between January and April and allows a manager to compare sales month by month
Pie charts
- This pie chart breaks down all umbrella sales into those achieved by different models
- It shows that more than half of sales were 'Ultra' umbrellas
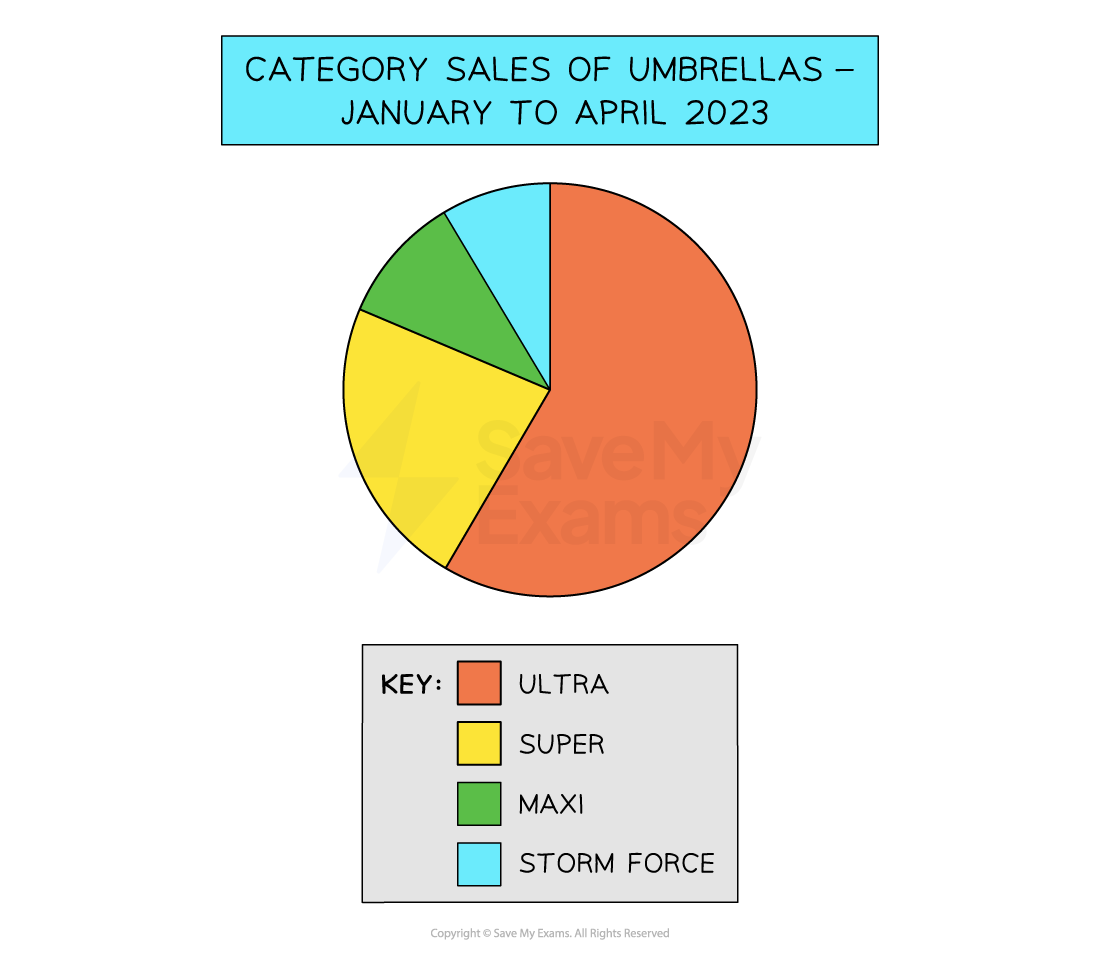
Pie chart showing the sales of umbrellas over four months
Exam Hint Practise calculations such as percentages and averages – errors in simple maths can cost easy marks, so always double-check your working and units
Scatter graphs
-
Scatter graphs allow relationships between two variables to be identified
-
The scatter graph below shows that there is a positive correlation between temperature and sales of barbecues
- As the temperature increases, sales of barbecues increase
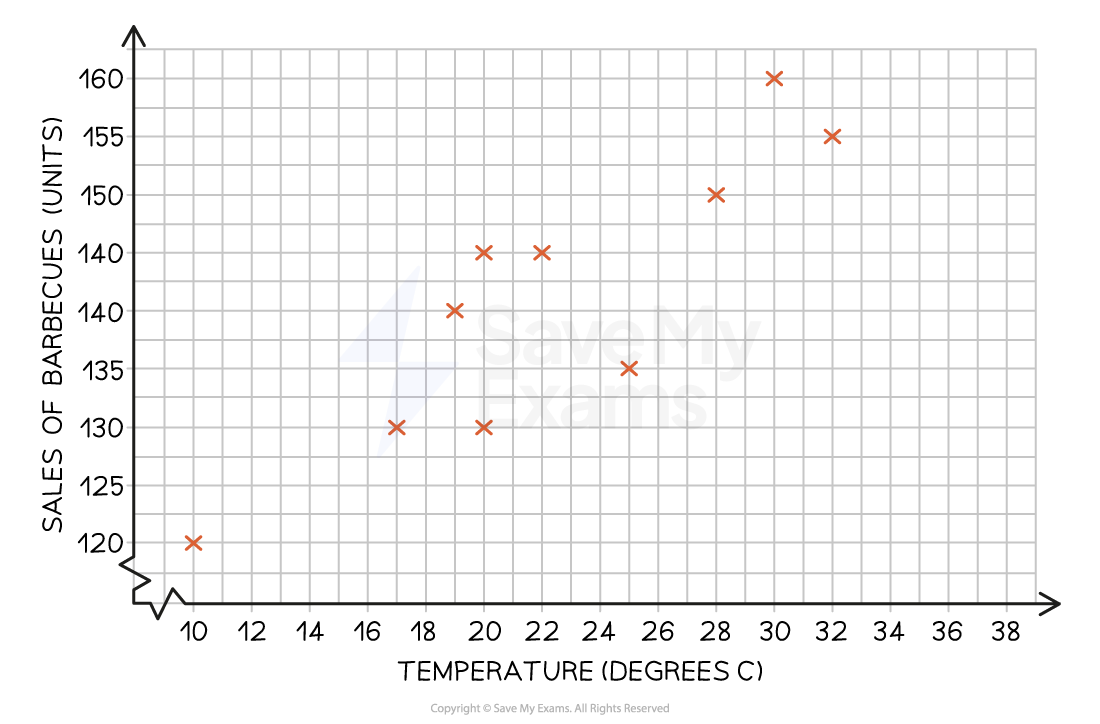
A scatter graph showing the correlation between the temperature and the sale of umbrellas
- A line of best fit allows known data to be extrapolated to identify likely sales of barbecues at other temperatures
Scatter graph showing a line of best fit
Was this revision note helpful?
Build on this topic