A student investigated the effect of the concentration of sugar solutions on osmosis in potato cells.
Step 1 The student labelled four test-tubes A, B, C and D.
Step 2 The volumes of 1 mol per dm3 sugar solution and distilled water shown in Table 1.1 were used to make solutions containing different concentrations of sugar in each test-tube.
(i) Complete Table 1.1 by writing in the concentration of the sugar solution in test-tube C.
Table 1.1
| test-tube | volume of 1mol per dm3 sugar solution/cm3 | volume of distilled water / cm3 | concentration of sugar solution/mol per dm3 |
|---|
| A | 20 | 0 | 1.0 |
| B | 12 | 8 | 0.6 |
| C | 8 | 12 | |
| D | 0 | 20 | 0.0 |
Step 3 The student was given four potato cylinders which had all been cut from one potato. The diameters of the potato cylinders were all the same but the lengths of the potato cylinders varied.
Step 4 The student cut all four potato cylinders to exactly 40mm in length.
Step 5 One potato cylinder was put into each labelled test-tube. The potato
cylinders were left in the sugar solutions for 20 minutes.
Step 6 After 20 minutes the potato cylinders were removed from the test tubes.
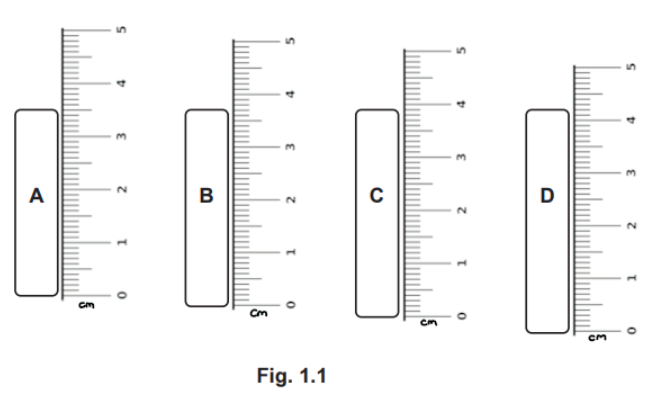
Fig. 1.1 is a diagram showing the actual size of the potato cylinders from test-tubes A, B, C and D at the end of step 6.
(ii) Prepare a table to record the results in the space provided.
Measure the length of each of the potato cylinders in Fig. 1.1 and record these measurements in your table.