11 markmedium
Which diagram shows a flower from a monocotyledon?
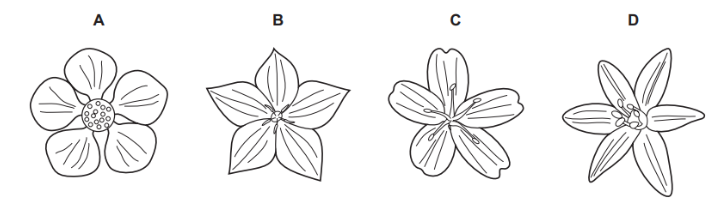
Choose your answer
24 questions · 60 marks · ≈ 60 min · spans 21 of 54 topics
Assembled from the topic question banks — not an official Cambridge International paperWhich diagram shows a flower from a monocotyledon?
Choose your answer
The diagram shows some of the blood vessels and other structures in the human body.
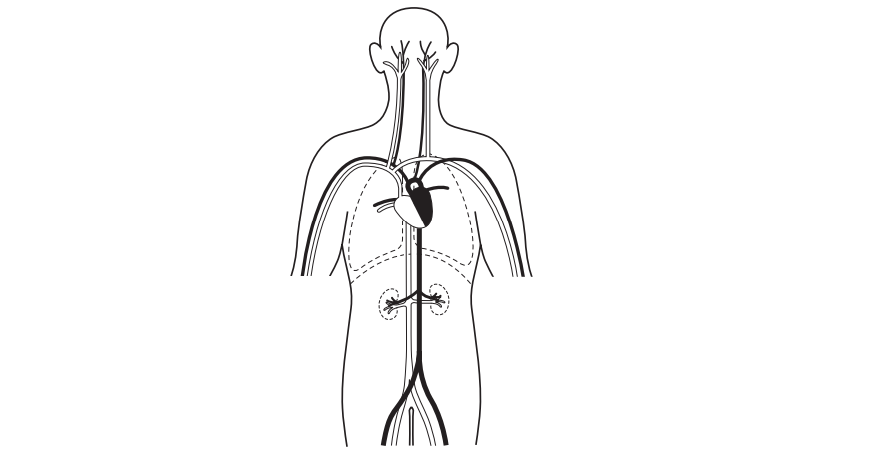
The blood vessels shown are all parts of the same
Choose your answer
cell.
organ.
organ system.
tissue.
How does a water vapour molecule move out of the air space of a leaf into the atmosphere on a dry day?
Choose your answer
Active transport
Diffusion
Evaporation
Transpiration
Which drawing represents the general structure of an amino acid molecule that would be found in Nature?
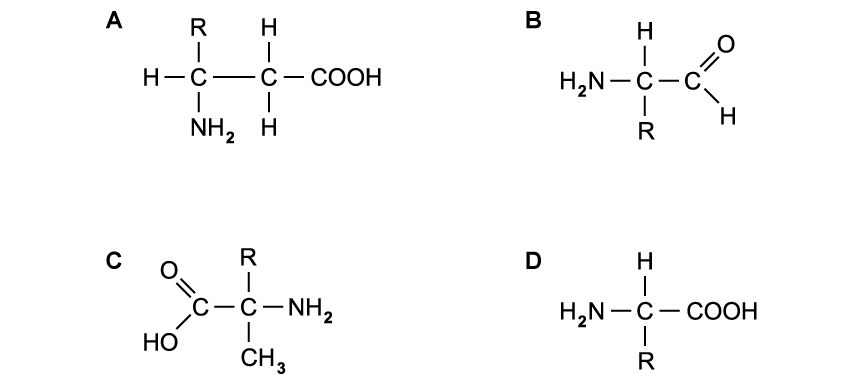
Choose your answer
A student wrote some notes about enzymes.
She wrote:
‘The …1… of an enzyme is …2… to an area on the substrate.
This area on the substrate can fit into it to form an …3… complex’.
Which words correctly complete gaps 1, 2 and 3?
| 1 | 2 | 3 | |
|---|---|---|---|
| A | active site | complementary | enzyme-substrate |
| B | active site | similar | enzyme-product |
| C | shape | complementary | enzyme-product |
| D | shape | similar | enzyme-substrate |
Choose your answer
The diagram below shows a palisade mesophyll cell found in the leaves of plants.
In which region of the cell would starch be stored?
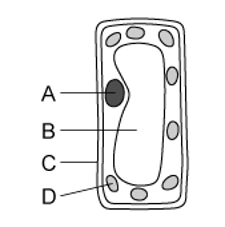
Choose your answer
What are the products when proteins are broken down?
Choose your answer
amino acids
fatty acids
glycerol
simple sugars
The diagram shows an onion plant that has been grown from a seed. Each onion plant takes two years to flower and produce more seeds.
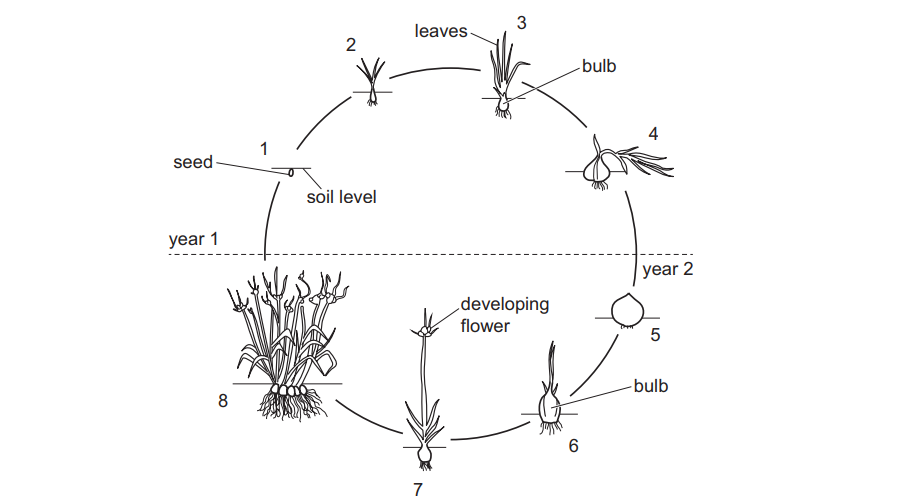
What is the onion bulb acting as in stage 3 and in stage 6?
| stage 3 | stage 6 | |
|---|---|---|
| A | sink | sink |
| B | sink | source |
| C | source | sink |
| D | source | source |
Choose your answer
In which list of the following do all three blood vessels carry deoxygenated blood?
Choose your answer
aorta, pulmonary vein, renal artery
vena cava, pulmonary vein, renal vein
vena cava, pulmonary artery, renal vein
aorta, pulmonary artery, renal artery
The graph shows the response of the body to vaccination.
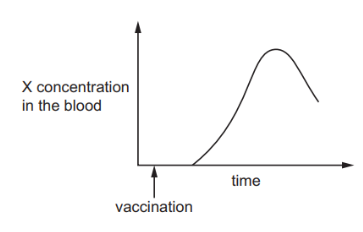
Which word should be used to replace the letter X, to complete the label on the y-axis?
Choose your answer
Antibody
Antigen
Pathogen
Platelet
Below are statements about the features of gas exchange surfaces in humans.
Which statements are correct?
Choose your answer
1 only
1, 2 and 3 only
1 and 3 only
1, 3 and 4 only
What is the balanced chemical equation for anaerobic respiration in yeast?
Choose your answer
C6H12O6 → 2CO2 + 6H2O
C6H12O6 → 6CO2 + 6H2O
C6H12O6 → 2C2H5OH + 2CO2
C6H12O6 → 2C2H5OH + 2H2O
Each kidney contains one million kidney tubules called nephrons. A nephron is shown in the image below.
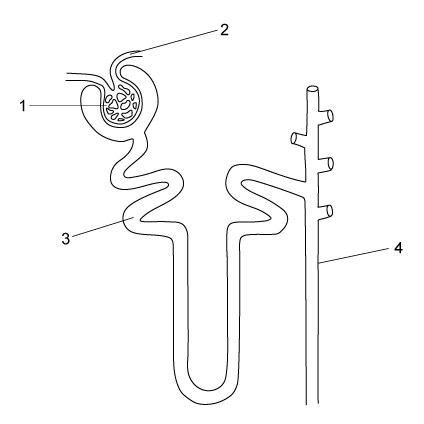
Which row of the table below correctly shows where filtration and selective reabsorption occur?
| filtration | selective reabsorption | |
|---|---|---|
| A | 1 | 2 |
| B | 2 | 4 |
| C | 2 | 3 |
| D | 1 | 3 |
Choose your answer
A group of students set up an experiment to investigate growth responses in plants.
In one of the experiments, they placed a plant shoot in a box with a small window allowing light to fall on one side of the shoot only.
Which of the following options correctly describes and explains what happened in the student’s experiment?
| response | cause | effect | |
|---|---|---|---|
| A | positive phototropism | more auxin on side of shoot exposed to light | slower growth on shaded side of shoot |
| B | positive phototropism | more auxin on shaded side of shoot | slower growth on side of shoot exposed to light |
| C | negative gravitropism | even distribution of auxins | equal rates of growth |
| D | positive phototropism | less auxin on shaded side of shoot | faster growth on side of shoot exposed to light |
Choose your answer
The data in the graph shows the effect of an antibiotic on the population of bacteria in the blood.
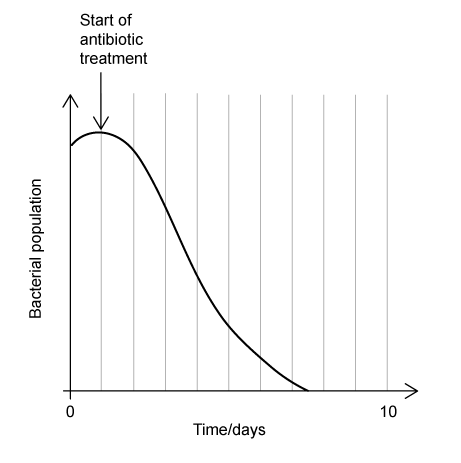
What can be concluded from the data in the graph?
Choose your answer
Antibiotics take 10 days to kill all bacteria.
Antibiotics cause a reduction in division of bacteria.
Antibiotics are effective against viral and bacterial infections.
Before the start of the antibiotic treatment the bacterial population was increasing.
What is an example of sexual reproduction?
Choose your answer
One bacterial cell dividing to produce two daughter bacterial cells
One banana plant being divided into two banana plants
One pollen grain nucleus fusing with one ovule nucleus in a flower
One yeast cell producing buds which separate to become new yeast cells
When gametes are produced, cells undergo division by
Choose your answer
mitosis to produce genetically identical cells.
mitosis to produce genetically different cells.
meiosis to produce genetically identical cells.
meiosis to produce genetically different cells.
An island’s entire population of a species of butterfly are descended from just two parents. These were introduced from the mainland.
Which of the following statements about this species of butterfly, compared with that of the mainland, is correct?
Choose your answer
The population shows more genetic variety.
The population will adapt more slowly to environmental changes.
The population shows more phenotypic variation.
The population is less in danger of collapsing from disease.
What is an example of a population?
Choose your answer
all the arthropods in a pond
all the crocodiles in a river
all the plants in a wood
all the zebras that lived from 1990–2010
The following statements refer to plastic pollution.
Which of these statements applies to both marine and terrestrial (land) habitats?
Choose your answer
1, 2 and 3
2 and 4 only
1 and 3 only
3 only
The following statements describe biofuel.
Which of these statements could be considered an advantage of biofuel?
Choose your answer
1, 2 and 4
2 and 3 only
2 only
2 and 4 only
Woodlice were used to investigate their sensitivity to different conditions. A choice chamber was set up with four different compartments: light and dry, light and moist, dark and dry, dark and moist.
A student placed 15 woodlice into the choice chamber and then recorded the number of woodlice in each compartment after a period of 10 minutes. They then removed all the woodlice and repeated the experiment twice more.
Choice chambers allow us to know what environmental conditions animals prefer when looking for suitable habitats.
Fig. 1 shows the experimental set up of the choice chamber used.
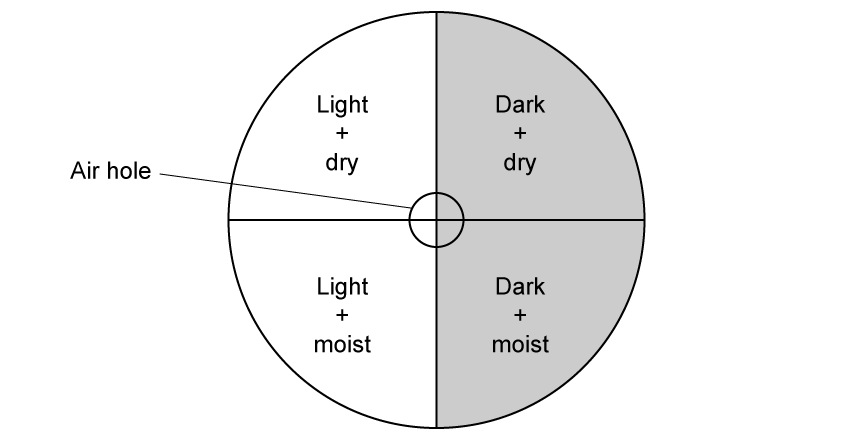
Fig. 1
(i)
Explain why the student left the woodlice in the choice chamber for 10 minutes before counting the woodlice in each chamber.
(1 mark)
(ii)
State two variables that should be kept constant throughout the investigation.
(2 marks)
(iii)
For one of the variables stated in part (ii), describe how to keep this constant.
(1 mark)
Extract:
Woodlice were used to investigate their sensitivity to different conditions. A choice chamber was set up with four different compartments: light and dry, light and moist, dark and dry, dark and moist.
A student placed 15 woodlice into the choice chamber and then recorded the number of woodlice in each compartment after a period of 10 minutes. They then removed all the woodlice and repeated the experiment twice more.
Choice chambers allow us to know what environmental conditions animals prefer when looking for suitable habitats.
(i)
Identify one possible hazard associated with carrying out the experiment.
(1 mark)
(ii)
Describe the safety precautions associated with the hazard identified in part (i).
(1 mark)
(iii)
Describe the ethical considerations when using living organisms such as woodlice.
(2 marks)
Extract:
Woodlice were used to investigate their sensitivity to different conditions. A choice chamber was set up with four different compartments: light and dry, light and moist, dark and dry, dark and moist.
A student placed 15 woodlice into the choice chamber and then recorded the number of woodlice in each compartment after a period of 10 minutes. They then removed all the woodlice and repeated the experiment twice more.
Create a table in which the student could record their results
Extract:
Woodlice were used to investigate their sensitivity to different conditions. A choice chamber was set up with four different compartments: light and dry, light and moist, dark and dry, dark and moist.
A student placed 15 woodlice into the choice chamber and then recorded the number of woodlice in each compartment after a period of 10 minutes. They then removed all the woodlice and repeated the experiment twice more.
Choice chambers allow us to know what environmental conditions animals prefer when looking for suitable habitats.
Describe how you could adapt this experiment to investigate the sensitivity of woodlice to temperature changes.
Fig. 1.1 is a dichotomous key. It can be used to identify different types of tree by using their leaves.
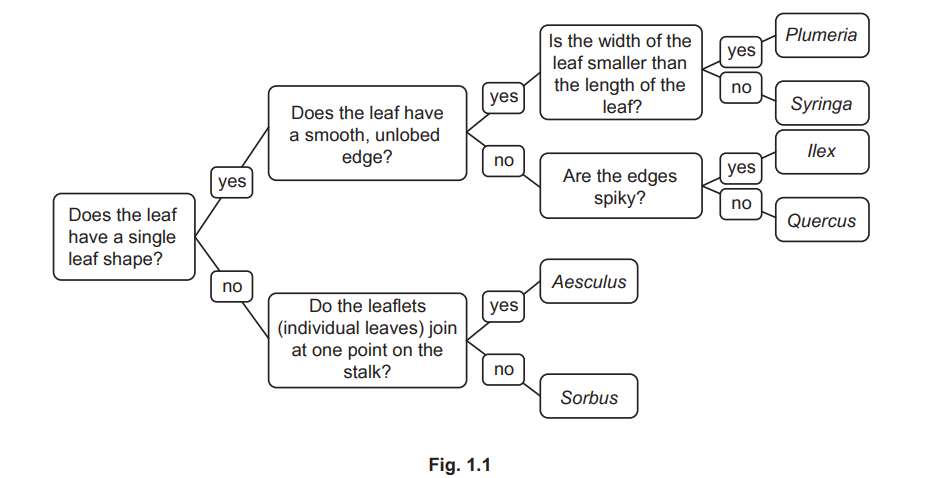
Fig. 1.2 shows leaves from six different trees.
Use the key in Fig. 1.1 to identify the six different types of tree.
Write the name of each tree on the lines in Fig. 1.2.
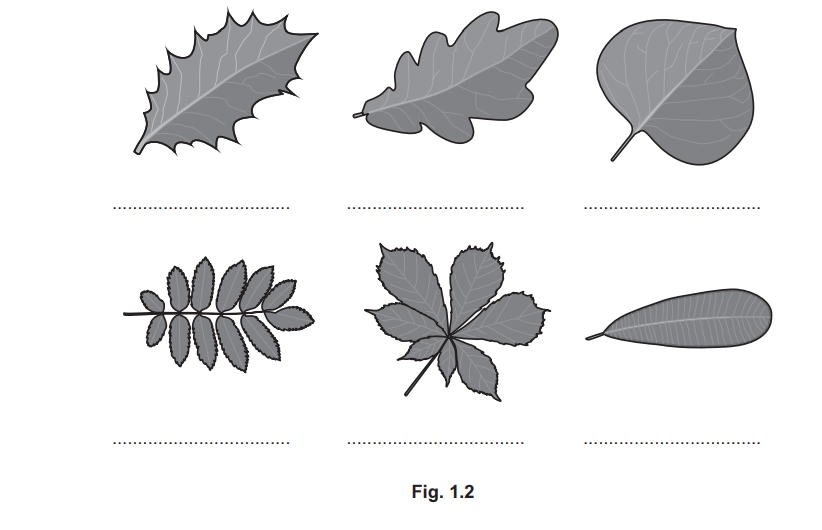
Fig. 1 shows a cross section through a beetroot.
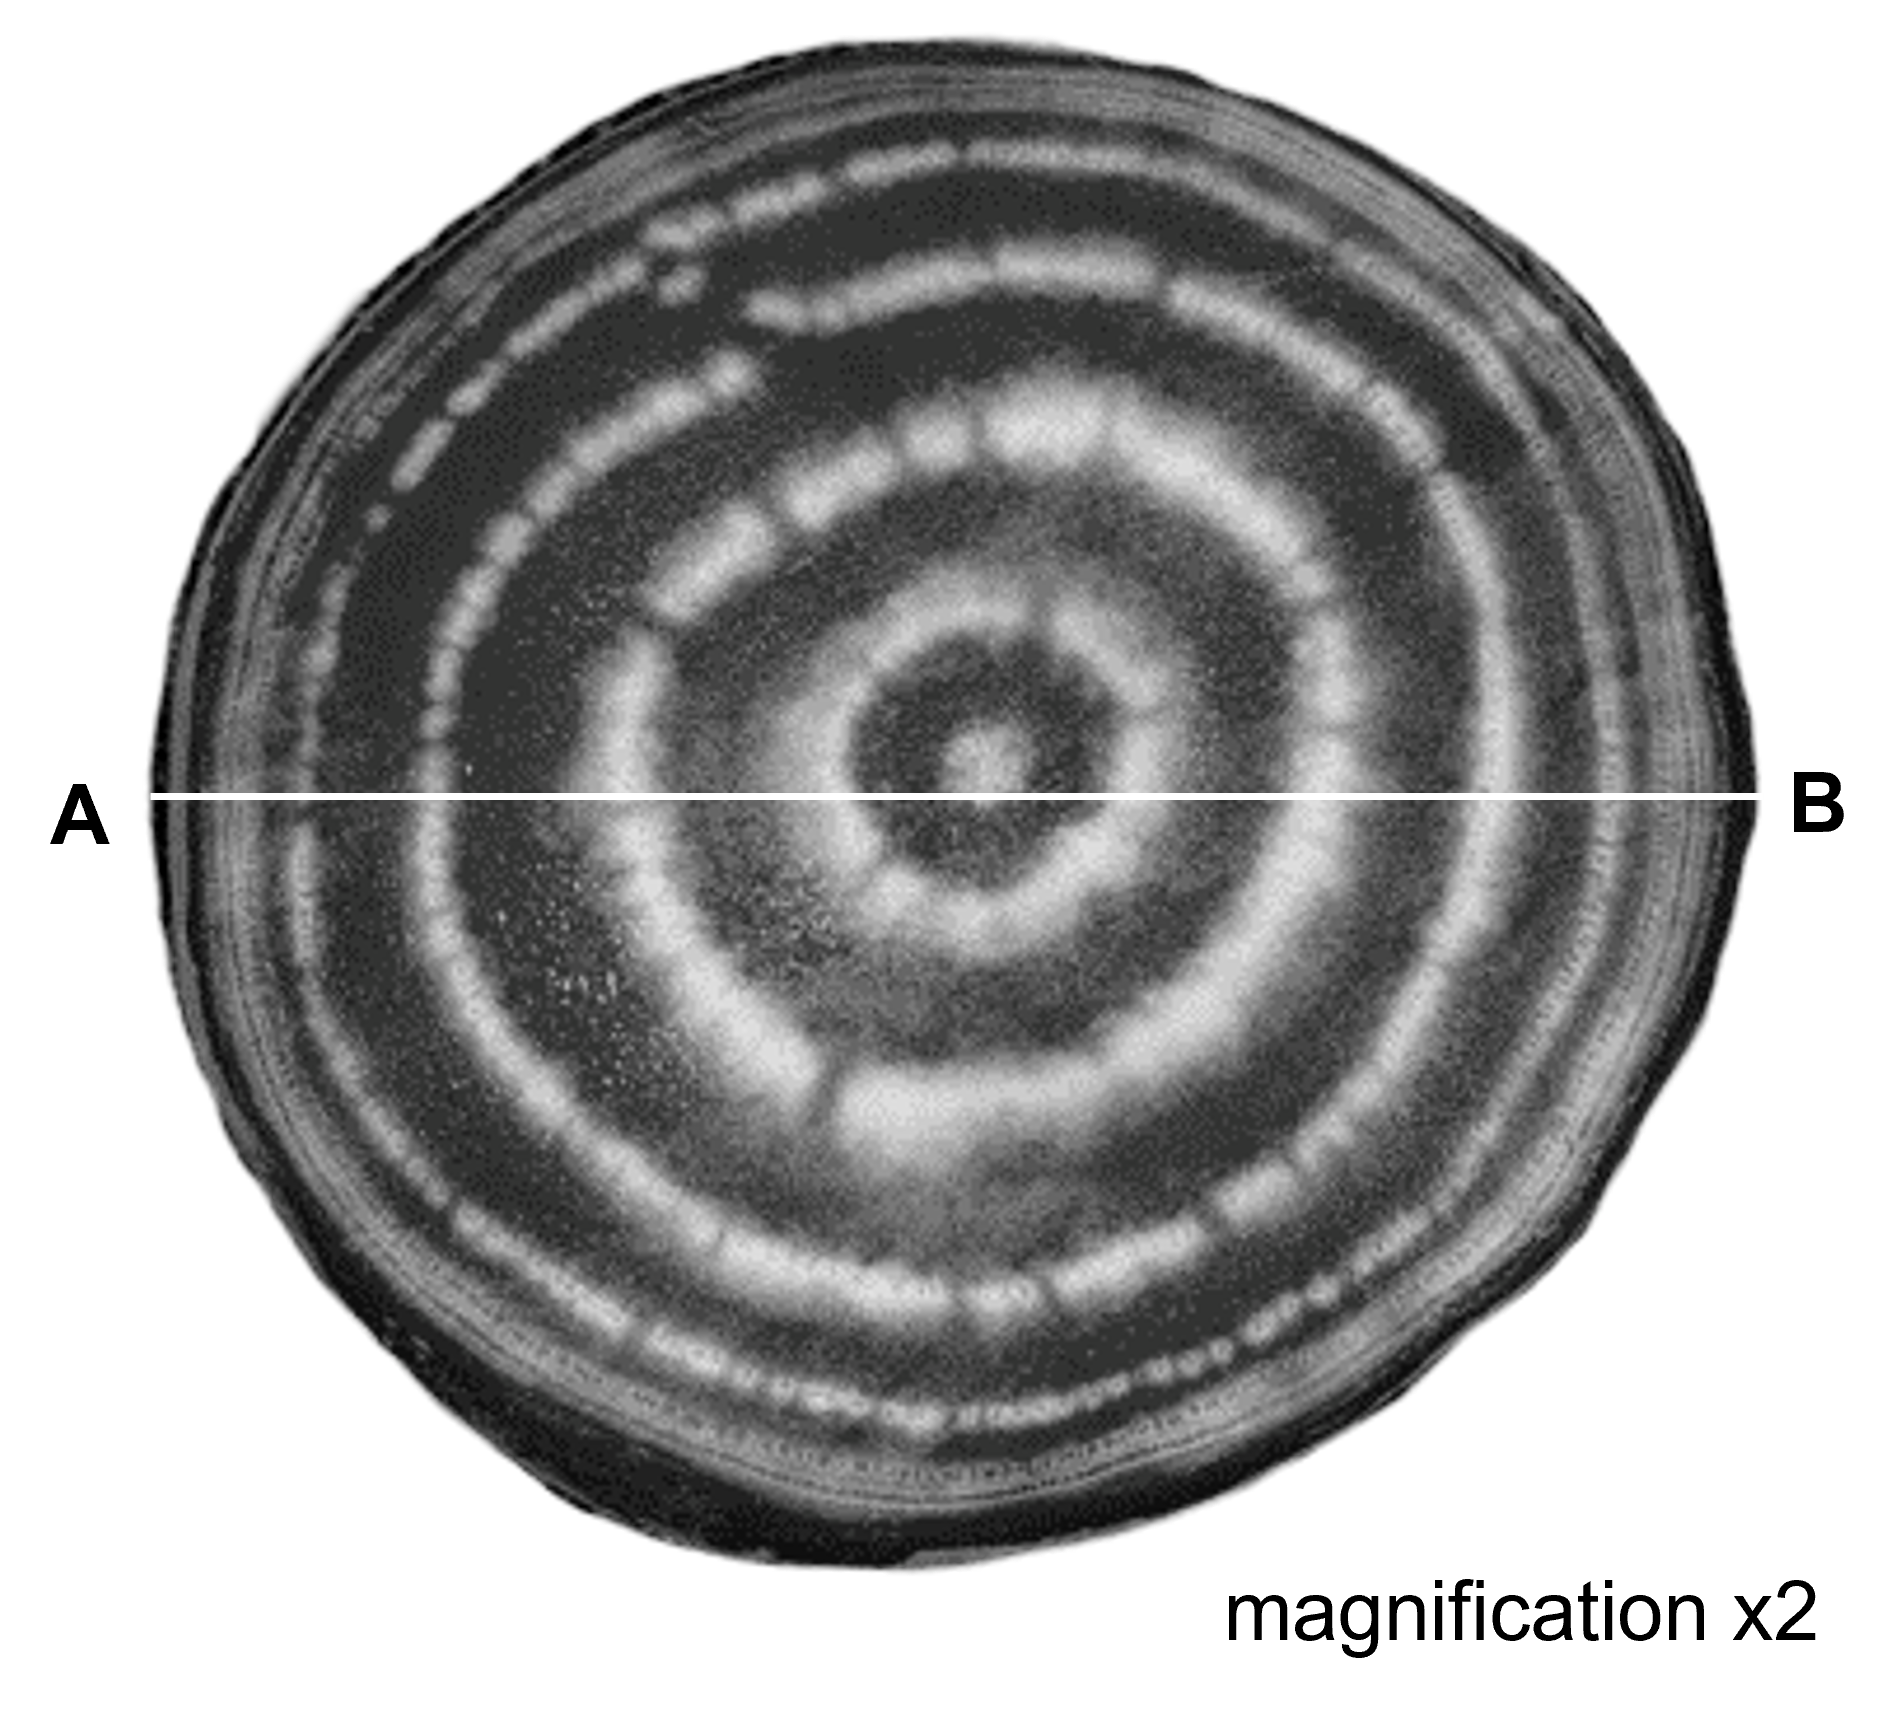
Image courtesy of Joergens.mi. Original image located at: //commons.wikimedia.org/wiki/File:Beetroot_jm27958.jpg. Licenced under CC-BY-SA-3.0 under conditions found at: https://creativecommons.org/licenses/by-sa/3.0/deed.en.
Fig. 1
(i)
Draw a large diagram of the beetroot in Fig. 1. Do not label your drawing or include line AB.
(4 marks)
(ii)
The magnification of the beetroot in Fig. 1 is x2.
The length of line AB is 10 cm.
Calculate the actual width of the beetroot using the formula and the measurement of line AB.
Show your working.
(2 marks)
Students conducted an experiment to investigate the effect of temperature on plant cell membranes. They followed the experimental procedure described below.
Table 1 shows the results of the investigation.
Table 1
| temperature / °C | transmission of light / % | |||
|---|---|---|---|---|
| trial 1 | trial 2 | trial 3 | mean | |
| 0 | 100 | 99.4 | 99.1 | 99.5 |
| 20 | 95.6 | 97.0 | 96.3 | 96.3 |
| 40 | 79.3 | 80.7 | 78.9 | 79.6 |
| 60 | 31.1 | 30.6 | 29.7 | |
| 80 | 0.8 | 0.8 | 0.9 | 0.8 |
| 100 | 0.0 | 0.0 | 0.0 | 0.0 |
(i)
Identify the independent and dependent variable for this investigation.
(2 marks)
(ii)
State two safety precautions that should be followed during the experimental procedure.
(2 marks)
Extract:
Table 1
temperature / °C | transmission of light / % | trial 1 | trial 2 | trial 3 | mean | | 0 | 100 | 99.4 | 99.1 | 99.5 | | 20 | 95.6 | 97.0 | 96.3 | 96.3 | | 40 | 79.3 | 80.7 | 78.9 | 79.6 | | 60 | 31.1 | 30.6 | 29.7 | | | 80 | 0.8 | 0.8 | 0.9 | 0.8 | | 100 | 0.0 | 0.0 | 0.0 | 0.0 |
(i)
Use the data in Table 1 to calculate the mean percentage of light transmitted at a temperature of 60°C.
Give your answer to three significant figures.
(1 mark)
(ii)
Use the grid below to plot a line graph of temperature against the mean percentage of light transmitted from Table 1.

(4 marks)
Extract:
The experiment was repeated two more times. Table 1 shows the results of the investigation. | temperature / °C | transmission of light / % | trial 1 | trial 2 | trial 3 | mean | ... (data table showing three trials for each temperature) ...
Explain the importance of repeating the experiment several times.